Synthesis, Characterization and Electrochemical Study of Graphene Oxide-Multi Walled Carbon Nanotube-Manganese Oxide-Polyaniline Electrode as Supercapacitor
[Mir Ghasem Hosseini*  , Elham Shahryari]
, Elham Shahryari]
|
|


The synthesis of graphene oxide-multi walled carbon nanotube-manganese oxide-polyaniline namely (GMMP) nanocomposite for application in supercapacitor devices was investigated. Morphology of the nanocomposites was studied by X-ray diffraction (XRD), Fourier transform infrared (FT-IR) spectroscopy, scanning electron microscopy (SEM), transmission electron microscopy (TEM) and energy dispersive X-ray microanalysis (EDX). The electrochemical properties of nanocomposite based electrodes were investigated by cyclic voltammetry (CV), galvanostatic charge-discharge and electrochemical impedance spectroscopy (EIS) techniques in 0.5 mol/L Na2SO4. The specific capacitances of 173.00, 127.85, 87.50, 58.65 and 12.00 (mF cm-2) were obtained for GMMP, GMP (GO-MWCNT-PANI), GMM (GO-MWCNT-MnO2), GM (GO-MWCNT) and G (GO) at a scan rate of 10 mV s-1, respectively. Also, GMMP nanocomposite retained 90% initial capacitance after 200 cycle of charge-discharge. The good electrochemical response of this nanocomposite is due to the combination of the electrical double layer capacitance of GO and MWCNT and the gradual introduction of pseudo-capacitance through the redox processes of PANI, -COOH, -OH (in MWCNT-COOH, GO-COOH and GO-OH) and MnO2. This revealed the synergistic effect of PANI, MnO2, -OH -COOH on the carbon based support.
Supercapacitors (SCs) are appealing energy storage devices that have attracted significant attention, essentially due to their high power density, long life cycle, and bridging function for the power/energy gap between customary dielectric capacitors (which cause high power production) and batteries/fuel cells (which cause high energy storage)[1]. SCs are of two types. One is the interfacial double-layer capacitance with electric charge storage on high-surface-area carbon materials. The other is pseudo-capacitance, which is connected with the redox reaction of transition metal oxides or conducting polymers[2, 3, 4, 5, 6, 7]. The determination of electrochemically active materials in SCs is vital and it must stick to the particular attributes to create an efficient energy storage device. Carbon-based materials, conducting polymers and transition metal oxides are broadly applied independently or as composites in the development of SCs. Nanostructured carbons, such as carbon nanotubes (CNTs) and graphene represent the primary material choice for the ideally polarized SC electrodes owing to their extensive surface area, porosity, electrical stability, and also naturally low electrical resistance[8, 9]. Among the transition metal oxides, manganese dioxide (MnO2) is one of the most stable manganese oxides with great physical and chemical properties under ambient conditions[10, 11, 12, 13]. In addition to the MnO2, much effort has been committed to the development of SCs utilizing polyaniline (PANI)[14, 15, 16]. The combination of pseudo-capacitance and electric double layer capacitance offers impressively higher capacitance values. However, pseudo-capacitive materials have a tendency to suffer from low conductivity[17]. The combination of highly conductive carbon-based and pseudo-capacitive materials is a potential solution for overcoming these difficulties. Therefore, SCs based on carbon/polymer/metal oxide hybrids have recently been broadly explored[11, 17, 18]. Recent studies have shown that the combination of PANI and MnO2 with carbon nanotubes (CNTs) can significantly improve the conductivity and electro catalytic activity of the resultant electrode materials[19, 20, 21, 22, 23, 24]. MWCNTs are a class of carbonaceous materials that have the trouble of dispersing uniformly in any solvent as they tend to agglomerate. To solve this problem, functionalization of carbon nanotubes with -COOH groups has been widely reported[25]. Graphene is another class of carbonaceous materials that has demonstrated the advantages of high conductivity, simplicity of generation and function, and abundance of inexpensive source material[26, 27]. Graphene oxide (GO)[27, 28], a critical derivative of graphene, has a large number of oxygen functional groups bearing on the basal planes and edges such as carboxyl groups[29, 30]. To enhance the capacitive behavior of MWCNT, they have been blended with conducting polymers[20, 31], metal oxides[1, 32] and different carbonaceous materials[25].
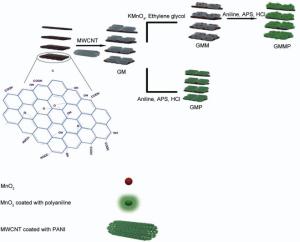
In this paper, G, GM, GMM, GMP and GMMP nanocomposites were prepared. The GMMP nanocomposite was synthesized via in situ chemical oxidative polymerization of polyaniline on the MnO2 decorated graphene oxide sheets, which was obtained using a water-ethylene glycol system in the presence of KMnO4. The effect of -COOH, -OH, MnO2 and PANI on the supercapacitive behavior of carbon based was studied. The obtained nanocomposite makes full utilization of the advantages of each ingredient and shows very good electrochemical performance in SC.
Graphene oxide was synthesized from natural graphite (Sinchem, SK 4206.0500, Cas. No: 7782-42-5, Made in South Korea) modified by Hummers method[33]. Graphite (5 g) and NaNO3 (2.5 g) were mixed with 120 mL of H2SO4 (95%) in a 500 mL flask. The mixture was stirred for 30 min within an ice bath. While maintaining vigorous stirring, potassium permanganate (15 g) was added to the suspension. The rate of addition was carefully controlled to keep the reaction temperature lower than 20 ° C. The ice bath was then removed, and the mixture was stirred at room temperature overnight. As the reaction progressed, the mixture gradually became pasty, and the color turned into light brownish. At the end, 150 mL of H2O was slowly added to the pasty with vigorous agitation. The reaction temperature was rapidly increased to 98 ° C. The diluted suspension was stirred at 98 ° C for one day. Then, 50 mL of 30% H2O2 was added to the mixture. For purification, the mixture was centrifuged with 5% HCl and then washed with deionized (DI) water for several times. After filtration and drying under vacuum, the graphene oxide (GO) was obtained as a gray powder.
MWCNT (> 95%, is purchased from neutrino which contains 2.56 wt% of COOH) powder was added into 25 mL of diluted GO dispersion in water with a mass ratio of 1:1. Then the dispersion was sonicated for 1 h in an ultrasonicator (BANDELIN SONOREX DIGITEC). The obtained dispersion was dried at 100 ° C for 24 h.
GMM was prepared at room temperature by the addition of ethylene glycol (extra pure) to the aqueous solution of KMnO4. Typically, 0.5 g KMnO4 (Merck) was dissolved in 30 mL de-ionized water, and then 20 mg of GM was added to the above solution. Later 10 mL ethylene glycol was drop-wise added in it under stirring. The addition of alcohol led to the formation of brownish precipitate of MnO2. The mixture was continually stirred for 24 h and then precipitates were filtered, washed with de-ionized water and alcohol and dried at 60 ° C for 24 h.
The coating of PANI fibers on the sheets of the GM nanocomposite was done by in situchemical oxidative polymerization using aniline as the monomer and ammonium persulfate (APS) as the oxidant in 1 mol/L HCl solution and the molar ratio of aniline to APS was 4:1. The typical procedure is as follows: the aniline solution (0.3 mol/L) was added to the 1 mol/L HCl and then GM nanocomposite (25 mg) was dispersed in the above solution with the help of ultrasound. Then aqueous solution of APS was added to initiate the polymerization of aniline and the reaction continued at ambient temperature overnight. The GMP nanocomposite was washed with deionized (DI) water and the resulting product was then dried under vacuum at 40 ° C.
The coating of PANI on the sheets of the GMM nanocomposite was completed by in situchemical oxidative polymerization, using aniline as the monomer and APS as the oxidant in 1 mol/L HCl solution as section 2.4. Fig. 1 shows the schematic for the synthesis procedure of GMMP.
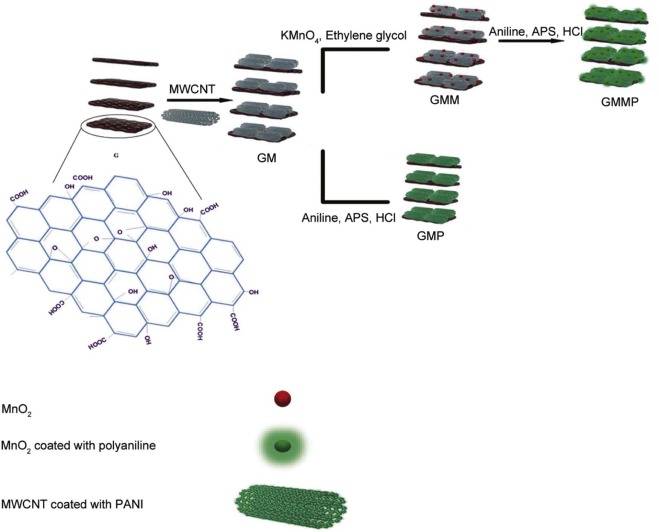 | Fig. 1. Schematic illustration for the synthesis of GMMP. |
Morphology and surface analysis of the nanocomposites were characterized with a scanning electron microscopy (SEM, MIRA3FEG-SEM, Tescan), transmission electron microscopy (TEM, LEO 906 E (100 kV)) and energy dispersive X-ray (EDX). FT-IR spectra were recorded on Perkin-Elmer FT-IR spectrophotometer (500-4000 cm-1). KBr pellet technique was used to prepare samples for recording FT-IR spectrum. The powder X-ray diffraction (XRD) patterns were measured on a Zimens D5000 X-ray diffractometer using Cu Kα radiation.
To prepare the working electrodes, samples, carbon black, and polytetrafluroethylene (PTFE, which was purchased from SIGMA-ALDRICH, CAS, No. 9002-84-0) were mixed (70:20:10, w/w) and dispersed in N-Methyl-2-pyrrolidone (NMP). The mixture was coated on graphite electrode (1 cm2), and dried at 100 ° C for 12 h.
The electrochemical experiments were performed in a three-electrode cell arrangement. A platinum sheet with a geometric area of about 20 cm2 was used as a counter electrode, and the potentials were measured with respect to standard calomel reference electrode (SCE). Electrochemical experiments were carried out using a Princeton Applied Research, EG& G PARSTAT 2263 Advanced Electrochemical system run by PowerSuite software. Cyclic voltammetry measurements were carried out in 0.5 mol/L Na2SO4 solution at a scan rate of 10 to 50 mV s-1 in a voltage range of -1.0 to 1.0 V. Galvanostatic charge/discharge curves were measured at a current density of 4 mA cm-2. Electrochemical impedance measurements were carried out by applying an AC voltage of 10 mV amplitude in the 100 kHz to 10 mHz frequency range. Fit and analysis of EIS data were performed with ZSimTM 3.22 software (Table 1).
| Table 1. EDL capacitive and pseudo-capacitive components in the individual nanocomposite |
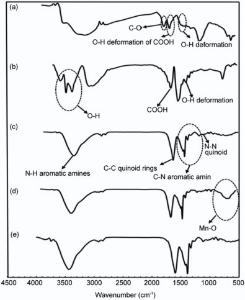
The FT-IR spectra of the G and nanocomposites in the range of 500-4500 cm-1 were shown in Fig. 2. FT-IR analysis revealed that the characteristic peaks of G (Fig. 2a) appeared at 1723 cm-1 (C=O stretching vibrations of COOH groups), 1620 cm-1 (O-H deformation vibrations of COOH groups), 1395 cm-1 (O-H deformation vibrations of tertiary C-OH)[34, 35]. After the reaction with MWCNT in Fig. 2(b), the peak of 1395 cm-1(O-H deformation) still remains. The new peaks emerging at 1680 cm-1 and 3300-3600 cm-1 correspond to carboxyl groups and hydroxyl groups, respectively. In Fig. 2(c), the characteristic absorption bands in the 1200-1400 cm-1 correspond to the C-N stretching band of an aromatic amine[36]. The peaks around 1590 cm-1 (assigned as C=C stretching of the quinoid rings), 1413 cm-1 (C=C stretching deformation of benzoid ring), 1145 cm-1(N-N quinoid), and 825 cm-1 (out-of-plane deformation of C-H in the benzene ring)[37]. The bands in the region of 1000-1150 cm-1 are due to the plane bending vibration of C-H mode. The band observed at 3444 cm-1 is due to the N-H stretching of aromatic amines vibrations[37]. In Fig. 2(d), the broad peak at 400-800 cm-1 is attributed to the Mn-O bending vibration[38, 39]. In Fig. 2(e), the peak of Mn-O disappeared and the characteristic peaks of PANI were investigated again which can be considered that PANI has been covered with MWCNT. This suggests that the nanocomposite contains high percentage of the polyaniline compared to the manganese oxide and small shifts in the peaks' location are attributed to the interactions between polyaniline, carbon materials and MnO2.
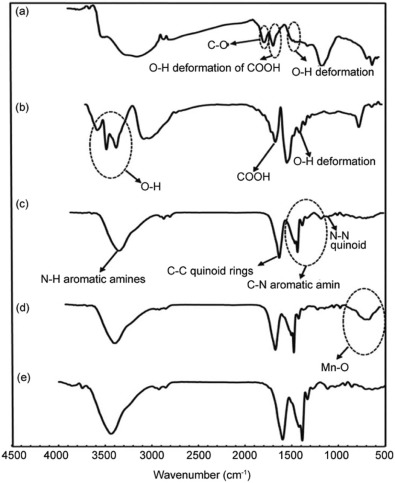 | Fig. 2. FT-IR spectrum of (a) G, (b) GM, (c) GMP, (d) GMM and (e) GMMP. |
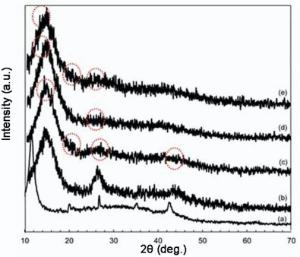
The XRD patterns of the nanocomposites are illustrated in Fig. 3. The XRD pattern of G exhibited a sharp peak centered at 11.68° and one in 42.38° corresponding to the (002) and (100) plans, respectively. After being mixed with MWCNT, the diffraction intensity of G peak at 11.8° was reduced and shifted to the right. It can be seen that GM displays the peaks at 2θ of 26.3° , 2θ of 42.7° and 2θ of 50.8° corresponding to the (002), (100) and (102) plans that were attributed to the combination of GM form of graphite. The diffractions of 2θ of about 13.9° , 2θ of about 20° and a broad band at 25° can be found in obtained PANI salt. These peaks are related to the emeraldine salt forms of PANI. The peak at 2θ of about 20° may be ascribed to a periodicity parallel to the polymer chain, and the peak at 2θ of about 25° may be caused by the periodicity perpendicular to the polymer chain[38, 39, 40]. The peak at 2θ of about 20° indicates the characteristic distance between the benzene ring planes in nearby chains. From Fig. 3(d), a peak at 2θ of 13° and a weak peak at 2θ of 25° can be indexed to birnessite-type MnO2 corresponding to (001) and (002) basal reflections[41]. In Fig. 3(e), the peaks of the PANI were investigated again which can be assumed that PANI has been successfully synthesized on the carbon based material.
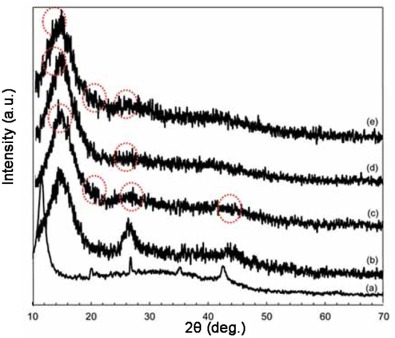 | Fig. 3. XRD patterns of (a) G, (b) GM, (c) GMP, (d) GMM and (e) GMMP. |
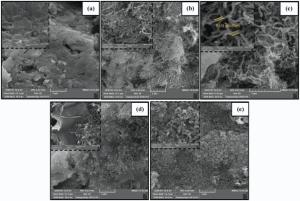
The morphology and structure of G and all the nanocomposites were characterized using SEM (Fig. 4) and TEM (Fig. 5). The G prepared here has a typically curved, laminar and layered structure (Fig. 4a). SEM images show that MWCNT were located on G sheets. It can be observed from Fig. 4(c) that GM sheets are homogeneously surrounded with PANI nanofibers. After being treated with KMnO4 in a water-ethylene glycol system, the MnO2nanoparticles are successfully deposited on the G and MWCNT, as shown in Fig. 4(d). After the polymerization of the GMM, it can be seen that the PANI nanofibers are homogeneously and compactly coated on the sheets of GMM.
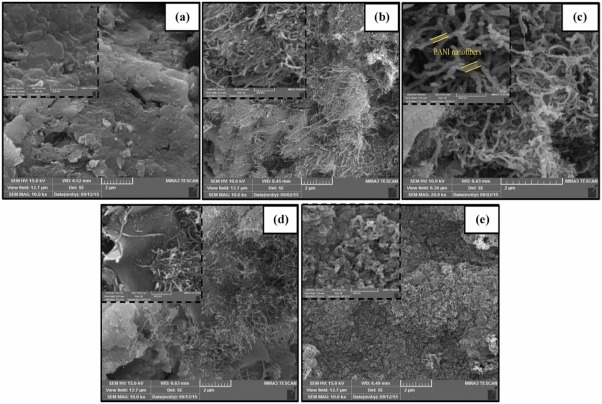 | Fig. 4. SEM photographs of (a) G, (b) GM, (c) GMP, (d) GMM and (e) GMMP. |
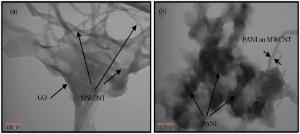
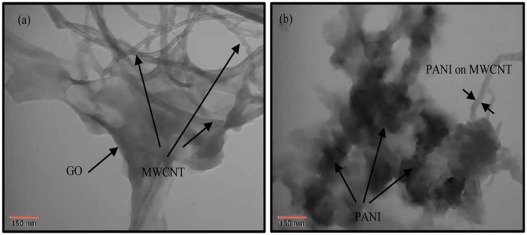 | Fig. 5. TEM images of the as-prepared nanocomposites: (a) GM and (b) GMMP. |
TEM images (Fig. 5) strongly confirm the formation of GM and GMMP hybrids. TEM image of the GM nanocomposite (Fig. 5a) demonstrates that MWCNT is absorbed on the surface of GO. The average diameter of MWCNT is about 15-25 nm. It can be observed fromFig. 5(b) that the GMM sheets were coated compactly with PANI nanofibers. It is obvious that there is a thin and uniform layer of PANI on the MWCNT that causes an increase in the diameter of the MWCNT (diameter ≈ 40 nm). The TEM images have more approved the SEM results.
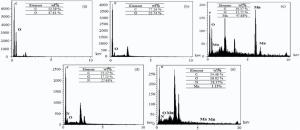
Fig. 6 shows the EDX analysis of the nanocomposites. The elemental components of the nanocomposites are also inserted in each section of Fig. 6. After deposition of MnO2 on the GM surface, 47.88% Mn appeared in Fig. 6(c). Polymerization of this nanocomposite was approved more by the appearance of N peaks in Fig. 6(e). These results also approved more the FT-IR and XRD results.
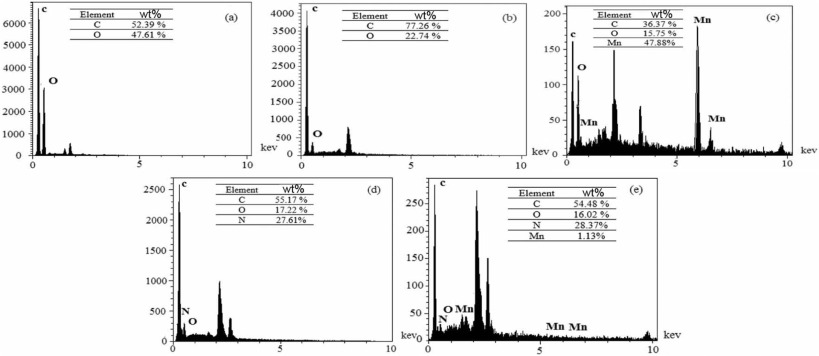 | Fig. 6. EDX analysis of (a) G, (b) GM, (c) GMM, (d) GMP and (e) GMMP. |
The redox reaction between carbon and KMnO4 in a neutral pH solution is as follows[42]:
In this reaction, the carbon substrate serves as a sacrificial reductant and converts aqueous permanganate (MnO4-) to insoluble MnO2, which in turn, deposits on the surfaces of G and MWCNT.
The redox reaction with the help of ethylene glycol, leads to the formation of MnO2 and other oxidized products, such as aldehydes or a mixture of aldehydes, carboxylic acids and even CO2, which is as follows[42]:
 |
where X = glyoxal, oxalic acid, CO2 or a mixture of them.
The aniline molecules are initiated to polymerize on the GMM sheets with the addition of APS in ambient temperature. In this system, the oxidant for the oxidative polymerization of aniline included two alternatives of MnO2 and APS. The redox potential of S2O82-/SO42-was higher than that of MnO2/Mn2+, as shown in reactions (2) and (3)[42]. It could be inferred that APS prioritized the initiation of the aniline polymerization, which could effectively prevent the consumption of MnO2 to construct GMMP composite.
MnO2+4H++2e-↔ Mn2++2H2O E0=+1.23V (4)
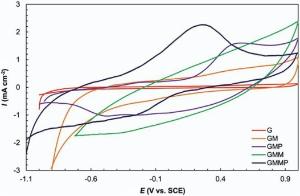
Cyclic voltammetry measurements were carried out to determine the electrochemical performance of G, GM, GMP, GMM, and GMMP. The curves in Fig. 7 are recorded in a 0.5 mol/L Na2SO4 electrolyte within a potential window of -1.0 to +1.0 V versus SCE reference electrode at 10 mV s-1. The nearly rectangular shape of pure G and GM originated from the charge storage process of G and GM due to the formation of electrochemical double layer (EDL) and non-faradic current response. Adding up MnO2 and PANI, the shapes of the CV curves were changed and not in rectangular shape and cause an increase in the current density at the same scan rate. GM has various oxygen functional groups (e.g. hydroxyl and carboxyl groups) on its basal planes and edges. These functional groups act as anchor sites and enable the subsequent in situ polymerization of PANI attaching on the surfaces and edges of GM. Besides, theπ -π stacking force between the phenyl and basal planes of G was also beneficial to in situ polymerization occurring on the surface of G [43]. In all the nanocomposites (GMM, GMP, GMMP), the electrochemical behavior arises from both the mechanisms, namely; double layer phenomenon due to the G and GM, and pseudo-capacitance phenomenon due to the presence of PANI, -OH group, -COOH group, and MnO2. The -COOH and -OH functional groups in GM dissociate to produce H+ and G/GM-COO- or G/GM-O- ions which then absorb the Na+ from the electrolyte (Na2SO4) undergoing redox reactions. The released H+ ions (in addition to the ions from electrolyte) are absorbed by PANI, thereby increasing conduction. It is known that when emeraldine salt (ES) is formed through the doping of EB (emeraldine base) form of PANI by electrolyte ions, it becomes highly electrically conducting. The reverse process probably occurred during the discharging step, whereby the PANI chains translated into emeraldine form upon de-doping of the ions. Furthermore, the surface functionalization of G and GM by oxygen containing groups of -COOH and -OH enhanced carbon surface hydrophilicity (wettability) and caused increment in the electrochemical accessibility of the ions in to the surface of carbon[41]. In the GMMP nanocomposite, the dissociated H+ (from G/GM-COOH and G/GM-OH) and electrolyte ions can react and interact with MnO2 and PANI in GMMP resulting in pseudo-capacitance. The current density of GMMP was higher than other electrodes because of synergistic effect of PANI and MnO2. The shift in redox peaks of GMMP compared with GMP can be attributed to the interaction of PANI and MnO2[37]. It may result from the faradic transition between emeraldine and lucoemeraldine states of PANI [37, 38, 39] and surface process of MnO2, which involves the intercalation of alkali metal cation (Na+) or H+ within the electrode during charging step and de-intercalation during discharging step according to the following reaction[4]:
(MnO2)surface+Na++e-↔ (MnOONa)surface(5)
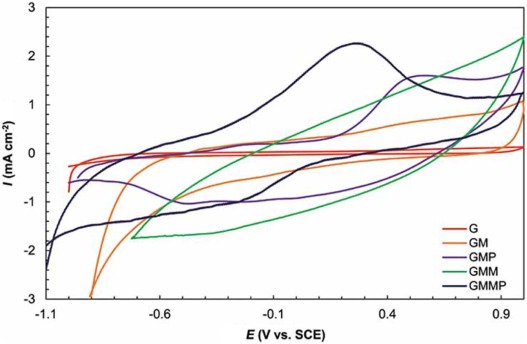 | Fig. 7. Cyclic voltammetry of G, GM, GMP, GMM, GMMP at 10 mV s-1 in 0.5 mol/L Na2SO4. |
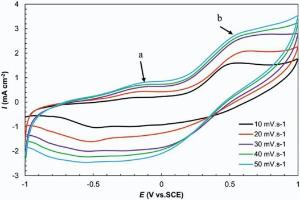
Fig. 8 shows the CV curves of the GMP nanocomposite at scan rates of 10-50 mV s-1 in 0.5 mol/L Na2SO4. It exhibits the pseudo-capacitance arising from the redox reaction (exchange between emeraldine and lucoemeraldine states of PANI) on GM-based support. The observed peaks at the CV curves of the GMP at (Ea ≈ -0.2 V) originate from the oxidation/reduction of -COOH groups, and b (Eb ≈ 0.5 V) arises from the stepwise oxidation to the first radical cation and hence to the bipolaron based on the electron-counter ion coupling, depending on the counter ions' mobility[41].
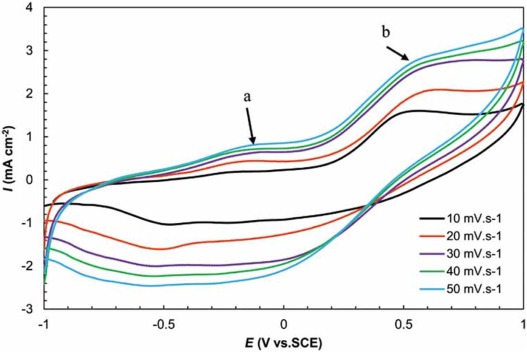 | Fig. 8. Cyclic voltammetry GMP at 10-50 mV s-1 in 0.5 mol/L Na2SO4. |
The current density of the nanocomposite was enhanced by increasing the scan rate. In this figure, while increasing the scan rate, the shapes of the curves do not change significantly, suggesting the good rate capability of the nanocomposite.
The specific capacitance (Csp, mF cm-2) obtained from the CV curves is calculated according to the following equation [38, 39, 44]
where v shows the potential scan rate, Δ V indicates the sweep potential window (V), I(V)is the voltammetric current (A) on CV curves and A is the geometric area of the working electrodes (cm2). The specific capacitances deduced from the CV curves according to Eq. (6) for the GMMP, GMP, GMM, GM and G electrodes were 173.00, 127.85, 87.50, 58.65 and 12.00 (mF cm-2), respectively.
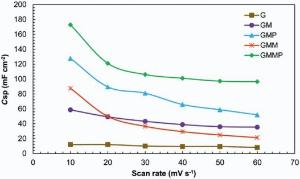
In Fig. 9, it is obvious that the specific capacitance decreased with increasing scan rate due to the diffusion limitations. These results depict that the accessible area of the nanocomposites was decreased by increasing the scan rate. At all scan rates, improvement in capacitive performance with a 2-3 times increase in Csp was observed. A decrease in Csp of GMM to less than that of GM is due to the dissolution of MnO2 and mechanical failure[40].
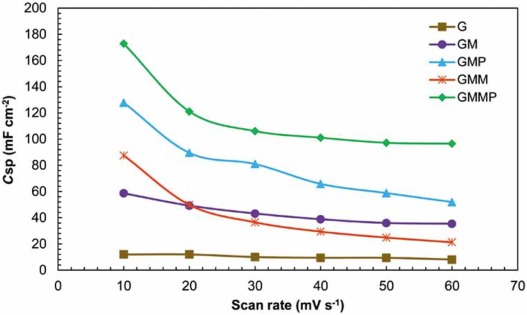 | Fig. 9. Specific capacitance of the nanocomposites at different scan rates in 0.5 mol/L Na2SO4. |
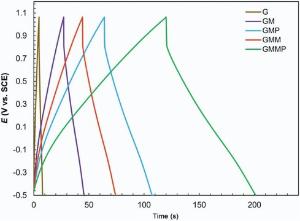
Fig. 10 shows the charge-discharge curves of G, GM, GMP, GMM, GMMP nanocomposites measured at a constant current of 4 mA cm-2 within the potential window of -0.5 to 1.1 V vs. SCE reference electrode.
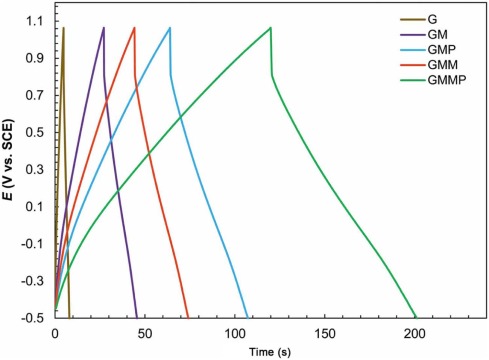 | Fig. 10. Charge-discharge behaviors of G, GM, GMM, GMP and GMMP at 4 mA cm-2 in 0.5 mol/L Na2SO4solution. |
It is clear that all the curves have a small ohmic drop at the beginning of the discharge state, and this clarifies that the nanocomposites have an equivalent series resistance (ESR). However, the potential drop became smaller with the addition of PANI and MnO2, benefiting from the good electrical conductivity of them. The charge-discharge curves in Fig. 10 are linear, triangular shaped, very sharp and symmetric. These indicate the reversible behavior.
The specific capacitance (mF cm-2) can be calculated according to Eq. (7)[38, 39, 45]:
where I is the applied constant current (mA), Δ V is the potential range of the charge-discharge (V), Δ t is the time of a discharge cycle (s) and A is the surface area of the electrode (cm2). The galvanostatic charge-discharge curves of GMMP represented a much longer discharge time. Hence, the specific capacitance of GMMP was higher than other electrodes according to Eq. (7), which was consistent with the results of cyclic voltammetry. The specific capacitances of G, GM, GMP, GMM, GMMP obtained from this method were calculated to be 8.95, 50.75, 120.00, 82.60 and 173.00 (mF cm-2), respectively.
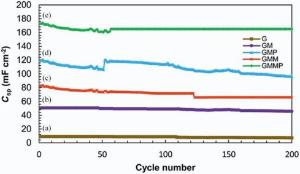
The charge-discharge cycle stability of the nanocomposites was also investigated by galvanostatic charge-discharge tests in the voltage range of -0.5 to 1.1 V vs. SCE, and the corresponding results with a current density of 4 mA cm-2 for 200 cycles are shown inFig. 11. It can be seen that there is 10% decay in the available capacitance over 200 cycles. This implies a good long-term recycling capability of 90% for GMMP nanocomposite. In general, conducting polymers often suffer from a limited long-term stability during cycling because the swelling and shrinking of the polymers may lead to degradation. However, the composition with G and MWCNT is able to improve this situation noticeably[43].
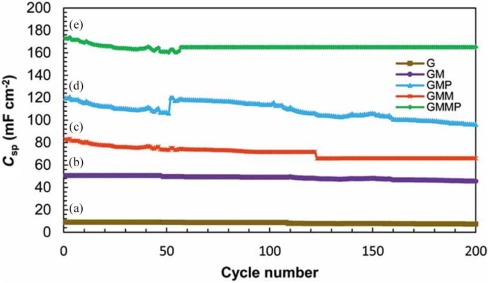 | Fig. 11. Specific capacitances of (a) G, (b) GM, (c) GMM, (d) GMP and (e) GMMP as a function of cycle number measured at 4 mA cm-2 in 0.5 mol/L Na2SO4 solution. |
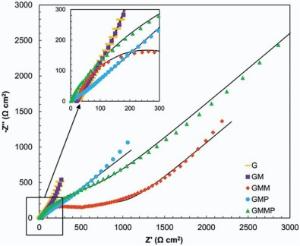
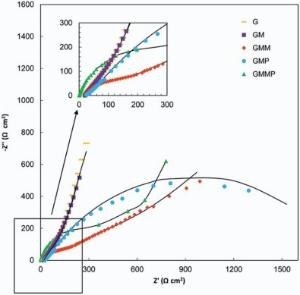
Typical Nyquist plots of the nanocomposite based electrodes in 0.5 mol/L Na2SO4 are given in Fig. 12 and Fig. 13. In the left part of the Nyquist plot, high frequency region, the intercept at real part (Z′ ) is a combinational resistance of the ionic resistance of the electrolyte, natural resistance of the substrate, and contact resistance between the active material and graphite, [38, 39] which is called equivalent series resistance (ESR)[1].
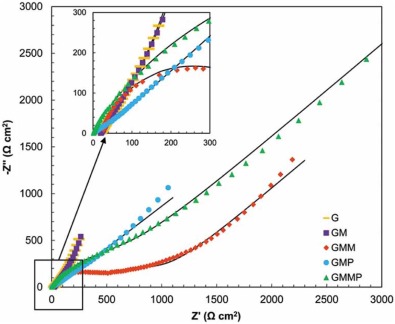 | Fig. 12. Nyquist plots of G, GM, GMM, GMP and GMMP electrodes at OCP, (-) fitted results. |
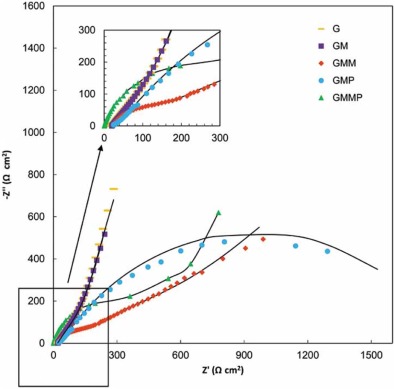 | Fig. 13. Nyquist plots of G, GM, GMM, GMP and GMMP electrodes at 0.5 V vs. OCP, (-) fitted results. |
The inclined portion in low frequency region is identified with the ion diffusion. Under open circuit potential condition (OCP), introducing of PANI and MnO2 into the G structure has diminished the ESR. The imaginary part of the impedance increases more sharply with decreasing frequency, which is indicative of a faradaic process produced by the redox transitions of PANI and MnO2[38]. By applying a DC potential of 0.5 V in Fig. 13, the impedance spectra of the G and GM are almost stable, which states that the energy storage mechanism of these electrodes are not faradic.
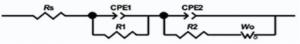
The equivalent circuit shown in Fig. 14 was found to give excellent fits for different impedance spectra of nanocomposite based electrodes. The parameters of the equivalent circuit are reported in Table 2.
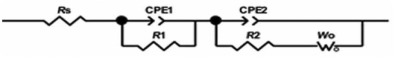 | Fig. 14. Equivalent circuit for the fitting of the EIS spectra of the electrodes. |
| Table 2. Best fitting values of the equivalent circuit elements in Fig. 14 for the impedance data shown in Fig. 12 and Fig. 13 |
The faradic (pseudo-capacitance) part of the equivalent circuit is based on the following equations[37, 38, 39]:
Z=Rs+ZF+Zdl(8)
For the double layer part of the equivalent circuit, the equations are as follows:
In these equations, ω , Rs, RF, Zdl, ZF, ZW, Rct, Cdl and CF are the angular frequency, solution resistance, faradic resistance, charge transfer impedance, bulk faradic impedance, Warburg diffusion impedance, ionic charge transfer resistance at the electrode/electrolyte interface, double layer capacitance and bulk faradic pseudo-capacitance, respectively.
When ω → ∞ , Z=Rs i.e. Cdl and CF combine as a pure capacitance.
Rs (Cdl, CF)≪RF and Rct(16)
At sufficiently low frequencies (ω → 0), Eq. (12) becomes RF and Eq. (15) becomesRct+ZW. So the impedance is as follows:
Z=Rs+RF+Rct+ZW(17)
This gives a rising sloping plot of Z″ in the complex plane with decreasing ω , with the Zvalue of RF+Rct+ZW.
The Faradic resistance, RF, in the circuit corresponds to the reciprocal of the potential-dependent rate (Tafel behavior) of the process[41], which may enable oxidation of emeraldine base form of the PANI and intercalation of Na+ ions to become absorbed on the MnO2 surface. This allows a continuous Faradic current to pass that is potential dependent according to a Tafel relation. It can be stated that as ω → 0, the circuit does not allow continuous passage of the direct current because of the blocking by Cdl and CF.
In this circuit, there are two capacitors that were replaced by two CPEs. CPE is a non-ideal capacitor, which its impedance is as follows[37, 38, 39]:
In which, Y0 and α are parameters associated with a constant-phase element (CPE). When α =1, Y0 has units of a capacitance (F cm-2), and represents the capacity of the interface. When a ≠ 1, the system shows behavior that has been attributed to surface heterogeneity. These two parameters are independent of frequency.
CPE1 indicates pseudo-capacitor due to the redox transitions of PANI (emeraldine and lucoemeraldin states) and intercalation of Na+ ions on the MnO2 surface. It is in parallel with (Rct1) corresponding to the kinetically controlled electron-transfer reaction.
CPE2 illustrates the double layer capacitance and originates from the charging-discharging process at the electrolyte/electrode interface. It is in parallel with the resistor (Rct2) of transferring ions at the electrode/electrolyte interface, which is series with the Warburg diffusion element (W).
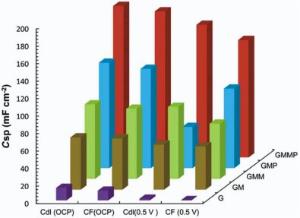
The true capacitance from a depressed semicircle model (i.e. a constant phase element in parallel with a resistor) can be calculated by the following equation[37, 38, 39]:
Fig. 15 illustrates the specific capacitance of the nanocomposite based electrodes on the Eq. (20). It can be observed that for all of the nanocomposites, the value of Cdl is greater than CF, which is in good agreement with the low thickness of the double layer. The values of ESR obtained from the X-intercept of the Nyquist plot were found to be 19.53 Ω , 19.45 Ω , 2.546 Ω , 15.2 Ω and 1.251 Ω for G, GM, GMP, GMM and GMMP, respectively.
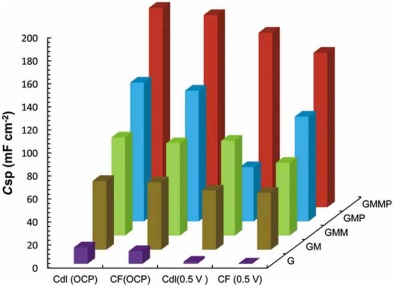 | Fig. 15. Specific capacitance of the nanocomposite based electrodes on the Eq. (20). |
Table 3 shows the comparison of the specific capacitance obtained in this work with other works. It can be seen that the values of the specific capacitance are comparable with other works.
| Table 3. Graphene and other carbon-based material composites for supercapacitors |
In summary, the GM nanocomposite was treated with KMnO4 in a water-ethylene glycol. The in situ polymerization of aniline on GMM provided a sufficient area for effective diffusion of Na+ ions. This nanocomposite has much higher specific capacitance and cycling stability and also exhibited the capacitance of 173.00 mF cm-2 at 10 mV s-1 by CV measurement, 173.00 mF cm-2 by charge-discharge and 166.70 mF cm-2 by electrochemical impedance spectroscopy, respectively. The results deduced from the three techniques are in good agreement with each other, and this confirms the reliability of the obtained results. The sequence of electrodes with respect to the increasing of specific capacitance is GMMP > GMP > GMM > GM > G. The cycling stability of the GMMP nanocomposite was 90% initial capacitance after 200 cycles. The improved electrochemical properties might be ascribed to the presence of the pseudo-capacitive components (-COOH, -OH, PANI and MnO2) in the nanocomposite. On the other hand, the increased hydrophilicity improved the electrode/electrolyte contact and utilization of PANI and MnO2 have improved the conductivity of the nanocomposite. Therefore, the synthesized material in the present work is the promising candidate for electrochemical capacitor.
The authors acknowledge the financial support of Iranian National Committee of Nanotechnology in Ministry of Science, Research and Technology and the office of Vice Chancellor in Charge of Research of University of Tabriz.
The authors have declared that no competing interests exist.
| [1] |
|
| [2] |
|
| [3] |
|
| [4] |
|
| [5] |
|
| [6] |
|
| [7] |
|
| [8] |
|
| [9] |
|
| [10] |
|
| [11] |
|
| [12] |
|
| [13] |
|
| [14] |
|
| [15] |
|
| [16] |
|
| [17] |
|
| [18] |
|
| [19] |
|
| [20] |
|
| [21] |
|
| [22] |
|
| [23] |
|
| [24] |
|
| [25] |
|
| [26] |
|
| [27] |
|
| [28] |
|
| [29] |
|
| [30] |
|
| [31] |
|
| [32] |
|
| [33] |
|
| [34] |
|
| [35] |
|
| [36] |
|
| [37] |
|
| [38] |
|
| [39] |
|
| [40] |
|
| [41] |
|
| [42] |
|
| [43] |
|
| [44] |
|
| [45] |
|
| [46] |
|