
Microstructure and Fracture Behavior of 316L Austenitic Stainless Steel Produced by Selective Laser Melting
[R. Casati*  , J. Lemke, M. Vedani]
, J. Lemke, M. Vedani]
|
|


Selective laser melting is an additive manufacturing method based on local melting of a metal powder bed by a high power laser beam. Fast laser scans are responsible for severe thermal gradients and high cooling rates which produce complex hydrodynamic fluid flow. These phenomena affect crystal growth and orientation and are believed to be the cause of material spattering and microstructural defects, e.g. pores and incompletely melted particles. In this work, the microstructure and texture of 316L bars built along two different orientations and the effect of different distribution of defects on their mechanical response and failure mechanisms were investigated. Partially molten powder particles are believed to be responsible for the scattering in elongation to failure, reduced strength, and premature failure of vertical samples.
Additive manufacturing (AM) technologies combine layer-by-layer material deposition and triggered energy source to build net-shape complex objects. AM processes were initially proposed for producing prototypes but in a few decades, their use changed and nowadays they are also employed for fabrication of functional and structural parts for service in industrial and medical applications. There are several processing methods belonging to the family of AM technologies. One of these processes is the selective laser melting (SLM), which is based on local melting of a metal powder bed by a high power laser beam[1, 2, 3, 4]. Gas-atomized pre-alloyed powders with round shape, smooth surface, and size distribution that usually spans from 5 to 50 µ m are commonly used because of their high packing efficiency and their flowability, the ability to be easily and homogeneously distributed in a flat and thin layer. AISI 316L and PH 17-4 stainless steels, Maraging steel Grade 300, Inconel 625 and 718, Al10SiMg, CoCr and Ti6Al4V alloys are among the most used and studied materials for SLM[5, 6, 7, 8]. In particular, the austenitic AISI 316L stainless steel is extensively employed thanks to its combination of good mechanical properties and excellent corrosion resistance[9]. A carbon content lower than 0.03 wt% confers good weldability to the material and makes the AISI 316L an optimal grade for SLM. Several processing parameters, including layer thickness, scanning strategy, hatch distance, spot size, focus, and power of the laser, must be optimized in SLM. They result in complicated thermal histories by affecting the incident energy and the shape and size of the melt pools[10, 11]. Mechanical properties depend on microstructure of materials which in turn largely depends on the thermal history experienced during processing. The high local energy and the fast scans are responsible for large thermal gradients and high cooling rates, which produce complex and strong hydrodynamic fluid flows. These phenomena affect crystal growth and orientation and are believed to be the cause of material spattering (sparkling) and microstructural defects, e.g. pores and incompletely melted particles[12]. Defects, pores, and microstructural heterogeneities are intrinsic to the process and can play an important role in the mechanical and functional behavior of AM components. They can constitute an obstacle for producing reliable structural components, especially for all those parts subjected to cyclic loads.
This paper is aimed at better understanding the effect of the microstructure and microstructural defects on the tensile behavior of AISI 316L parts produced by SLM. In particular, specimens built along two different orientations were used to investigate the effect of different distribution of defects on the mechanical response of the material and on the failure mechanisms.
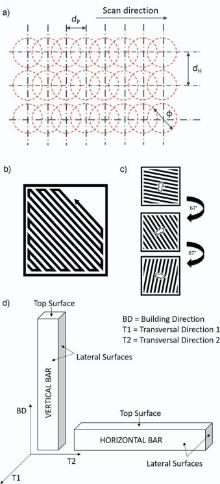
The gas-atomized powder of experimental AISI 316L stainless steel was supplied by Renishaw plc. A Renishaw AM250 SLM system was used to produce a set of horizontal and vertical squared bars (10 mm × 10 mm × 75 mm) under Ar atmosphere. The Renishaw AM250 uses a single mode fiber laser with 200 W maximum power and estimated beam diameter at focal point of 75 µ m. Laser melting is performed by discrete and partially overlapped laser spots. Spots are exposed to the radiation for a fixed time (t) and their distance is called point distance (dP). At the end of the scan line, the laser jumps to a partially overlapped adjacent line. The operation is repeated until the layer is complete. The distance between adjacent scan lines is defined as hatch distance (dH), dH, dP, and t were set to 110 µ m, 60 µ m, and 80 µ s, as recommended by the system manufacturer. A schematic of the melting process is depicted in Fig. 1(a). Samples were produced using a meander scanning strategy, as shown in Fig. 1(b). The scanning direction is rotated by 67° after each layer (Fig. 1(c)), therefore, the same pattern is repeated every 180 layers. A schematic of a horizontal and a vertical sample and of the main directions is shown inFig. 1(d). The layer thickness was set to 50 µ m. After steel plate removal, the built parts were machined and cylindrical dog-bone specimens having a gauge length of 20 mm and diameter of 4 mm were produced. Geometry of specimens was in accordance to the ASTM E8/E8M-13a standard[13], at least three specimens for each condition were tested. The same bars were also used to extract samples for metallographic analysis. Microstructural analysis was carried out by scanning electron microscope (SEM) equipped with energy dispersive X-ray analysis (EDX) and electron back-scattered diffraction (EBSD) detectors and by optical microscope after etching with HNO3:HCl:H2O (1:1:1) solution. Tensile tests were performed at room temperature with a crosshead speed of 0.5 mm/min using an MTS Alliance RT/100 universal testing machine equipped with extensometer.
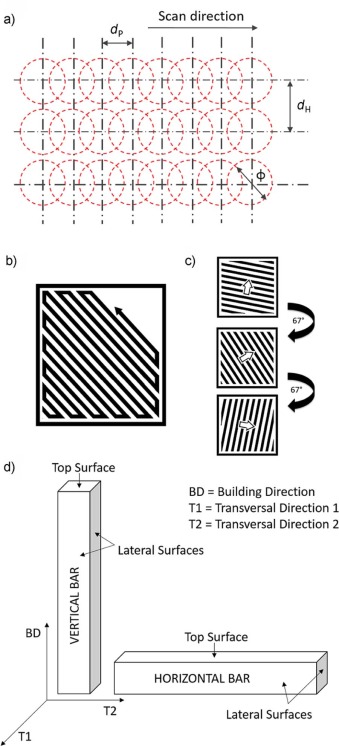 | Fig. 1. (a) Schematic of the spot-to-spot melting process: φ is the estimated beam diameter at focal point, dP is the point distance, and dH is hatch distance; (b) schematic of the meander scan strategy; (c) schematic of the scan strategy along the building direction (scan direction rotates by 67° after each layer); (d) schematic of the bars and notation. |
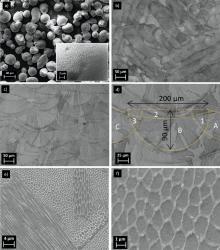
Fig. 2(a) shows SEM image of the AISI 316L powder. The gas-atomized powder consists of quasi-spherical discrete particles with smooth surface. Their average size turned out to be of 31 µ m. Dendritic solidification structure is noticeable from the powder surface, as depicted by the inset in Fig. 2(a). The as-build samples showed clear solidification tracks on the macro-scale and evidence of the solidification cell structure on the micro-scale. InFig. 2(b) and (c), characteristic optical micrographs of top and lateral sections of the samples are shown. It is worth noting that the laser scanning direction rotates by 67° after each layer, leading to differently oriented melt pools, as depicted in the micrographs ofFig. 2(b) and (c). The scanning laser beam generated periodic melt pools in each layer which appear similar to many aligned welding beads. Their boundaries become well noticeable after etching. Melt pools with depth and the width of about 90 and 200 µ m, respectively, were generated. Their size depends on several parameters, including the exposure time, the input power, the beam size at the focal point, and the spot distance. Laser tracks experienced partial remelting, as shown in Fig. 2(d): the region “ 1” is part of the melt pool “ A” , which was remelted by “ B” , as well as the region “ 3” is analogously part of the melt pool “ B” , which was remelted by “ C” . The region “ 2” is instead a portion of the melt pool “ B” , which was remelted by following laser scans of the adjacent top layer. Fig. 2(c) shows grains characterized by the same contrast that are radially oriented within the melt pools. Many grains include melt pool boundaries, suggesting epitaxial growth of new grains from remelted zones, following maximum temperature gradient directions. At higher magnification (Fig. 2(e) and (f)), a fine cellular substructure is revealed. Elongated intragranular cells are about 1 µ m in diameter and a few tens of microns in length. Similar but coarser microstructures are often produced in laser welded beads and are favored in all those solidification processes characterized by rapid cooling rates and large degree of undercooling. Indeed, cooling rates in the order of 103-108 K s-1 were proven to occur in SLM processes[14]. During SLM, materials experience fast local melting and solidification far from equilibrium conditions which is driven by severe temperature gradients. The temperature gradients in SLM are remarkably high (in the order of 106 Km-1), as demonstrated by recent studies[15].
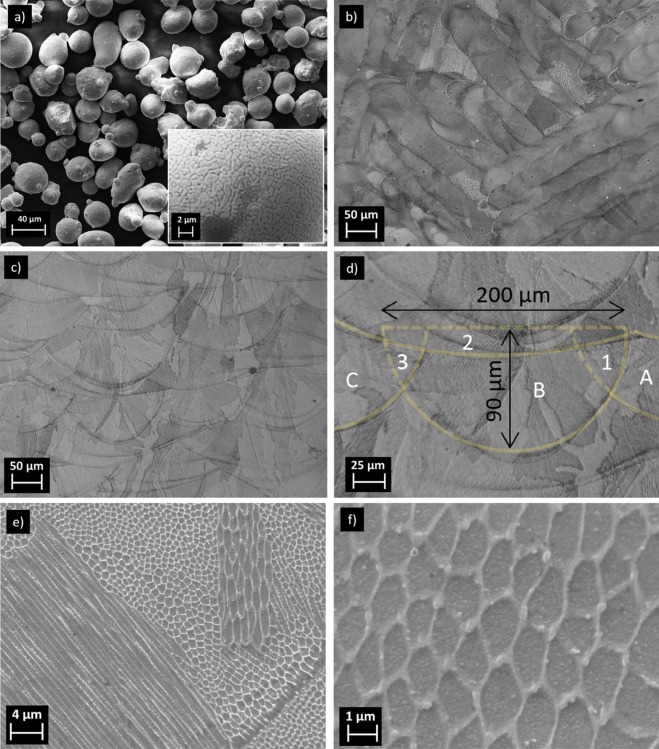 | Fig. 2. (a) Morphology of AISI 316L atomized powder, in the inset a SEM micrograph of the particle surface; (b) characteristic optical micrographs of the top section and (c) of the lateral section of built parts, (d) close up view of the lateral section, (e) and (f) SEM micrographs of built parts at higher magnifications. |
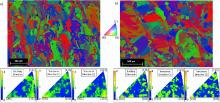
Colonies of cells with similar aspect ratio and same crystallographic orientation belong to the same grain, as it is confirmed by EBSD analysis reported in Fig. 3. Fig. 3(a) represents a characteristic orientation map of a lateral section of the samples. No melting pools are now noticeable because grains cross pool boundaries. This confirms that solidification and formation of new grains occurs by epitaxial growth. During melting of adjacent beads, within a layer or in successive layers, material experiences partial remelting, which allows new solid material to form by keeping the same crystallografic orientation of the nearby grains and to grow toward the center of the melt pool according to maximum thermal gradient direction. It was reported in previous studies that SLM is able to produce texture and preferred crystallographic orientation of grains along the building direction. The scanning direction has a significant influence in texture of AM parts, but not always in the same manner[16, 17]. Inverse pole figures (Fig. 3(b)) show that no preferential orientation of grains was induced in SLM samples processed according to meander strategy. The laser strategy adopted for this build, which induces a rotation of scanning direction by 67° after each layer, is therefore believed to be able not only to avoid the formation of intense texture in the horizontal directions but also in the building direction, resulting in an almost isotropic polycrystalline material. The rotation of the scanning direction is responsible for the modification of the directions of the thermal gradients at each layer, and avoids the formation of texture.
 | Fig. 3. Orientation maps of (a) lateral and (b) top surface of a sample with respect to the building direction and corresponding inverse pole figures. |
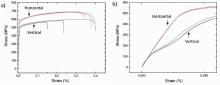
Tensile tests were performed on specimens machined along vertical and horizontal built directions. Stress-strain curves and a summary of the material mechanical properties are presented in Fig. 4(a) and Table 1, respectively. The results show that dog-bone specimens prepared from horizontal bars exhibit higher strength and ductility than specimens prepared from vertical bars. A close-up view of the tensile curves also shows that the samples built in horizontal and vertical directions have a different behavior right from the very initial stage of elastic deformation (Fig. 4(b)). The horizontal samples exhibit linear elastic behavior up to the macroscopic yield point (about 180 GPa), whereas the vertical specimens show a constant Young modulus only for very low stress levels (about 120 MPa), thereafter slope changes and small stress drops become noticeable.
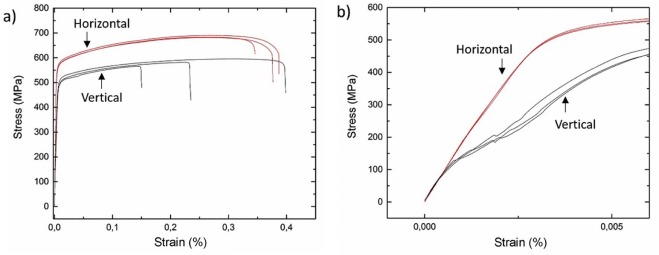 | Fig. 4. (a) Stress-strain curves of samples built in horizontal and vertical direction and (b) close-up view of curves close to onset of yielding. |
| Table 1. Average values (standard deviation in brackets) of 0.2% yield strength (YS), ultimate tensile strength |
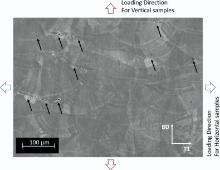
As previously discussed, the samples do not show a marked preferred orientation of grains, therefore the different mechanical behavior have to be accounted to different microstructural features. Layer-by-layer manufacturing can have an effect on the mechanical behavior of parts built along different orientations. It is recognized that micro-segregation, oxidation, inclusions, melting defects, or pores become more frequent at the interface among layer boundaries normal to build direction[18] and deteriorate the mechanical performance acting as stress raisers. In vertical samples, boundary surfaces between adjacent layers are orthogonal to the loading direction, whereas in horizontal samples, these surfaces are placed along the loading direction. Therefore, the position of layer boundaries with respect to the loading could be the cause of earlier yielding and lower strength and elongation to failure of vertical samples. In the micrograph of Fig. 5, black arrows evidently indicate debonded layers and pores located at layer boundaries. For sake of clearness, in the same figure, the loading direction for vertical and horizontal samples is also shown.
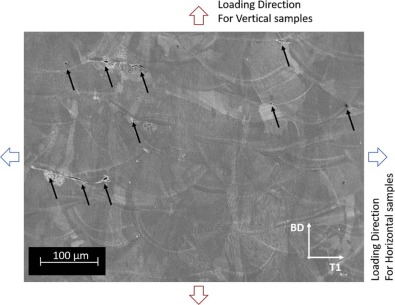 | Fig. 5. SEM micrograph of the lateral section, microstructural defects located at track boundaries are indicated by black arrows (BD = Building direction, T1 = Transversal direction 1). |
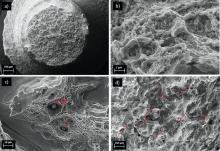
Fracture surfaces were observed by SEM and the representative images are reported inFig. 6. Vertical specimens show typical fracture features of ductile materials, with small dimples (less the 1 µ m in diameter) visible throughout the surface (Fig. 6(b)). The dimple size is smaller than that obtained in previous studies on austenitic steels processed by more conventional techniques[19, 20]. A reason may be found in the refined cellular structure which affects the nucleation and growth of micro-voids. However, a few larger dimples in the order of 5 - 10 µ m in diameter were also detected. These larger defects nucleated starting from Cr-Mn-Fe inclusions, likely oxides, as indicated by the arrows inFig. 6(c). Results of EDX analysis are reported in Table 2. Several partially molten steel particles were found on the fracture surface, as indicated by arrows in Fig. 6(d). The surface around these particles did not show any dimples. These partially molten areas, which are formed at the interface between two layers, are believed to represent a fundamental cause of the scattering in elongation to failure and premature fractures detected in tensile samples. They are believed also to play a significant role in reducing strength owing to reduction in effective cross-sectional area in vertical samples. Indeed, small crack propagation and premature debonding of partially molten particles might start already at low stress levels, leading to drop in stress-strain curves and early deviation from linear elastic response at low stress level, especially in the vertical samples.
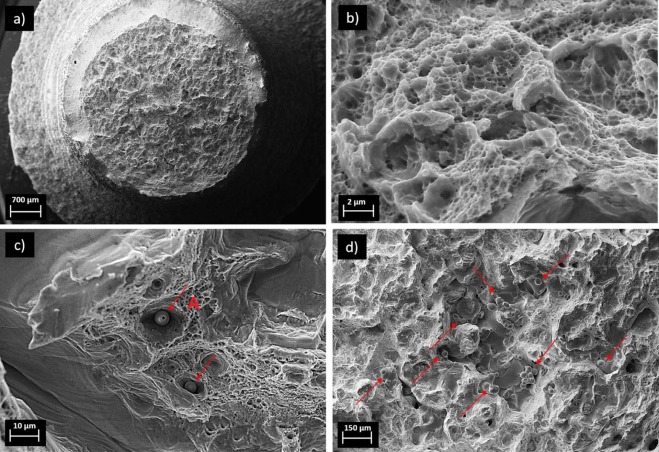 | Fig. 6. (a) Low and (b) high magnification views of the fracture surface of a vertical built sample; (c) oxide inclusions and (d) partially molten steel particles. |
| Table 2. EDX analysis results (wt%) of particle marked as A in Fig. 6</p> |
Horizontal specimens showed remarkably different fracture surfaces (Fig. 7). Very large holes, whose size reached 200 µ m, are spaced out by regions covered by fine dimples with average size lower than 1 µ m. Inside the larger holes, partially unmolten steel particles were found, as indicated by arrows in Fig. 7(c), (d), and (e). For these horizontal specimens, it is to remind that layer boundaries, in which defects, unmolten particles, and pores are concentrated, are aligned along the loading direction. It was speculated that cracks are more prone to propagate across layer boundaries, therefore, horizontal specimens appear as more damage tolerant when subjected to tensile loads.
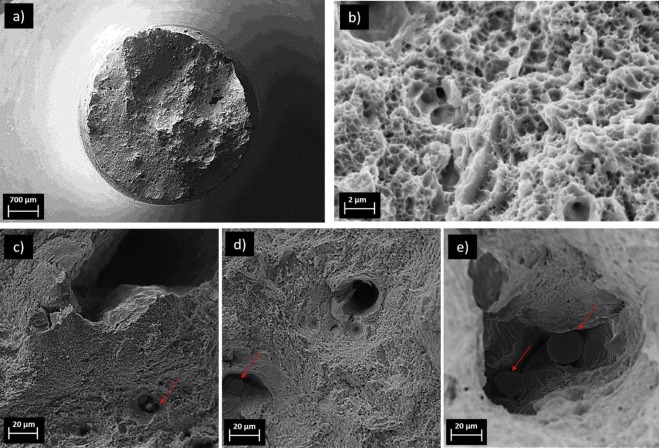 | Fig. 7. (a) Low and (b) high magnification views of the fracture surface of a horizontal built sample, (c), (d) and (e) partially molten steel particles. |
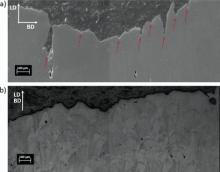
Longitudinal sections of fractured specimens confirmed the proposed crack-propagation mechanisms along layer boundaries. In horizontal samples, evidence of layer delamination was observed along specimen axis, as depicted by arrows in Fig. 8(a). In vertical samples, on the contrary, this kind of features was not visible since weak layer boundaries are displaced normal to specimen axis (Fig. 8(b)).
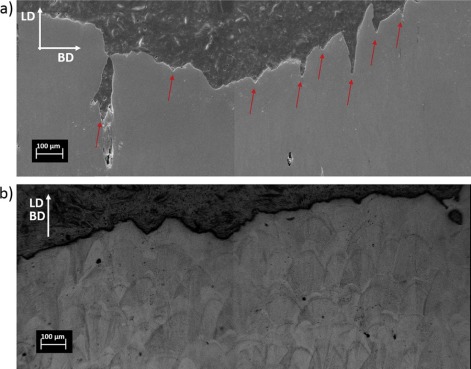 | Fig. 8. Longitudinal sections of broken tensile specimens observed near fracture surfaces: (a) horizontal sample, (b) vertical sample. Tensile direction is vertical (BD = Building direction, LD = Loading direction). |
From present investigation, it is suggested that microstructural defects, which are inherent to AM processes, must be controlled and reduced in order to fully exploit SLM parts as structural components. The reduction of microstructural heterogeneities is not trivial. SLM is usually a long process, where larger builds (higher number of layers and very long processing times) have higher probability of defect formation, primarily because of possible degradation of system components and cleanliness. For instance, rubber wiper may wear out leading to inhomogeneous layer thickness or optical windows may blacken because of process fumes, leading to optical aberration of laser beam. Moreover, high power laser melting induces complex fluid flow in the melt pools, which leads to the formation of pores, trapped particles, defects, and sparkling[12]. Lots of process parameters must be tailored according to the sample geometry in order to obtain a stable pool and to simultaneously limit non-melted spots. The position of defects in the volume was also demonstrated to have a significant effect in strength and elongation to fraction of parts. Therefore, structural components have to be preferably built also considering the directions of principal loads, in order to guarantee more consistent and predictable fracture behavior.
(1)The selected meander scanning strategy of the laser beam generated multiple periodic melt pools which experienced a partial remelting and different orientations.
(2)Grains made up of cellular substructures include melt pool boundaries, suggesting epitaxial growth from remelted zones along temperature gradients.
(3)The adopted laser strategy was able to avoid the formation of textures.
(4)Dog-bone specimens prepared from horizontal built bars exhibit higher strength and ductility than specimens prepared from vertical built bars. The position of layer boundaries with respect to the loading direction is considered the main cause of lower mechanical response of vertical samples, because high concentration of defects, e.g. pores and unmolten areas. Partially molten steel particles were exposed on the fracture surfaces of specimens and are believed to be responsible for the scattering in elongation to failure and premature failure of vertical samples. They are believed also to be responsible for the reduced strength because of reduction in effective cross-sectional area.
The authors have declared that no competing interests exist.
| [1] |
|
| [2] |
|
| [3] |
|
| [4] |
|
| [5] |
|
| [6] |
|
| [7] |
|
| [8] |
|
| [9] |
|
| [10] |
|
| [11] |
|
| [12] |
|
| [13] |
|
| [14] |
|
| [15] |
|
| [16] |
|
| [17] |
|
| [18] |
|
| [19] |
|
| [20] |
|