1. IntroductionInjection molding process is the most commonly used processing technology of plastic products. The injection molding technique is widely used for process of even complex thermoplastic polymeric articles in high scale and short time[1]. Sufficient knowledge about mold design, polymeric materials, especially rheology of polymers as well as many other parameters is requirements for producing a cost-effective product by this technique. However, many injection plastic product manufacturers would rather undergo trial and error at the beginning of manufacturing a new product. Suitable mold design is required for a new product and it plays a significant role in achieving a high quality product with stylish appearance and good mechanical properties[2]. These trials and errors are utilized to optimize processing conditions with lower warpage, shrinkage, residual stress, unbalances, air traps, weld lines, etc.; however, these trials and errors usually increase the final cost and are time-consuming. This will lead to a loss of competitiveness in the long-run basis.
Fortunately, the injection molding problems can be predicted and resolved before manufacturing start-up and during the mold design stage with the aids of injection molding simulation (IMS) softwares such as Autodesk Moldflow® , Moldex3D® and C-MOLD™ [3, 4, 5]. IMS plays an important role in determining the appropriate mold designs. Besides that, IMS also helps to determine the optimum processing parameters[1]. The simulations using softwares like Autodesk Moldflow® are along with some simplifications such as (1) assuming polymer melt flows through parallel plates with no edges, (2) neither heat loss or resistance to flow and (3) assuming flow of polymer melt through runners with symmetrical conditions across runners[1]. These assumptions do not change the results, and thus, users are able to simulate flow pattern, orientation at skin, fill time, weld lines, frozen layer fraction, air traps, shrinkage, packing and cooling processes with low error[6].
Computer aided simulation prevents very difficult, complex and long calculating procedure by hand and wasting time or money by trial and error. Imihezri et al.[7] used Autodesk Moldflow® to analyze the design of automotive clutch pedals composites using polyamide 6, 6 reinforced by 30% glass fiber. They compared two kinds of ribs to find out which one has lower weight, injection pressure and mold manufacturing cost[7]. Rahman et al.[8] used Autodesk Moldflow® to figure out which of the hollow or solid designs of natural fiber composite window frames are more cost-effective. They pointed out that hollow window frame was more suitable due to the 40% lower cost compared to the solid design. Although, the major drawback was the high level of maximum injection pressure and maximum clamping force of a hollow window frame[8]. In addition, Tang et al.[9] used C-MOLD to predict the warpage of a thin plate shape to compare the simulation and experimental results as conducted by Huang and Tai[10]. It was concluded that the melt temperature was the most significant factor to avoid warpage. The packing pressure and time also moderately affected the product appearance. With the help of C-MOLDTM simulation package, Huang and Tai figured out that the packing pressure, melt temperature, mold temperature and packing time were the most significant factors and the gate location, gate dimension and filling time showed the lowest influence on the warpage based on the studied case[10]. Moreover, Ozcelik and Sonat[11] attempted to find the appropriate conditions to produce cell thin shell phone cover by polycarbonate/acrylonitrile butadiene styrene thermoplastic. They reported that the packing pressure has a significant effect on the warpage of the product[11]. Chen et al.[12] carried out a similar study to reduce the warpage of heat resistant polyamide using Moldflow and statistical technique. The results also indicated that the melt temperature and packing pressure were the most effective parameters governing the warpage of thin shell[12]. In another work, Sin et al.[1] compared processability of polyvinyl alcohol-starch compounds with different compositions using Moldflow® . It was concluded that PVOH/starch of 40/60 wt% requires lower injection pressure and generates lower volumetric shrinkage compare to PVOH/starch of 50/50 wt%. Taguchi method basically focuses on the design of experiments, coupling the quality properties and the control factors, i.e., determining the relationship between inputs and outputs. Taguchi combined the concept of fractional design and the knowledge of linear graphs to reduce the number of experiments required for obtaining optimal conditions[13].
Taguchi method coupled with analysis of variance (ANOVA) analysis is not only an efficient method in reduction of time and cost, but also is popular among statistical analysis of injection molding properties[14]. Taguchi orthogonal arrays were applied to study the contribution of process parameters and geometry[15, 16] on weld line strength and appearance of plastic parts. Chang and Faison[17] studied the optimization of shrinkage for polystyrene, high density polyethylene and acrylonitrile-butadiene-styrene articles by Taguchi method and ANOVA. The mold and melt temperatures were the most important factors affecting the shrinkage. Huang and Tai[10] minimized the warpage of a thin shell molded parts using Taguchi method. The warpage of thin plate was studied and optimized by Shuaib et al.[18] using Taguchi method, leading to find the most significant factor of warpage, i.e. cavity temperature. Taguchi method was also used in several other works to find the most affecting factors on warpage and/or shrinkage[9, 19].
Artificial neural network (ANN) is a mathematical structure for information process through many connected neurons which respond to every input with modifiable weights, thresholds and transfer functions[20]. The ANN can be used in many different fields of studies ranging from science to business and engineering[21]. Kenig et al.[22] controlled and predicted the mechanical properties, such as tensile modulus quite accurately within a reasonable time in injection molding process by neural networks. Shi et al.[23] optimized injection molding process parameters, such as mold temperature, melt temperature, injection time, packing pressure, packing time, and cooling time using integrated artificial neural network model. They used a combination of ANN and design of experiment (DOE) method to build an approximate function relationship between warpage and the process parameters replacing the expensive simulation analysis in the optimization iterations[23]. Also, several other works were carried out to optimize process parameters, predict and reduce warpage and shrinkage in injection moldings via neural network methods[24, 25, 26, 27, 28].
Nowadays, petrochemical polymers are being replaced by biodegradable polymers like polylactic acid (PLA), thermoplastic polyurethane (TPU) and thermoplastic starch (TPS) due to many advantages, such as biodegradability, biocompatibility and less environmental concern. PLA was blended with TPS[29] and TPU[30] in the previous works. Many different properties of these binary PLA-TPU and PLA-TPS blends were examined to find the optimal content of PLA in each of them; PLA-TPU (75-25 wt%) and PLA-TPS (50-50 wt%) had the optimum properties, which are called just PLA-TPU and PLA-TPS in this work.
Pure PLA, PLA-TPU and PLA-TPS (optimal ones) were selected as three different materials for injection molding process of disposable green plastic spoons. The final warpage and maximum volumetric shrinkage of the products were numerically simulated and collected in different coolant temperatures, packing times, packing pressures, mold temperatures and melt temperatures for each material assisted by Autodesk Moldflow® . To reduce the number of experiments, an L27 orthogonal array of Taguchi was selected to arrange the factors and levels. The percentage contribution of all single and binary interactions of factors was calculated using ANOVA technique. The optimal factors and levels were determined by comparing signal to noise values (S/N ratios) at Taguchi while their contributions for each material lead to have minimum warpage or shrinkage. Also, precise ANNs can be fitted for every 27 experiments group followed by the prediction of targets in full factorial levels for every factor. The best level of factors calculated by the two methods is different, so they will result in different outputs (warpage and/or shrinkage), which show the performance of each method in the prediction of optimal level selection. A balance of injection conditions for lowering shrinkage and warpage at a same time, which is very efficacious in practice, is also performed using the two methods.
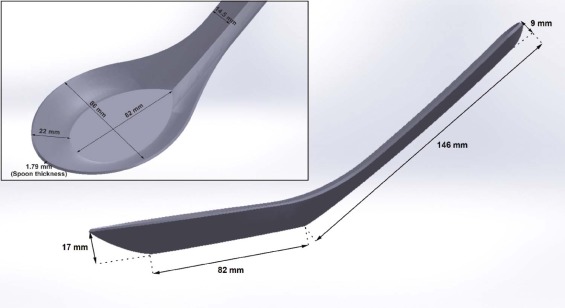
2. Theory and ProceduresA common plastic spoon shape with determined 3D geometry was drawn using SolidWorks® software and the spoon 3D layout was imported into Autodesk Moldflow® for the injection molding analysis. Polylactic acid (PLA) was synthesized from L-lactide via reactive extrusion method and obtained from the previous works[31, 32, 33]. The technical grade corn starch was used in this study. The moisture content in the starch was about 12% by weight. It was measured by drying the starch in an oven heated up to 105 ° C for 24 h. TPU (LARIPUR® LPR 9020T) was purchased from COIM, Italy. Based on the previous studies, it was proven that the PLA/TPU blend 75/25 wt%[30] and PLA/TPS 50/50 wt%[29] were the blends with optimum mechanical and processing properties. The pressure-volume-temperature (PVT) and rheological properties of these materials were measured using SWO PVT 100 apparatus (China) and Anton PaarPhysica MCR102 (Graz, Austria) with parallel-plate geometry, respectively. The measured characteristic data further were mathematically model fitted to be imported into Autodesk Moldflow® database.
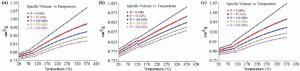
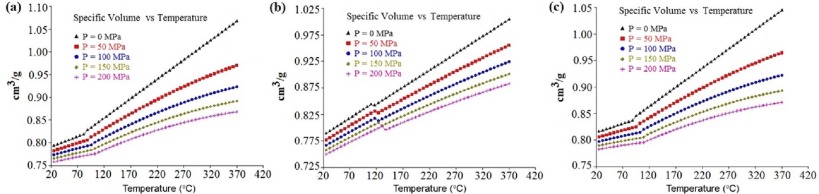
2.1. Model fitting of PVT dataThe PVT behavior of compounds is attributed to the changing of specific volume (1/density) with changes in temperature and pressure. This behavior in injection molding simulation is an integral know-how to determine the compressibility of the thermoplastic injection polymer compound. The amount of shrinkage in injection molded polymer compound can be considered as a direct function of the PVT behavior. The two-domain Tait PVT model, which consists of thirteen coefficients, is required to be data fitted, where V (m3/kg) is specific volume, T (K) temperature, Tt (K) transition temperature and P (Pa) is pressure. The b1m tob4m, b1s to b4s, and b5 to b9 are coefficients.
(1)
when T> Tt, Vt (T, P)=0 (2)
V0=b1m+b2m (T-b5), B(T)=b3mexp[-b4m (T-b5)]
when T< Tt(3)
Tt (P)=b5+b6P
Generalized reduced gradient (GRG) nonlinear method was used to fit the PVT data into the model. R2, coefficient of determination, was also determined for each of the materials. Coefficient of determination is a value between 0 and 1; the more precise data fitting leads to the more accurate model coefficients[1]. Tait PVT model data and its coefficients are shown in Fig. 1 and Table 1.
Table 1.
Table 1.
 Table 1. Coefficients of curve-fitted (a) the two domain Tait PVT model and (b) cross-WLF model of PLA, PLA-TPU and PLA-TPS | Coefficient | Unit | PLA | PLA-TPU | PLA-TPS |
|---|
| (a) Two domain Tait PVT model | b5 | K | 361.26 | 462 | 367.15 | | b6 | K/Pa | 7.5E-08 | 8E-08 | 1.05E-07 | | b1m | m3/kg | 0.000827 | 0.0008413 | 0.000844 | | b2m | m3/kg K | 8.50E-07 | 6.38E-07 | 7.25E-07 | | b3m | Pa | 1.63E+08 | 1.85E+08 | 1.85E+08 | | b4m | 1/K | 0.006196 | 0.003812 | 0.005837 | | b1s | m3/kg | 0.000821 | 0.00087 | 0.000838 | | b2s | m3/kg K | 4.47E-07 | 5.14E-07 | 3.29E-07 | | b3s | Pa | 2.14E+08 | 2.00E+08 | 2.45E+08 | | b4s | 1/K | 0.006078 | 0.003398 | 0.005153 | | b7 | m3/kg | 0 | 0 | 0 | | b8 | 1/K | 0 | 0 | 0 | | b9 | 1/Pa | 0 | 0 | 0 | | (b) Cross-WLF viscosity model | A1 | - | 36.10003 | 1398.752 | 36.65705 | | A2 | K | 1.094729 | 15375.78 | 11.57926 | | D1 | Pa s | 7.63E+16 | 4.05E+15 | 9.20E+16 | | D2 | K | 432.0627 | 145.6926 | 395.1525 | | D3 | K/Pa | 0 | 0 | 0 | | N | - | 0.01 | 0.301358 | 0.607351 | | Γ | Pa | 20402.61 | 27135.87 | 160.5206 |
| Table 1. Coefficients of curve-fitted (a) the two domain Tait PVT model and (b) cross-WLF model of PLA, PLA-TPU and PLA-TPS |
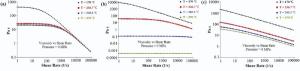
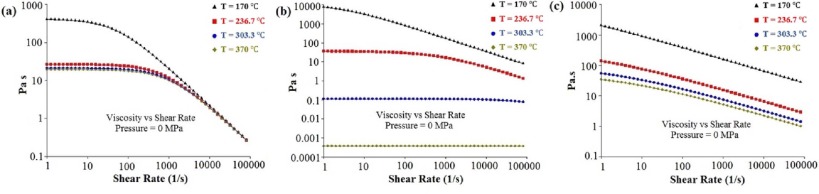
2.2. Model fitting of rheology dataViscosity‒shear rate relationship of a molten material can be used to predict the rheological behavior once being subjected to shear forces. In this section, the rheology characteristics of the molten thermoplastic materials were determined and the data were further embedded into the Cross-WLF model assisted by data fitting using GRG nonlinear regression method. Seven data fitted coefficients of PLA, PLA-TPU and PLA-TPS blends in Eqs. (4) and (5) are also reported in Table 1. Finally, the obtained coefficients of the model were transferred into Autodesk Moldflow® database for the injection molding simulations. The Cross-WLF model of the rheological data for the mentioned materials are depicted in Fig. 2.
(4)
(5)
In the above equations, η (Pa s), (1/s), T (K), P (Pa) are viscosity, shear rate, temperature and pressure, respectively [1]. Table 2 shows the coefficients of determination (R2) for three polymers, which represent the preciseness of implemented model in the data fitting. The R2 is calculated using Eq. (6)[1]. SSE and SST parameters were also calculated using Eqs. (7) and (8).
(6)
(7)
(8)
Table 2.
Table 2.
Table 2. Coefficient of determination (R2) | PLA | PLA-TPU | PLA-TPS |
|---|
| PVT model | 0.974 | 0.974 | 0.983 | | Rheology model | 0.979 | 0.975 | 0.980 |
| Table 2. Coefficient of determination (R2) |
2.3. Measurement of thermal and mechanical propertiesThe specific heat capacity of materials was evaluated in the previous works for a wide range of temperatures. Heat capacity evaluation is necessary during solidification of molten material, cooling and heat transfer along the plastic part. Furthermore, steady and balanced heat removal is of great importance for reduction of warpage, shrinkage and internal stress. Moreover, thermal conductivity of each plastic was assumed to be constant at 0.2 W/(m K)[1].
In the mechanical properties, isotropic features consisting of elastic modulus, shear modulus and alpha (coefficient of thermal expansion) were obtained at around room temperature and embedded in the software for each material.
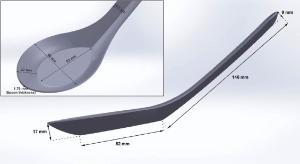
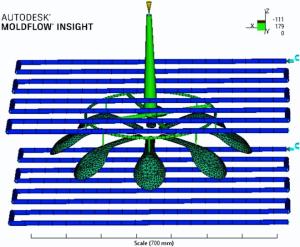
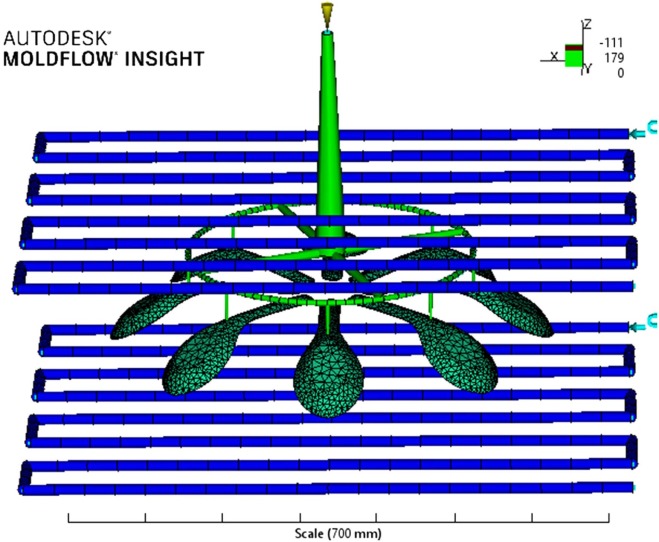
2.4. Injection molding simulationThe part model (Fig. 3) was imported into the Autodesk Moldflow® for the simulation of injection molding process. “ Dual Domain” mesh was used in this analysis that converted the model with triangular elements. The meshed part included 1962 surface triangles, and the average mesh aspect ratio was 2.3739. After the meshing step, the model transferred into a complete multi-cavity design, which included sprue, runner, gate and cooling system, as shown in Fig. 4. The injection location was selected. The best location was recommended by “ Gate Location” analysis.
As previously described earlier, the process factors, such as coolant temperature, packing time, packing pressure, mold temperature and melt temperature, were the most significant parameters, which affect warpage and shrinkage of injection-molded part, according to the literature. The simulation was performed by selecting the “ Cool + Fill + Pack + Warp” analysis of these materials to obtain warpage and maximum volumetric shrinkage at the plastic part (spoon). Allrounder 420c 110 ton 7.1 oz (45 mm) (manufactured by Argburg) was determined as the injection molding machine in process simulation. Tool Steel P-20 (manufactured by Generic) was selected as the mold material.
2.5. Taguchi array designThe Taguchi array design was applied to investigate the effect of several process parameters on shrinkage and warpage of the plastic part. The process factors and levels are represented in Table 3. Three reasonable levels were chosen for each factor. For example, melt temperature was set to 185 ° C for level 1 and 205 ° C for level 3 to assure that the melt temperature is well above the material melting points, and degradation does not occur. Meanwhile, the level values were selected in a manner where short shot (incomplete fill) does not happen in the injection process. Very low injection pressure, melt temperature and molding temperatures are the common reasons for the short shot[34, 35, 36]. Other injection parameters, such as filling time and ejection temperature are constant and their values are 1.5 s and 52 ° C, respectively. Injection pressure was switched over after 99% volume filled at the end of the filling stage. Cooling time was automatically determined according to target ejection criteria (i.e. mold temperature and ejection temperature). L27Taguchi array arranged the factors and levels to design the fractional experiments as demonstrated in Table 4.
Table 3.
Table 3.
Table 3. Process factors and their levels| Level | A: Coolant temperature | B: Packing time | C: Packing pressure | D: Mold temperature | E: Melt temperature |
|---|
| (° C) | (s) | (% Injection pressure) | (° C) | (° C) | | 1 | 8 | 8 | 75 | 25 | 185 | | 2 | 13 | 20 | 85 | 30 | 195 | | 3 | 18 | 32 | 95 | 40 | 205 |
| Table 3. Process factors and their levels |
Table 4.
Table 4.
Table 4. 27 (35) Taguchi orthogonal array| Trial No. | Control factors | Trial no. | Control factors |
|---|
| A | B | C | D | E | A | B | C | D | E |
|---|
| 1 | 1 | 1 | 1 | 1 | 1 | 15 | 2 | 2 | 3 | 1 | 3 | | 2 | 1 | 1 | 1 | 1 | 2 | 16 | 2 | 3 | 1 | 2 | 1 | | 3 | 1 | 1 | 1 | 1 | 3 | 17 | 2 | 3 | 1 | 2 | 2 | | 4 | 1 | 2 | 2 | 2 | 1 | 18 | 2 | 3 | 1 | 2 | 3 | | 5 | 1 | 2 | 2 | 2 | 2 | 19 | 3 | 1 | 3 | 2 | 1 | | 6 | 1 | 2 | 2 | 2 | 3 | 20 | 3 | 1 | 3 | 2 | 2 | | 7 | 1 | 3 | 3 | 3 | 1 | 21 | 3 | 1 | 3 | 2 | 3 | | 8 | 1 | 3 | 3 | 3 | 2 | 22 | 3 | 2 | 1 | 3 | 1 | | 9 | 1 | 3 | 3 | 3 | 3 | 23 | 3 | 2 | 1 | 3 | 2 | | 10 | 2 | 1 | 2 | 3 | 1 | 24 | 3 | 2 | 1 | 3 | 3 | | 11 | 2 | 1 | 2 | 3 | 2 | 25 | 3 | 3 | 2 | 1 | 1 | | 12 | 2 | 1 | 2 | 3 | 3 | 26 | 3 | 3 | 2 | 1 | 2 | | 13 | 2 | 2 | 3 | 1 | 1 | 27 | 3 | 3 | 2 | 1 | 3 | | 14 | 2 | 2 | 3 | 1 | 2 | - | - | - | - | - | - |
| Table 4. 27 (35) Taguchi orthogonal array |
2.6. Artificial neural network (ANN)ANNs are capable of dealing with linear and nonlinear functions, and their major application is in the area of forecasting[37]. In this study, a feed-forward back-propagation-based ANN solver, provided by IBM SPSS Modeler 14.2 was used. Multilayer perceptron includes a large group of feed-forward neural networks with different number of layers. The multilayer perceptron ANNs were created with the common learning algorithm of feed-forward back-propagation (FFBP) for each 27 experiments group (Taguchi orthogonal arrays) as the training sample. The parameters of the model, such as selection of input nodes, number of hidden layers and hidden nodes, and the form of transfer functions are dependent on the problem and often are specified using trial and error. Ghiasi and Nangoy studies show that the ideal number of hidden layers in FFBP algorithm is often 1 or 2, although there are fewer guidelines on the optimal number of hidden nodes[38]. To find the optimal network that allows most accurate ANNs for fitting target, different numbers of hidden layers (1 and 2) and nodes (9-15) in every hidden layer were tested, and then, the bests were selected. The inputs were control factors from A to E in the levels of 1, 2 or 3 and the target was the shrinkage percentage, warpage or average of normalized shrinkage and warpage.
To establish the more accurate ANN for each material and each target (warpage, shrinkage or average of normalized shrinkage and warpage), the 56 architectures (with 1 or 2 hidden layers each containing 9 to 15 nodes) were established. Training accuracy (R2) of ANNs was obtained according to the comparison of outputs of ANN and Autodesk Moldflow for each of the 27 experiments. The stopping rules include a limit of desired accuracy, number of maximum training cycles that the model would run, and the maximum training time which the model is allowed to run. In this project, both stopping rules of maximum training time of 15 min and minimum accuracy of 99.9 were selected to ensure that the resulting model meets high accuracy. Overall, between each 56 architectures for each material and target, only 1 with higher training R2 is selected. Afterwards, for the highest training accuracy models, forecasting sets (out of 27 training sets) were also tested. The generally accepted guideline of 80% for training (27 training set) and 20% for forecasting (7 forecasting set) of experiments were used[38]. The training R2 based on mean squared error was calculated by the software but the forecasting R2 was calculated using Eq. (6). Table 5 shows the performance of the optimum ANNs.
Table 5.
Table 5.
Table 5. Characteristics and performances of the six optimum ANNs| Samples | Warpage | Shrinkage | Average of normalized shrinkage and warpage |
|---|
| R12 | R22 | N1 | N2 | R12 | R22 | N1 | N2 | R12 | R22 | N1 | N2 |
|---|
| PLA | 0.9991 | 0.9673 | 9 | 9 | 0.9993 | 0.9834 | 10 | 12 | 0.9990 | 0.9851 | 8 | 12 | | PLA-TPU | 0.9990 | 0.9782 | 15 | 15 | 0.9995 | 0.9648 | 9 | 9 | 0.9992 | 0.9765 | 15 | 15 | | PLA-TPS | 0.9991 | 0.9741 | 15 | 15 | 0.9995 | 0.9782 | 15 | 15 | 0.9991 | 0.9573 | 14 | 15 |
N1 = Number of neurons in the first hidden layer. N2 = Number of neurons in the second hidden layer. R12 = Training R2. R22 = Forecasting R2. | Table 5. Characteristics and performances of the six optimum ANNs |
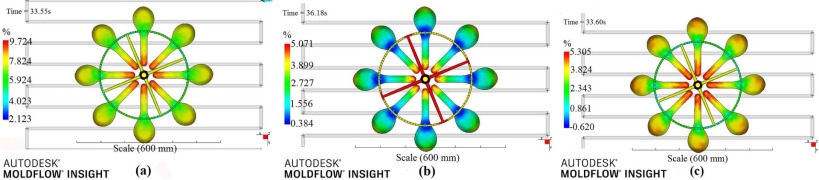
3. Results and Discussion3.1. Effect of polymer type on shrinkage and warpageShrinkage and warpage behaviors may be affected by many parameters, such as material combination and processing factors. It is commonly accepted that semi-crystalline polymers have less resistance to warpage and shrinkage compared to amorphous ones because of the closer packing of the crystalline structure[13, 17]. Higher volumetric shrinkage indicates that the material of the plastic part has a greater transition of specific volume. In other words, extensive crystallization happens in the course of solidification of molten material during cooling process[1]. It means that the volumetric shrinkage is influenced from the compressibility properties of the polymer material through the PVT properties. However, warpage depends on the phenomenon of the polymer shrinkage. Actually, warpage happens when non-uniform shrinkage occurs in the plastic part. Generally, a low degree of crystallinity results in the reduction of shrinkage and thereby reducing warpage in semi-crystalline polymers[39]. In this study, PLA and PLA-TPU have the highest and the lowest degree of crystallinity among the used polymers, respectively. PLA crystallization for PLLA is normally between 37% and 42%[40, 41], however, in this work, crystallization is 42% reported in Ref.[31]. By melt mixing of TPU and PLA due to the existence of another polymer and its low crystallization rate[42], the crystallinity is highly declined[43]. The same phenomenon happens for the PLA-TPS and the crystallinity is decreased; however, this increase is lower than PLA-TPU blends since the starch can act as a nucleating agent in the PLA matrix[29]. Fig. 5 indicates the volumetric shrinkage behaviors of PLA, PLA-TPU and PLA-TPS in the same process conditions (typically trial 8 from Table 4). Regions in red have the highest volumetric shrinkage defects. As can be seen in Fig. 5, the maximum volumetric shrinkage in plastic spoon part for PLA, PLA-TPU and PLA-TPS are 9.724%, 5.071% and 5.305%, respectively. Fig. 6 shows the deflection (warpage) effect in three components (x, y, and z) for PLA, PLA-TPU and PLA-TPS in the same process conditions (trial 8). Sections in red have the most deflection defects in the part. Here, the most deflection also occurs in the PLA part (1.428 mm). On the contrary, the PLA-TPU part has the lowest warpage (0.5302 mm).
According to the results, the PLA spoon has exhibited the worst resistance to warpage and shrinkage defects compared to the other two spoons. This behavior can be further explicated by the highest crystallinity of the PLA, which results in the highest level of shrinkage and thereby warpage in PLA spoon. Due to the lower price of starch compared to the other polymers in this system and use of 50:50 wt% blend PLA-TPS, it can be the best alternative to produce spoon. PLA-TPU is also cost-effective but not cheaper than PLA-TPS. However, based on the Autodesk Moldflow® results, PLA-TPU has the best results.
3.2. Taguchi methodIn order to measure the output quality and characteristics (warpage and shrinkage), Taguchi has utilized the signal-to-noise (S/N) ratio according to Eqs. (9) and (10). S/N ratio measures the sensitivity of a parameter to uncontrollable factors. The terms “ signal” and “ noise” stand for desirable and undesirable quality values, respectively. The goal of Taguchi is not only optimization of control factors, but also reduction of sensitivity of engineering designs to uncontrollable factors (noises). Taguchi proposed to maximize S/N ratio due to reduction of product variance around the target value[13]. The quality characteristic in the S/N ratio analysis is smaller-the-better, because the target is to minimize warpage as well as volumetric shrinkage at the part, where MSD is the mean square deviation, y is the experiment value and n represents the number of tests in one trial [18].
S/N=-10log(MSD) (9)
(10)
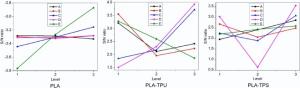
Fig. 7 and Fig. 8 represent the S/N ratios of warpage and shrinkage for different polymers, respectively. The higher the S/N ratio for each factor gave the better process conditions. As can be observed in Fig. 7, the effects of changing levels on the warpage are different for each polymer. For example, S/N ratio is increased by increasing the E factor (melt temperature) for the PLA and PLA-TPS parts. This observation indicates that the warpage is reduced. On the contrary, S/N ratio is decreased by increasing the E factor for the PLA-TPU. However, with increasing the C factor (packing pressure) S/N ratio is generally increased for all of the applied polymers, and therefore, the warpage is decreased.
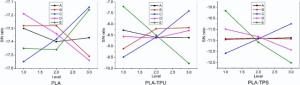
According to Fig. 8, the effects of changing levels of factors on the shrinkage are also different for three polymers. However, C factor has the same effect on shrinkage for three polymers, like warpage. These results are in agreement with the observations in previous reports[11, 25, 44, 45], which indicates that higher packing pressure causes lower shrinkage and warpage on the plastic part.
3.3. ANOVA methodThe ANOVA is used in order to investigate the most significant factors affecting the quality of the final product[13]. The ANOVA results for warpage and shrinkage are given in Table 6. The results show the best combination of factors and levels to maximize S/N ratio, which causes less sensitivity of uncontrollable factors during production. Here, the percentage contribution (C%) of variances or factors is calculated after determining quantities of degree of freedom (f), sum of squares (SS), and variance (V) according to Eqs. [11, 12, 13, 14, 15, 16, 17]. The determination of these values was illustrated for Factor A and interaction AB as a sample; calculation of all factors and their binary interactions are reported in Table 6.
Total degree of freedom, fT: fT=N-1=27-1=26 (11)
where N is the total number of results.
Degree of freedom for Factor A, fA: fA=kA-1=3-1=2 (12)
Table 6.
Table 6.
Table 6. ANOVA table for (a) warpage, (b) shrinkage, and (c) average of normalized shrinkage and warpage| (a) ANOVA warpage |
|---|
| Source | | PLA | PLA-TPU | PLA-TPS | | f | SS | V | C% | Best level | SS | V | C% | Best level | SS | V | C% | Best level | | A | 2 | 0.0004 | 0.0002 | 0.265 | 1 | 0.0398 | 0.0199 | 2.163 | 1 | 0.0433 | 0.0216 | 2.059 | 3 | | B | 2 | 0.0002 | 0.0001 | 0.131 | 3 | 0.1032 | 0.0516 | 5.615 | 1 | 0.0234 | 0.0117 | 1.114 | 1 | | C | 2 | 0.0107 | 0.0054 | 7.094 | 3 | 0.1138 | 0.0569 | 6.189 | 3 | 0.0645 | 0.0323 | 3.067 | 3 | | D | 2 | 0.0001 | 0.0001 | 0.075 | 3 | 0.1859 | 0.093 | 10.113 | 3 | 0.3814 | 0.1907 | 18.132 | 3 | | E | 2 | 0.1033 | 0.0517 | 68.441 | 3 | 0.0611 | 0.0305 | 3.321 | 1 | 0.0031 | 0.0016 | 0.148 | 3 | | AB | 4 | 0.0108 | 0.0027 | 7.169 | 1 3 | 0.2997 | 0.0749 | 16.302 | 1 3 | 0.4459 | 0.1115 | 21.197 | 1 3 | | AC | 4 | 0.0003 | 0.0001 | 0.206 | 1 3 | 0.2891 | 0.0723 | 15.727 | 1 3 | 0.4048 | 0.1012 | 19.244 | 1 3 | | AD | 4 | 0.0109 | 0.0027 | 7.225 | 1 3 | 0.217 | 0.0542 | 11.804 | 1 3 | 0.0879 | 0.022 | 4.181 | 1 3 | | AE | 4 | 0.0008 | 0.0002 | 0.554 | 3 3 | 0.0011 | 0.0003 | 0.058 | 1 1 | 0.0094 | 0.0024 | 0.447 | 3 1 | | BC | 4 | 0.0005 | 0.0001 | 0.34 | 3 3 | 0.2257 | 0.0564 | 12.275 | 3 3 | 0.4247 | 0.1062 | 20.189 | 3 3 | | BD | 4 | 0.0111 | 0.0028 | 7.359 | 3 3 | 0.1535 | 0.0384 | 8.352 | 3 3 | 0.1078 | 0.027 | 5.126 | 3 3 | | BE | 4 | 0.0002 | 0.0001 | 0.155 | 1 3 | 0.002 | 0.0005 | 0.108 | 1 1 | 0.0034 | 0.0009 | 0.162 | 1 3 | | CD | 4 | 0.0006 | 0.0001 | 0.396 | 3 3 | 0.143 | 0.0357 | 7.777 | 3 3 | 0.0667 | 0.0167 | 3.172 | 3 3 | | CE | 4 | 0.0005 | 0.0001 | 0.354 | 3 3 | 0.0009 | 0.0002 | 0.051 | 3 1 | 0.0054 | 0.0014 | 0.259 | 3 2 | | DE | 4 | 0.0003 | 0.0001 | 0.23 | 3 3 | 0.0027 | 0.0007 | 0.144 | 3 1 | 0.0317 | 0.0079 | 1.507 | 3 3 | | Total | 26 | 0.1509 | — | 100 | — | 1.8383 | — | 100 | — | 2.1038 | — | 100 | — | | (b) ANOVA shrinkage | | Source | | PLA | PLA-TPU | PLA-TPS | | f | SS | V | C% | Best level | SS | V | C% | Best level | SS | V | C% | Best level | | A | 2 | 0.0445 | 0.0222 | 0.752 | 1 | 0.0343 | 0.0172 | 0.285 | 1 | 0.0016 | 0.0008 | 0.012 | 3 | | B | 2 | 0.2489 | 0.1244 | 4.207 | 1 | 0.4682 | 0.2341 | 3.889 | 3 | 0.00001 | 0 | 0.0001 | 2 | | C | 2 | 0.5518 | 0.2759 | 9.327 | 3 | 1.7728 | 0.8863 | 14.725 | 3 | 1.3846 | 0.6923 | 10.711 | 3 | | D | 2 | 0.4055 | 0.2028 | 6.855 | 1 | 0.0408 | 0.0204 | 0.339 | 3 | 0.7276 | 0.3638 | 5.628 | 1 | | E | 2 | 0.3834 | 0.1917 | 6.48 | 3 | 2.772 | 1.386 | 23.025 | 1 | 4.4335 | 2.2168 | 34.298 | 1 | | AB | 4 | 0.9573 | 0.2393 | 16.183 | 2 2 | 1.8136 | 0.4534 | 15.064 | 1 3 | 2.1122 | 0.528 | 16.34 | 2 2 | | AC | 4 | 0.6544 | 0.1636 | 11.063 | 2 3 | 0.509 | 0.1273 | 4.228 | 1 3 | 0.7276 | 0.1819 | 5.628 | 2 3 | | AD | 4 | 0.8007 | 0.2002 | 13.535 | 2 1 | 2.241 | 0.5603 | 18.614 | 1 3 | 1.3846 | 0.3462 | 10.712 | 2 1 | | AE | 4 | 0.0756 | 0.0189 | 1.277 | 3 3 | 0.0007 | 0.0002 | 0.005 | 1 1 | 0.0002 | 0.0001 | 0.002 | 3 1 | | BC | 4 | 0.45 | 0.1125 | 7.608 | 2 3 | 0.0752 | 0.0188 | 0.624 | 3 3 | 0.7291 | 0.1823 | 5.641 | 2 3 | | BD | 4 | 0.5963 | 0.1491 | 10.08 | 2 1 | 1.8071 | 0.4518 | 15.01 | 3 3 | 1.3862 | 0.3466 | 10.724 | 2 1 | | BE | 4 | 0.2997 | 0.0749 | 5.066 | 2 3 | 0.0008 | 0.0002 | 0.007 | 2 1 | 0.0014 | 0.0004 | 0.011 | 3 1 | | CD | 4 | 0.2934 | 0.0733 | 4.96 | 3 1 | 0.50264 | 0.1256 | 4.174 | 3 3 | 0.0016 | 0.0004 | 0.0123 | 3 1 | | CE | 4 | 0.078 | 0.0195 | 1.319 | 3 3 | 0.001 | 0.0002 | 0.008 | 3 1 | 0.0345 | 0.0086 | 0.267 | 3 1 | | DE | 4 | 0.0761 | 0.019 | 1.287 | 1 3 | 0.0004 | 0.0001 | 0.003 | 3 1 | 0.0018 | 0.0005 | 0.014 | 1 1 | | Total | 26 | 5.9155 | — | 100 | — | 12.0393 | — | 100 | — | 12.9266 | — | 100 | — | | (c) ANOVA average of normalized shrinkage and warpage | | Source | | PLA | PLA-TPU | PLA-TPS | | f | SS | V | C% | Best Level | SS | V | C% | Best level | SS | V | C% | Best level | | A | 2 | 0.0002 | 0.0001 | 0.058 | 1 | 0.016 | 0.008 | 1.69205 | 1 | 0.0094 | 0.0047 | 1.657 | 3 | | B | 2 | 0.0007 | 0.00035 | 0.203 | 1 | 0.0044 | 0.0022 | 0.46531 | 1 | 0.0047 | 0.00235 | 0.82849 | 1 | | C | 2 | 0.0061 | 0.00305 | 1.766 | 3 | 0.1238 | 0.0619 | 13.09222 | 3 | 0.0462 | 0.0231 | 8.14384 | 3 | | D | 2 | 0.0013 | 0.00065 | 0.376 | 1 | 0.0596 | 0.0298 | 6.30288 | 3 | 0.0688 | 0.0344 | 12.12762 | 1 | | E | 2 | 0.0178 | 0.0089 | 5.152 | 3 | 0.1284 | 0.0642 | 13.57868 | 1 | 0.0408 | 0.0204 | 7.19196 | 1 | | AB | 4 | 0.0073 | 0.00183 | 2.113 | 3 1 | 0.1834 | 0.0459 | 19.39509 | 1 3 | 0.115 | 0.02875 | 20.27146 | 2 2 | | AC | 4 | 0.002 | 0.0005 | 0.579 | 3 3 | 0.064 | 0.016 | 6.76819 | 1 3 | 0.0734 | 0.01835 | 12.93848 | 2 3 | | AD | 4 | 0.0068 | 0.0017 | 1.968 | 3 2 | 0.1282 | 0.0321 | 13.55753 | 1 3 | 0.0509 | 0.01273 | 8.97233 | 2 1 | | AE | 4 | 0.0004 | 0.0001 | 0.116 | 3 3 | 0.0004 | 0.0001 | 0.0423 | 1 1 | 0.002 | 0.0005 | 0.35255 | 2 1 | | BC | 4 | 0.0015 | 0.00038 | 0.434 | 1 3 | 0.0756 | 0.0189 | 7.99492 | 3 3 | 0.0781 | 0.01953 | 13.76697 | 2 3 | | BD | 4 | 0.0063 | 0.00158 | 1.823 | 1 2 | 0.1398 | 0.035 | 14.78426 | 3 3 | 0.0556 | 0.0139 | 9.80081 | 2 1 | | BE | 4 | 0.001 | 0.00025 | 0.289 | 1 3 | 0.0007 | 0.00018 | 0.07403 | 3 1 | 0.0006 | 0.00015 | 0.10576 | 2 1 | | CD | 4 | 0.2934 | 0.07335 | 84.92 | 3 2 | 0.0203 | 0.00508 | 2.14679 | 3 3 | 0.014 | 0.0035 | 2.46783 | 3 1 | | CE | 4 | 0.0005 | 0.00013 | 0.145 | 3 3 | 0.0004 | 0.0001 | 0.0423 | 3 1 | 0.0013 | 0.00033 | 0.22916 | 3 1 | | DE | 4 | 0.0002 | 0.00005 | 0.058 | 2 3 | 0.0006 | 0.00015 | 0.06345 | 3 1 | 0.0065 | 0.00163 | 1.14578 | 1 1 | | Total | 26 | 0.3455 | — | 100 | — | 0.9456 | — | 100 | — | 0.5673 | — | 100 | — |
| Table 6. ANOVA table for (a) warpage, (b) shrinkage, and (c) average of normalized shrinkage and warpage |
Sum of square, SS:
(13)
(14)
(15)
where ∑ Ai stands for sum of the yj when Factor A is in the ith level.
Variance for Factor A, VA: (16)
Percentage contribution, C% for Factor A: C%= (17)
Percentage contribution (C%) shows which factors have a greater impact on warpage and shrinkage of the plastic spoon. The higher C% indicates the more importance of a factor.
As can be seen in Table 6(a) (warpage), melt temperature (E) with 68.441% of the contribution for PLA, the combination of coolant temperature and packing time (A × B) with 16.302% of the contribution for PLA-TPU and 21.197% of the contribution for PLA-TPS give the highest influence on warpage. On the other hand, from Table 6(b) (shrinkage) the combination of coolant temperature and packing time (A × B) with 16.183% of the contribution for PLA, melt temperature (E) with 23.025% of the contribution for PLA-TPU and 34.289% of the contribution for PLA-TPS are the most effective factors on shrinkage. The best level for each factor is the one that achieves maximum S/N ratio value compared to the other levels as shown in Table 6. The best level selection for binary interactions is the binary level when S/N ratio is maximum. Each factor or binary interaction has three and nine (3× 3) level states, respectively. The final optimal level selection is not as simple as selection of the best level for all factors and interactions because of the contribution of single factors and binary interactions. In order to solve this year, factors and interactions were aliened based on their percentage contribution; the highest percentage contribution of each factor in single factor and interaction has the strongest criterion in selection of optimal level of the factor[13]. Table 7 represents the optimal level selection for each factor in the warpage and shrinkage analysis of the three materials. Due to the use of automatic injection pressure, the packing pressure (C) level selection do not define a particular pressure values as materials or conditions change, and therefore their specific values are shown along their level selection in the Table 7. The optimal level selection of control factors to reach the lower warpage and shrinkage based on ANOVA lead to 1.359, 0.4647 and 0.5984 mm warpage and 6.923, 1.791 and 2.728% shrinkage for PLA, PLA-TPU and PLA-TPS, respectively. In addition, after the minimization of shrinkage and warpage simultaneously, i.e. after averaging the normalized shrinkage and warpage by using ANOVA (based on Table 7), shrinkage and warpage of PLA, PLA-TPU and PLA-TPS become “ 7.025%, 1.367 mm” , “ 1.791%, 0.4647 mm” and “ 2.728%, 0.6928 mm” , respectively. The results of simultaneously lowering shrinkage and warpage are highly desirable and their pertaining conditions are efficacious in practice.
Table 7.
Table 7.
Table 7. The level selection of factors for warpage, shrinkage and average of normalized shrinkage and warpage optimization based on ANOVA and ANN results | PLA | PLA-TPU | PLA-TPS |
|---|
| A | B | C | D | E | A | B | C | D | E | A | B | C | D | E |
|---|
| Warpage | ANOVA | C% | 7.2 | 7.4 | 7.1 | 7.4 | 68.4 | 16.3 | 16.3 | 15.7 | 11.8 | 3.3 | 21.2 | 21.2 | 20.2 | 19.2 | 1.5 | | Optimal Level | 1 | 3 | 3(7.05 MPa) | 3 | 3 | 1 | 3 | 3(58.71 MPa) | 3 | 1 | 1 | 3 | 3(30.75 MPa) | 3 | 3 | | ANN | Optimal Level | 2 | 3 | 3(6.96 MPa) | 3 | 3 | 1 | 3 | 3(58.71 MPa) | 3 | 1 | 2 | 3 | 3(32.72 MPa) | 3 | 3 | | Shrinkage | ANOVA | C% | 16.2 | 16.2 | 11.1 | 13.5 | 6.5 | 18.6 | 15.1 | 14.7 | 18.6 | 23.0 | 16.3 | 16.3 | 10.7 | 10.7 | 34.3 | | Optimal Level | 2 | 2 | 3(7.76 MPa) | 1 | 3 | 1 | 3 | 3(58.71 MPa) | 3 | 1 | 2 | 2 | 3(55.04 MPa) | 1 | 1 | | ANN | Optimal Level | 1 | 1 | 3(7.07 MPa) | 1 | 3 | 1 | 3 | 3(58.71 MPa) | 3 | 1 | 3 | 2 | 3(56.06 MPa) | 1 | 1 | | Average of normalized shrinkage and warpage | ANOVA | C% | 2.1 | 2.1 | 84.9 | 84.9 | 5.2 | 19.4 | 19.4 | 13.1 | 14.8 | 13.6 | 20.3 | 20.3 | 13.8 | 12.1 | 7.2 | | Optimal Level | 3 | 1 | 3(7.80 MPa) | 2 | 3 | 1 | 3 | 3(58.71 MPa) | 3 | 1 | 2 | 2 | 3(55.04 MPa) | 1 | 1 | | ANN | Optimal Level | 3 | 1 | 3(7.07 MPa) | 1 | 3 | 1 | 3 | 3(58.71 MPa) | 3 | 1 | 3 | 2 | 3(55.14 MPa) | 2 | 1 |
| Table 7. The level selection of factors for warpage, shrinkage and average of normalized shrinkage and warpage optimization based on ANOVA and ANN results |
3.4. ANN methodAs represented in Table 5, the training and forecasting R2 for each created ANN is higher than 0.95, which shows high accuracy of the fitted models on each 27 experiments group and their predictions. The optimal level selection of control factors based on ANN with warpage targets result in outputs of 1.360, 0.4647 and 0.6285 mm for PLA, PLA-TPU and PLA-TPS, respectively. Moreover, the optimal level selection extracted from ANN models with shrinkage targets results in 6.917, 1.791 and 2.670% shrinkage for PLA, PLA-TPU and PLA-TPS, respectively. Furthermore, for the minimization of shrinkage and warpage at the same time, i.e. after averaging normalized shrinkage and warpage, using the optimal level selection of factors predicted by ANN as reported in Table 7, the shrinkage and warpage of PLA, PLA-TPU and PLA-TPS become 7.0312% (1.361 mm), 1.791% (0.4647 mm) and 2.8127% (0.6273 mm), respectively. The ANN optimal level selection and pertaining targets (warpage, shrinkage or average of normalized shrinkage and warpage) are almost in agreement with ANOVA optimal level selection and obtained targets. Although ANN and ANOVA optimal targets are different in some cases, they are so close that their differences are considered negligible. Surprisingly, the ABCDE optimal level selections of warpage, shrinkage, and average of normalized shrinkage and warpage for PLA-TPU are the same, i.e. 13331, and more notably, its shrinkage and warpage are significantly lower than those of PLA and PLA-TPS. Thus, the very low warpage and shrinkage of PLA-TPU is added to its good processability, biocompatibility, biodegradability, and relative cost-effectiveness, which makes it a good injectable plastic and is applicable even in the food contactable usage.
4. ConclusionPLA polymer, PLA-TPU and PLA-TPS blends were considered as the injection molding materials for a plastic spoon set using Autodesk Moldflow® . Although shrinkage and warpage are interconnected, in this work, each of shrinkage and warpage was considered as a separate objective for the careful studies of affecting conditions. Taguchi and ANOVA methods were used to predict the optimal levels of processing conditions and to show the effects of coolant temperature, packing time, packing pressure, mold temperature and melt temperature on warpage and shrinkage of the polymer-molded articles. In Taguchi method, S/N ratios were utilized for better understanding of each control factor's effect on warpage and shrinkage. Results showed that the effect of changing conditions is different for each polymeric compound. These results also indicate that higher packing pressure causes lower shrinkage and warpage on spoon part. PLA-TPU spoon part has also the highest resistance to warpage and shrinkage due to its lowest crystallinity compared to the other two spoon parts. Taguchi coupled ANOVA and ANN analysis are two different methods, which result in detection of optimized levels for each factor. According to the results, melt temperature, coolant temperature and packing time have the most significant effect on shrinkage and warpage. The ANN optimal level selection and obtained warpage and shrinkage values are in good agreement with Taguchi results although they have slight differences. Mostly, the lower warpage is considered to be the main objective of spoon parts, and according to the best levels of control factors based on Taguchi and ANOVA, the lowest warpage of 1.359, 0.4647 and 0.5984 mm are obtained for PLA, PLA-TPU and PLA-TPS, respectively, which are even smaller than outputs of ANN optimal level selection. If the lower shrinkage is considered the main objective, the ANN optimal level selection of factors lead to the lowest shrinkages of 6.917%, 1.791% and 2.670% for PLA, PLA-TPU and PLA-TPS, respectively. In general, it is suggested to balance the lowest possible shrinkage and warpage simultaneously, by minimizing the average of normalized shrinkage and warpage using ANN, which becomes “ 7.025%, 1.367 mm” , “ 1.791%, 0.4647 mm” and “ 2.728%, 0.6928 mm” for shrinkage and warpage of PLA, PLA-TPU and PLA-TPS, respectively.
This research is performed in the framework of Applied Science Nano Research group (ASNARKA).


 , Mozhgan Bahrami