Correlation of Raw Materials and Waterborne Polyurethane Properties by Sequence Similarity Analysis
[Xing Zhou1, 2 , Changqing Fang1, 2, *  , Jing Chen
3 , Shujuan Li1 , Yan Li1 , Wanqing Lei1 ]
, Jing Chen|
|


Anionomer-type waterborne polyurethane dispersions (PUDs) were obtained from poly (propylene glycol) (PPG), isophoronediisocyanate (IPDI) and dimethylolpropionic acid (DMPA) through a modified prepolymer isocyanate process. Two series of polyurethanes were prepared (Groups A and B) and a new prediction model based on grey relational analysis is introduced to predict the impact order of raw materials on several properties, such as solids content, viscosity, acid number and electrolytic stability of polyurethanes. It is found that the model can successfully predict the impact of raw materials on the properties through the designed demonstration experiments. Furthermore, the results of the prediction model show that DMPA plays a key role in viscosity, partial acid values and electrolytic stability.
Waterborne polyurethane dispersions (PUDs) represent extraordinarily versatile polymeric materials that are used as coatings for various fibres, adhesives for alternative substrates, primers for metals, caulking materials, emulsion polymerization media for different monomers, paint additives, defoamers, associate thickeners, pigment pastes and textile dyes[1]. For wide application, a low-cost synthesis of polyurethanes with good performances is significant in polyurethanes industry. To obtain polyurethanes with good performances, the effects of structure and raw materials on performances have been widely discussed.
The main research about the structure's influence on performance focuses on the soft- and hard-segments, phase separation and crystallinity[2, 3, 4, 5], etc. The relations between the bulk structure and performances of polyurethane have been widely and deeply discussed. Seefried et al.[6] reported that the degree of phase separation or domain formation was strongly influenced by the bulkiness and symmetry of the diisocyanate. Wang and Cooper[7] studied the impact of phase separation, domain structure on the physical properties of polyurethane by utilizing differential scanning calorimetry, dynamic mechanical and infrared dichroism experiments. They concluded that the application properties, such as mechanical properties, depended primarily on the content and phase separation of hard- and soft-segments. Meanwhile, Jo et al.[8] prepared polyurethane with various polyols, consisting of soft segment. Hard- and soft-segments ratio was regarded as the key factor for the variation of micromorphology and mechanical property. Pielichowska et al.[9] reported the influence of chain extender on properties of polyurethane, indicating that the thermal stability increased without chain extender. According to previous researches, the bulk structure of polyurethane determines properties, especially the applied performance of polyurethane. Traditionally, the recognized research approach is “ raw materials → structure → properties” . However, the direct correlation of bulk structure and properties is not suitable for industrial production, for major consideration herein is the ratio of raw materials rather than the structure design in industry[10]. Moreover, one kind of materials may have multiple influences on a structure, for instance, diisocyanate dictates the phase separation, crystallinity, hard- and soft-segments ratio, etc. And the multiple influences definitely have cross-impact on the properties of polyurethane, which is rather complex and may confuse researchers and producers. Actually, the bulk structure is directly determined by the dosage molar ratio of raw materials, including different kinds of diisocyanate, oligomer polyols, chain extender[11, 12, 13, 14, 15], and the dimethylolpropionic acid (DMPA)[14, 16, 17]. Thus, we propose a new design route of ‘ raw materials → properties’ to exclude the multiple influences of structure on the properties of polyurethane.
Little attention has been paid to the influence sequence of all raw materials on one of the applied properties, such as the solids content, viscosity, acid number (AN), etc. These properties are vital for the application of polyurethane, for example, the AN is one of the most important performances of binder in printing ink industry. A large acid number will lead to an enhancement of the viscosity of ink, even a retrogradation, while a small value may bring a poor wettability to pigment of the binder, a poor flow property and glossiness of the printing ink[16]. Thus, the predication and control of the application properties are necessary in the preparation and use of polyurethane. Actually, PUD is mainly synthesized by five kinds of raw materials at least, all of which may have direct or indirect influences on the properties of the polyurethane dispersions. Additionally, the synergistic effect gives birth to manifold influences of all raw materials on one property. In the design of the recipe, emphasis of one property of PUD makes it difficult to achieve the synergistic effect. Therefore, it is extremely necessary to find out how the raw materials contribute to one of the properties of PUD. A mathematical model called grey correlation model is considered to predict the relations between raw materials and properties of PUD. The grey correlation model is based on geometric similarity sequence analysis and correlation measure among grey sequences to quantify the correlation of multiple sequences of different levels relative to a certain level. In mathematical theory, it is a geometric analysis that reflects the proximity of the space of the discrete series, and the fundamental idea of grey correlation model is to determine and order the correlations between designed factors. Through this model, the proximity of multiple sequences of the grey system can be analysed to identify the relations between different levels relative to a certain level. The proximity is named as grey correlation degree, and the higher the degree, the closer the relationship between sample sequences and compare sequences. In this research, properties of PUD are considered sample sequences, while the amount of raw materials are the compare sequences.
The diisocyanate used was isophoronediisocyanate (IPDI, 98 wt% purity, purchased from Jingchun Chemical, Shanghai, China), which is liquid at room temperature. Poly (propylene glycol) (PPG, molecular weight (Mw) = 2000, acid value ≤ 0.08 mg of KOH/G, hydroxyl value = 54-58 mg of KOH/G, dried under vacuum, at 120 ° C) and dimethylolpropionic acid (DMPA) (both purchased from Jingchun Chemical, Shanghai, China) were used as oligomer glycol and hydrophilic chain extender. 1, 4-Butanediol (BDO, 99.5 wt% purity), triethylamine (TEA, 99 wt% purity), and 1-methyl-2-pyrrolidone (NMP, 99 wt% purity) were purchased from Fuchen Chemical, Tianjin, China. Dibutyltindilaurate (DBTDL) was purchased from Qingxi chemical, Shanghai, China. Acetone, about 15-20 mL, was used throughout the process and deionized water was used as dispersing phase at last.
The general recipe used for the preparation of polyurethane dispersions (PUD) is listed inTable 1. Two groups of experiments (group A: A1, A2, A3 and group B: B1, B2, B3, B4, B5, B6) were designed and carried out in this research. For group A, three aqueous PUDs with different molar ratios of isocyanate groups to oligomer hydroxyl groups (hard-/soft-segment molar ratio of 3, 4, and 5, respectively) were synthesized to explore the impact of hard-/soft-segment proportion on polyurethane dispersions properties, while PUDs in group B experiments were synthesized on the basis of optimal hard-/soft-segment molar ratio through the result of group A experiments to study the impact of each raw material on properties of the dispersions. The DMPA content was set to be 5 wt% (with respect to the prepolymer weight) in group A experiments[18]. PPG and IPDI were added to a four-necked flask (500 mL) equipped with a mechanical stirrer, thermometer and spiral condenser in an electric-heated thermostatic water bath. The reaction was carried out at 80 ° C for 2.5 h, then DBTDL was added when the first reaction had occurred for 2 h, followed by the addition of DMPA dispersed in NMP at 60 ° C. The reaction continued at 80 ° C for another 2 h. Subsequently, the resulting prepolymer was cooled to about 35 ° C, and then BDO with a small amount of acetone and TEA in 120 g of deionized water were poured into the flask. In the whole process, a moderate amount of acetone was used to reduce the viscosity. After the reaction, the residual acetone was removed in a vacuum drying oven at 50 ° C and 0.05 MPa for 1 h. In this research, DBTDL (catalyst) and acetone (co-solvent removed after the reaction) were not taken into account due to their ineffectiveness[19].
| Table 1. Recipe for the preparation of polyurethane for prediction (g) |
Fourier transform infrared spectroscopy (FTIR) measurement was used to identify the structure of PUDs, the infrared spectra of the dried polyurethane films were obtained with a Fourier Transform IR spectrophotometer (SHIMADIU FTIR-8400S (CE)) and recorded in the transmission mode at room temperature by averaging 20 scans at a resolution of 16.0 cm-1. The spectra were analysed in the frequency range of 4000-400 cm-1. Proton nuclear magnetic resonance spectroscopy (1H NMR) spectra were obtained on a Bruker-400 MHz spectrometer, using sodium 2, 2-dimethyl-2-silapentane-5-sulfonate (DSS) as an internal standard, with D2O (0.5 mL) as solvent.
Solids content measurement was carried out according to ISO 124:1997 standard. About 1.5 g of PUDs was placed in a glass garden with a diameter of 60 mm. The solids content of every sample was calculated as the average of three measurements of weight before and after water evaporation. Brookfield viscosities of the PUDs were obtained using Brookfield viscometer DV-II+ (Brookfield Engineering Laboratories, Stoughton, MA, USA). About 250 mL sample was placed in a beaker at room temperature of 25 ° C and using spindle No. 61 with a stirring speed of 100 r/min. The Brookfield viscosity of every sample was calculated as the average of three experimental determinations. ANs of PUDs were measured according to ISO 2114:2000 standard. The indicator titration in part A was carried out in the measurement. Phenolphthalein indicator dissolved in ethyl alcohol as the standard described was prepared. For each determination, the AN values can be calculated, in milligrams of KOH per gram, from Eq. (1):
where V1 is the volume (mL) of KOH solution used to neutralize the resin solution, V2 is the volume (mL) of KOH solution used in the blank determination, m1 is the mass (g) of the test portion, and c is the concentration (mol/L) of the KOH solution. The electrolytic stability was measured by mixing 5 mL of PUDs and 5 mL of deionized water in a beaker (50 mL), an aqueous solution of 2 mol/L NaCl was slowly dropped into the beaker through a burette (50 mL) until coagulation. The electrolytic stability was measured by the volume of NaCl necessary to coagulate the PUDs. The values of all samples obtained were the average of three replicates.
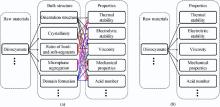
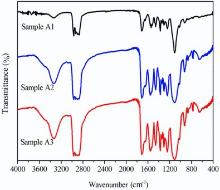
It is significant to simplify the common research route of “ raw materials → structure → properties” . Thus, the new design route based on the sequence similarity analysis, namely the “ raw materials → properties” process, is proposed to exclude the multiple influences of structure on the properties of polyurethane. The comparison between the common research and new design route is depicted as Fig. 1(a) and (b). To complete this research, the most important is the synthesis of stable PUD with suitable viscosity, solid content, AN, etc. The ratio of isocyanate groups to oligomer hydroxyl groups (hard-/soft-segment molar ratio) should be confirmed, thus the recipe of waterborne polyurethane dispersion in this research could be designed. A series of samples was prepared under proper NCO/OH ratio of 1.2 as the hard-/soft-segment molar ratio varied: 3, 4 and 5. As depicted in Fig. 2, FT-IR spectra were acquired for the PUDs samples in group A experiment and the spectral range from 400 to 4000 cm-1 was displayed to contrast the differences among them. It is obvious that the FT-IR spectra of the PUDs samples are quite similar, which is the typical curve of waterborne polyurethane[14]. The peak at 3332 cm-1, assigned to the hydrogen-bonded N-H group (free N-H group is near 3440 cm-1) with urethane carbonyl groups[5], indicates that most st N-H groups form H-bonding with carbonyl oxygen. Hydrogen bonding is a cooperative phenomenon, which contributes to the phase separation[2, 3, 4]. Meanwhile, C-N stretching and δ N-H stretching at 1542 cm-1, C-H stretching from 2865 to 2972 cm-1 and C=O stretching from 1640 to 1712 cm-1 occur. Actually, the C=O stretching from 1640 to 1712 cm-1 is significant and interesting in PUDs, which can be divided mainly into three peaks at 1640 cm-1, 1700-1658 cm-1 and 1712 cm-1respectively. The three peaks were attributed to the urea hydrogen bonded disordered carbonyl group, free urea carbonyl group and urethane hydrogen bonded disordered carbonyl group, indicating the formation of the unique hydrogen bonding of PUDs. These representative FT-IR bands suggest the generation of polyurethane. The assignment of the most characteristic IR bands is listed in Table 2<sup>[14].
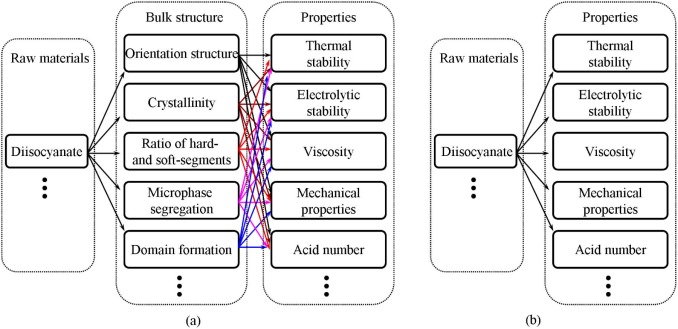 | Fig. 1. Correlation among raw materials, bulk structure and properties of polyurethane: (a) common route of “ raw materials → structure → properties” , which is much complex; (b) direct correlation between raw materials and properties. (The ellipsis represents the other elliptical raw materials, bulk structure and properties of polyurethane). |
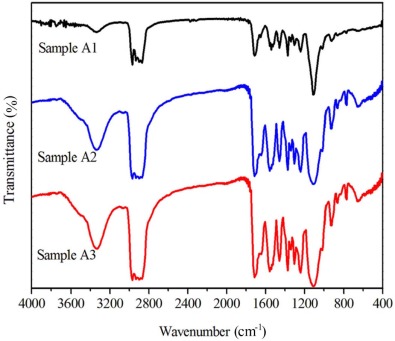 | Fig. 2. FTIR spectra of PUDs with different hard-/soft-segment molar ratio. |
| Table 2. Characteristic IR bands of PUDs |
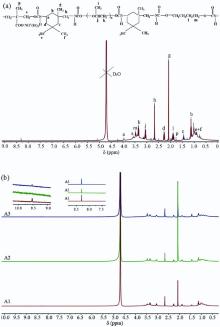
The structure and 1H NMR results[15] of the samples are shown in Fig. 3. As depicted inFig. 3(a), peaks at 1.89, 3.47 ppm are assigned to the methylene protons of -CH2CH2-O-, -CH2CH2-O- in BDO blocks, respectively. Peaks at 1.01, 3.05, 3.35 ppm are assigned to the methyl, methyne and methylene protons in PPG blocks, respectively. Two sharp peaks at 2.08 and 2.67 ppm are attributed to the -CH3 adjacent to the -CH2-NH- on the alicyclic and the methylene protons of -CH2-NH-COO-, respectively. Other peaks are assigned to correspond to the structure in Fig. 3(a). Due to the effect of D2O exchange, two extremely weak peaks at 6.55 and 7.33 ppm may be attributed to -CH2-NH-COO- and -NH-COO-CH2linked with alicyclic, respectively. It is obvious that all samples have a similar structure as shown in Fig. 3(b). In addition, two weak peaks at 8.30 and 9.52 ppm can be observed inFig. 3(b), which may be attributed to -NHCONH- and -NHCONCONH- units, respectively. The presence of -NHCONH- and -NHCONCONH- units is considered to be the reason for the side reaction during the synthesis of polyurethane. It confirms that there are urea and biuret in all samples. These results correspond with the FTIR analysis. Moreover, it is obvious that the intensity of the peaks at 8.30 and 9.52 ppm in Fig. 3(b) is in the order of Sample A1 > Sample A3 > Sample A2, indicating that the amount of side products is the largest in A1 and the least in A2. This may be one of the reasons that A1 has a poor stability, while A2 shows the best stability.
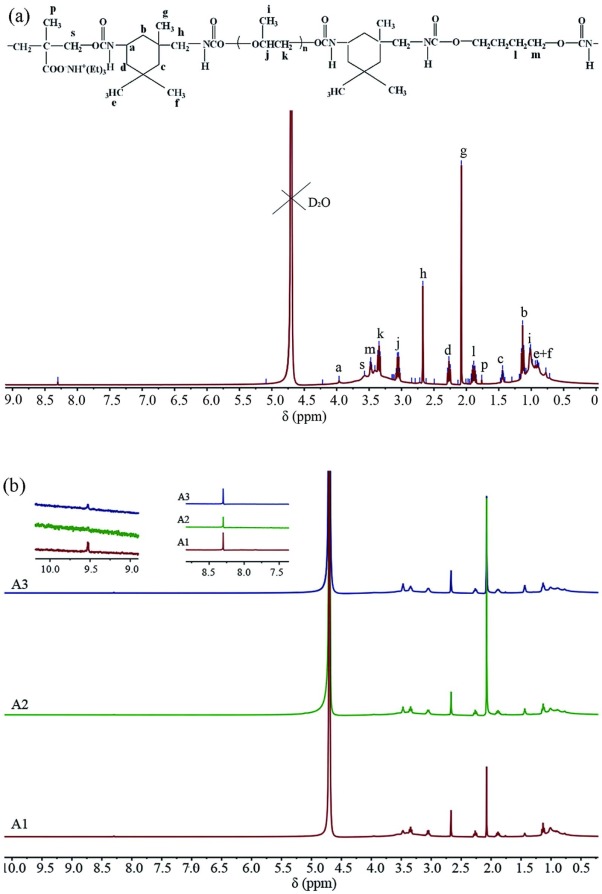 | Fig. 3. (a) Structure and 1H NMR spectrum of sample A1; (b) 1H NMR spectrum of all samples, (1) sample A1, (2) sample A2, (3) sample A3. |
Grey prediction theory can deal with incomplete information effectively for small sample forecasting[20, 21]. The grey relational coefficient and grey correlation degree play core roles in grey prediction theory. In this study, we adopt the grey relational analysis of grey system theory to predict the relative influence between raw materials and dispersions of polyurethane. According to previous studies[22, 23], the parameters, such as the grey relational coefficient (ξ i(k)), identification coefficient (ρ ), and grey correlation degree (ri), have been defined and calculated. And then, the relative relation between sample sequences and compare sequences can be easily obtained by comparing the values of ri. The solids content, Brookfield viscosity, AN and the volume of NaCl consumed values of the samples for prediction are listed in Table 3. All samples show relatively high solids content and low viscosity, which are good for drying and can be applied as binder and dispersion to pigment[24]. As shown in Table 3, the viscosity decreases as the molar ratio of hard-/soft-segment is lower than 4, and the acid number is decided by the content of DMPA, which increases as the hard-/soft-segment molar ratio (molar ratio of 3, 4 and 5) increases. Acid numbers of all samples are in the range of 7-9 mg of KOH/g, which is suitable for waterborne ink binder. The grey relational analysis is employed to clarify the direct and indirect influence factors (each raw material) on the applied properties. Firstly, the values of raw materials and properties of sample A1 are defined as the samples sequence (sequence ϑ 0), and then the data of sample A2 and A3 as the compare sequences (sequences ϑ 1 and ϑ 2). The original data sequences of the experiments should be processed to acquire standardized sequence through Eq. (2).
where
| Table 3. Solids content, Brookfield viscosity, volume of NaCl consumed values and AN of WPU in group A experiment for correlation prediction |
| Table 4. Standardized sequence for prediction based on samples A1, A2 and A3 in group A experiments |
To calculate the grey correlation degree values, the value of ρ and ω k should be determined. According to a previous study [17], the suitable value of ρ is 0.5, and the ω k value is the reciprocal of the amount of k. According to previous reports [22, 23], the grey relational coefficient (ξ i(k)) and grey correlation degree values (ri) could be calculated. As depicted inTable 5, the ri values are suitable for forecasting the influence of raw materials on each property of PUDs. The higher the ri value is, the greater influence of one kind of raw materials has on the property for waterborne polyurethane. Meanwhile, the impact factors could be classified as direct impact factors and indirect ones. Through the values of ri and classification of impact factors, the impact factor sequence could be obtained. It is obvious that the value of ri of each raw material for solids content orders as: r6 (TEA) > r2 (PPG-2000) > r4 (NMP) > r3 (DMPA) > r1 (IPDI) > r5 (BDO). TEA, whose boiling point is 89.5 ° C, is used as neutralizer, and the residual TEA which reacts incompletely in PUD volatilizes easily during the solids content measurement. Thus, it may be considered an indirect influence factor for solids content. Meanwhile, in the polyurethane synthesis process, TEA reacts with ionic groups of DMPA; it is supposed that DMPA may also be considered an indirect influence factor, and other raw materials are direct influence factors for solids content. The influence order of direct influence factor of each raw material on solids content is: r2 (PPG-2000) > r4 (NMP) > r1 (IPDI) > r5 (BDO), and that of indirect influence factor is r6(TEA) > r3 (DMPA).
| Table 5. Grey correlation degree values (ri) for prediction based on samples A1, A2 and A3 in group A experiments |
For electrolytic stability, the value of ri of each raw material is in this order: r1 (IPDI) > r3(DMPA) > r4 (NMP) > r6 (TEA) > r2 (PPG-2000) > r5 (BDO). Due to the existence of anions from DMPA, the PUDs have a definite ionic strength. So, a certain amount of strong electrolytes could result in coagulation in PUDs. Previous studies [18, 25] concluded that electrolytic resistance increases as DMPA contentincreases. Thus, DMPA is considered a direct influence factor, and the influence of indirect influence factors on electrolytic stability is in this order: r1 (IPDI) > r4 (NMP) > r6 (TEA) > r2 (PPG-2000) > r5 (BDO). For AN, ri value of each raw material is in this order: r6 (TEA) > r4 (NMP) > r3 (DMPA) > r2 (PPG-2000) > r1(IPDI) > r5 (BDO). There is no doubt that NMP is used as co-solvent, which may have no influence on AN. So, NMP could be ignored in the influence order. In this research, DMPA supplies carboxylic acid ions (-COOH), which mainly consume KOH. That is to say, DMPA is the determining factor to AN, and the other raw materials may be an indirect factor. The influence on AN is in this order: r6 (TEA) > r2 (PPG-2000) > r1 (IPDI) > r5 (BDO). However, it is hard to predict the influence factors on viscosity[26] due to different kinds of complex factors. In this research, raw materials are regarded as the point to try to explore the degree of influence factors on viscosity. It is obvious that NMP used as co-solvent is one of the direct influence factors: the more co-solvent there is, the lower is the viscosity. According to the double layer theory of O. Lorenz [16, 27, 28], the variation of viscosity is mainly caused by the electric stagnant effect of double layer, of which the hydrophilic groups of PUD colloidal particle adsorb cation to form diffuse double layer. The hydrophilic groups and cations are introduced by DMPA and TEA, respectively. Thus, in this discussion, DMPA and TEA should be considered direct influence factors, and the impact order is: r3 (DMPA) > r6 (TEA) > r4 (NMP). The other raw materials may be the indirect influence factor, and the impact order is: r5 (BDO) > r2 (PPG-2000) > r1 (IPDI). Actually, BDO, PPG and IPDI basically determine the value of NCO/OH, which has a key impact on molecular weight of polyurethane. The variation of molecular weight has an indirect influence on viscosity according to a previous study[29].
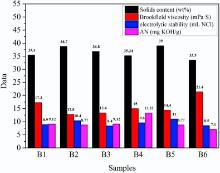
To demonstrate the applicability of grey relational analysis and the veracity of prediction for its application in polyurethane dispersions, another six group experiments have been carried out. The solids content, Brookfield viscosity, AN and the volume of NaCl consumed values of the samples in group B experiment for demonstration are presented as Fig. 4. The values of raw materials and properties of sample B1 are defined as samples sequence (ϑ 0) and the data of other samples in Fig. 4 as compare sequences (ϑ 1, ϑ 2, ⋅ ⋅ ⋅ ϑ 5).
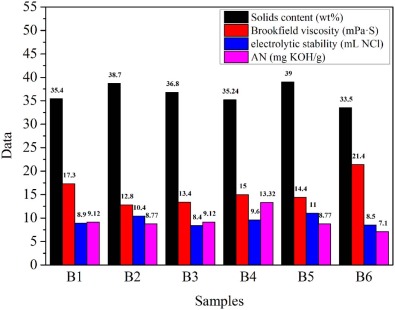 | Fig. 4. Properties of waterborne polyurethane dispersions for demonstration. |
The values of raw materials and properties of sample B1 are defined as the samples sequence, and the data of all the PUDs are calculated by Eq. (3), thus, the standardized sequence of properties and raw materials can be obtained, as shown in Table 6, and the standardized sequence is set as sequence xi(k) through Definition 1 as follows (x0(k), representing each kind of property of PUDs, and x1(k)-x6(k) represent each kind of raw material sequence):
| Table 6. Standardized sequence for demonstration based on samples B1-B6 in group B experiments |
The values of ρ and ω k are the same as prediction. As shown in Table 7, ri values are suitable for demonstrating the prediction of the influence of raw materials on each property of PUDs in Section 3.2. To prove the prediction in Section 3.2, the data in Table 7 could be ordered to confirm the demonstration order is the same as prediction order. For solids content, the direct influence factor of each raw material on solids content is in this order: r2(PPG-2000) > r4 (NMP) > r1 (IPDI) > r5 (BDO), and the indirect influence factor order is r6(TEA) > r3 (DMPA). The order of demonstration shows excellent agreement with prediction order. It means that grey relational analysis can effectively analyse the relation between solids content and raw materials. In the recipe of waterborne polyurethane, TEA and DMPA are exactly the indirect influence factors for solids content. Thus, to obtain PUD with high solids content, the most effective method is to increase polyol oligomers content.
| Table 7. Grey correlation degree values (ri) for demonstration based on samples B1-B6 in group B experiments |
For electrolytic stability, except DMPA, the order of the values of raw materials is in this order: r2 (PPG-2000) > r1 (IPDI) > r4 (NMP) > r6 (TEA) > r5 (BDO), and it is a little different from prediction order of electrolytic stability in Section 3.2.2. The difference is caused by PPG-2000, the soft segment of polyurethane. The soft segment herein is the cationomeric polymeric backbone of polyurethane[17]. It is proposed that the definite ionic strength of PUD be determined by the intercoordination between the cationomeric structure of PPG and anionic counterions of DMPA. Thus, the soft segment with cationomeric structure should be considered a direct influence factor. The predicted order of direct influence of electrolytic stability is r3 (DMPA) > r2 (PPG-2000), while the demonstration order is reversed, i.e. r2 (PPG-2000) > r3 (DMPA). It means that the impact factor of DMPA and PPG-2000 on electrolytic stability is uncertain through grey relational analysis. Considering the intercoordination between cationomeric structure and anionic counterions, their impact factor may be determined by the contents ratio of PPG-2000 and DMPA. The orders of indirect influence of electrolytic stability for prediction and demonstration are absolutely the same: r1 (IPDI) > r4 (NMP) > r6 (TEA) > r5 (BDO). So the grey relational analysis can effectively analyse the relation between electrolytic stability and raw materials. As a conclusion, the electrolytic stability is directly decided by the component of polyol oligomer and hydrophilic chain extender, and indirectly depends on diisocyanate and the hard-segment.
As discussed in the prediction section, DMPA is the direct influence factor and NMP is ignored for AN, and the values of other raw materials for AN are in this order: r6 (TEA) > r2(PPG-2000) > r1 (IPDI) > r5 (BDO) as shown in Table 7. The indirect influence factor order of demonstration corresponds absolutely with prediction order. So the grey relational analysis can also effectively analyse the relation between AN and raw materials. The impact order of direct influence factor for viscosity in demonstration is: r3 (DMPA) > r4 (NMP) > r6 (TEA). Compared with the order in prediction capture, the difference is caused by NMP which is the co-solvent, and the difference may be due to the different dosages of NMP in prediction and demonstration experiments. The orders of DMPA and TEA are the same, indicating that double layer theory of O. Lorenz is suitable to explain the variation of viscosity in grey relational analysis. The impact order of indirect influence factor for viscosity is: r2 (PPG-2000) > r1 (IPDI) > r5 (BDO). The difference is caused by BDO, which is used as chain extender and can decide the molecular weight of polyurethane. This research does not intend to explain the difference caused by BDO. Still, the impact orders of PPG and IPDI are the same in prediction and demonstration. So the grey relational analysis should be revised appropriately to make its accuracy sufficient for predicting the relation between raw materials and viscosity.
A prediction model was developed for the relations between raw materials and some applied properties of PUD based on grey relational analysis. Through prediction and demonstration of the experiment data, the model in this research can successfully predict the impact order of raw materials on the applied properties. DMPA is found to play a key role in the applied properties through the model, and is the determining factor that affects the applied properties most in this research. Nevertheless, we conclude that the most effective method to obtain PUD with high solid content is to increase polyol oligomers content. The electrolytic stability is directly decided by the component of polyol oligomer and hydrophilic chain extender, and indirectly depends on the diisocyanate and the hard-segment. In addition, viscosity of PUD dispersions is affected by various factors, and it can only be predicted through the model roughly.
The authors acknowledge the financial support provided by Program for New Century Excellent Talents in University by the Ministry of Education of China (Grant No. NCET-12-1045), the Shaanxi Programs for Science and Technology Development (No. 2010K01-096) and Ph.D. Innovation Fund Projects of Xi'an University of Technology (No. 310-252071501).
The authors have declared that no competing interests exist.
| [1] |
|
| [2] |
|
| [3] |
|
| [4] |
|
| [5] |
|
| [6] |
|
| [7] |
|
| [8] |
|
| [9] |
|
| [10] |
|
| [11] |
|
| [12] |
|
| [13] |
|
| [14] |
|
| [15] |
|
| [16] |
|
| [17] |
|
| [18] |
|
| [19] |
|
| [20] |
|
| [21] |
|
| [22] |
|
| [23] |
|
| [24] |
|
| [25] |
|
| [26] |
|
| [27] |
|
| [28] |
|
| [29] |
|