


Difference in the Hot Compressive Behavior and Processing Maps between the As-cast and Homogenized Al-Zn-Mg-Cu (7075) Alloys
[S.Y. Park1, 2 , W.J. Kim1, *  ]
]
]
|
|


The deformation mechanisms and processing maps of the as-cast Al-Zn-Mg-Cu (7075) aluminum (Al) alloy were studied and compared with those of the homogenized 7075 Al alloy in the temperature range of 573-723 K and in the strain rate range of 10-3-10 s-1 to explore a possibility for directly using the as-cast 7075 Al alloy as a billet for hot working. The as-cast and homogenized 7075 Al alloys had similar grain sizes and showed similar high-temperature deformation behaviors. The as-cast 7075 Al alloy, however, exhibited higher power efficiencies and smaller unstable flow regions compared to the homogenized 7075 Al alloy because of the presence of secondary phases (MgZn2) segregated at the dendritic interfaces in the as-cast microstructure, which were formed during non-equilibrium solidification. These segregated phases provided nucleation sites for dynamic recovery or continuous dynamic recrystallization, and as a result a fine and more homogeneous (sub)grain structure could be obtained from the as-cast microstructure compared to the homogenized microstructure. The current work suggested the possibility and advantage of using as-cast microstructures for hot working of aluminum alloys with high content of solutes.
The Al-Zn-Mg-Cu (7075) aluminum (Al) alloy has a high strength-to-density ratio and high resistance to stress corrosion cracking[1]. This alloy has been used in military and commercial applications. Many researchers have studied the hot compressive characteristics and processing maps of the extruded 7075 Al alloys to find their optimum hot working conditions[2, 3, 4, 5, 6, 7, 8, 9, 10], but limited studies have been carried out on the as-cast or homogenized 7075 Al alloys. Direct application of forging or extrusion on the as-cast 7075 Al alloy has the advantages of time, energy and cost saving by omitting the homogenization step, but can be challenging because the 7075 Al alloy has a large amount of solutes and a wide solidification temperature range, such that a high degree of segregation of solutes occurs at the interdendritic interfaces and grain boundaries during the solidification process. These segregated phase domains, often forming a network-like structure [11, 12], provide easy path for crack growth during hot plastic deformation at low temperatures and cause partial melting due to eutectic reaction at high temperatures[13, 14], leading to narrowing of the temperature and strain rate ranges for successful hot working.
In this work, hot compressive deformation characteristics and processing maps of the as-cast 7075 Al alloy prepared by direct chill (DC) casting were studied, and the results were compared with those of the same alloy after the homogenization treatment. The obtained result was unexpected and interesting because it suggested benefits for directly using an as-cast microstructure for hot working.
A 7075 Al alloy ingot 150 mm in diameter was fabricated with conventional DC casting (supplied from RIST, Korea). The samples for microstructural observation and hot temperature compression tests were cut along the cross section of the ingot, at the places located at the 2/3 position away from the center. Some samples were subjected to a conventional homogenization treatment (at 753 K for 24 h), followed by cooling in air. The 7075 Al alloy before and after the homogenization treatment will be referred to as the as-cast 7075 Al alloy and the homogenized 7075 Al alloy, respectively.
The chemical composition of the 7075 Al alloy was determined using an inductively coupled plasma atomic emission spectrometer (Spectro, Spectrolab), and the result is presented inTable 1. High-resolution XRD (HR-XRD, SmartLab) was used to identify the phases in the as-cast and homogenized 7075 Al alloys.
| Table 1. Chemical compositions (wt%) of the 7075 alloy |
For the analysis of the microstructural characteristics of the as-cast and homogenized 7075 alloys before and after the compression tests, a scanning electron microscope (SEM, JSM-7100F) with energy dispersive spectroscopy (EDS) was used. The samples were ground, polished and chemically etched with a Keller's etching solution of 190 mL H2O + 5 mL HNO3 + 3 mL HCl + 2 mL HF.
Electron back-scattering diffraction (EBSD) analysis with a scanning step size of 0.7 µ m was used for the characterization of the microstructures of the initial and hot-compressed samples. In preparing the samples for EBSD analysis, the surface of the samples in the section parallel to the compression axis was mechanically ground with SiC paper and then ion-milled. The EBSD data were processed using the TSL-OIM analysis software, and the data points with a confidence index lower than 0.1 were removed from the EBSD data. Because the microstructure obtained after the compression tests was different depending on its position within a sample, the microstructure study on the deformed samples was conducted at the center of each sample.
The phases that possibly form in the 7075 Al alloy under non-equilibrium and equilibrium conditions were calculated using thermodynamic phase diagram software JMatPro (Ver. 7), which was linked with a thermodynamic database for aluminum alloys.
Hot compression tests were performed on the as-cast and homogenized 7075 Al alloys at different temperatures (T) in the range from 573 to 723 K and different strain rates (
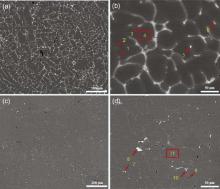
Fig. 1(a)-(d) shows the SEM micrographs of the as-cast and homogenized 7075 Al alloys at low and high magnifications. Solutes were segregated at grain boundaries and interdendritic interfaces in the as-cast microstructure, forming a network structure. This is a typical microstructure obtained from a 7075 Al alloy during the non-equilibrium solidification process[11, 12]. According to the EDS analysis (Table 2), the solute-segregated regions were rich with Mg, Zn or Cu. Impurities such as Si and Fe were also segregated. After the homogenization treatment, the area of the solute-segregated regions was significantly reduced, leaving a small amount of residue, indicating that most of the non-equilibrium phases have dissolved into the matrix during the homogenization process. This is also supported by the observation that the concentrations of Zn and Mg in the grain interiors (a position of 4 in Fig. 1(b)), which were initially much lower than the chemical composition of the ingot (Table 1), became almost comparable to the composition of the ingot after the homogenization treatment (a position of 11 in Fig. 1(d)).
 | Fig. 1. SEM micrographs of the (a, b) as-cast and (c, d) homogenized 7075 Al alloys at low and high magnifications. |
| Table 2. EDS analysis (wt%) on the selected positions in Fig. 1(b) and (d) |
The types of phases and their phase fraction in the 7075 Al alloy based on the chemical composition of the ingot (Table 1) were calculated using the non-equilibrium (Scheil-Gulliver solidification) and equilibrium models. The calculation results are presented inFig. 2(a) and (b). In both models, the major secondary phase is MgZn2. According to the non-equilibrium model, in addition to MgZn2, which comprises as much as 4.2 wt%, minor amounts of Al2Mg3Zn3, Mg2Si and Al3Fe are present in the as-cast microstructure. Considering the two models, it is expected that MgZn2 and Al2Mg3Zn3 segregated at the interdendritic area in the as-cast microstructure vanish during the homogenization treatment, and Al2CuMg, MgZn2 and Al2Mg3Zn3 precipitate in sequence during slow cooling after homogenization.
 | Fig. 2. Types of phases and their phase fraction in the 7075 Al alloy calculated using the (a) non-equilibrium and (b) equilibrium and models. |
The HR-XRD results for the as-cast and homogenized 7075 Al alloys are shown in Fig. 3. Four types of compounds were clearly identified in the as-cast microstructure: Mg2Zn, Mg2Si, Al2Mg3Zn3 and Al2CuMg. Mg2Zn are the major secondary phases. After the homogenization treatment, the peaks for these compounds diminished significantly, indicating the occurrence of dissolution of the segregated phases into matrix and supersaturation of the matrix with solute atoms.
 | Fig. 3. HR-XRD results for the as-cast and homogenized 7075 Al alloys. |
Measurement of grain size from the as-cast microstructure with dendritic structure is often difficult because grain boundaries and interdendritic interfaces are difficult to distinguish from each other using optical microscopy (OM) or SEM. For this reason, EBSD, in which grain boundaries can be distinguished by lattice misorientation and grain boundary plane orientation, was used to determine the grain size of the as-cast and homogenized 7075 Al alloys. Fig. 4(a) and (b) show the image quality (IQ) and inverse pole figure (IPF) maps of the as-cast and homogenized 7075 Al alloys. The average grain size of the as-cast microstructure was 581.9 µ m, which is significantly larger than the interdendritic spacing (50-100 µ m), and most of the grain boundaries were characterized by high angle boundaries. The average grain size of the homogenized microstructure (634.1 µ m) was not much different from the average grain size of the as-cast microstructure, implying that grain growth during the homogenization treatment was small.
 | Fig. 4. Image quality (IQ) and inverse pole figure (IPF) maps of the (a) as-cast and (b) homogenized 7075 Al alloys. |
The true stress (σ )-true strain (ε ) curves obtained from the compression tests of the as-cast and homogenized 7075 Al alloys performed at various temperatures and strain rates are presented in Fig. 5(a)-(d) and Fig. 6(a)-(d), respectively. The flow stresses corrected for the temperature rise from the adiabatic heating are indicated by open symbols. The effect of the temperature rise was significant at low temperatures (573 and 623 K) and at high strain rates (1 and 10 s-1). For the as-cast and homogenized 7075 Al alloys in common, the rate of strain hardening was low, and the steady state was reached at an early stage of deformation, even at the highest strain rate of 10 s-1.
 | Fig. 5. True stress (σ ) vs. true strain (ε ) curves obtained from the compression tests of the as-cast 7075 Al alloy performed at various strain rates at (a) 573 K, (b) 623 K, (c) 673 K, and (d) 723 K. |
 | Fig. 6. True stress (σ ) vs. true strain (ε ) curves obtained from the compression tests of the homogenized 7075 Al alloy performed at various strain rates at (a) 573 K, (b) 623 K, (c) 673 K, and (d) 723 K. |
The high temperature plastic flow behavior of metals and metallic alloys has been established to be depicted well using Garofalo's hyperbolic sine creep relationship[15], which is given as follows:
where Qc is the activation energy for plastic flow, R is the gas constant, n is the stress exponent, A is the material constant, and α is a fitting parameter. Eq. (1) can be reduced to Eq. (2) and Eq. (3) at low stresses where a power-law creep dominates plastic flow and at high stresses where a power-law breakdown occurs, respectively:
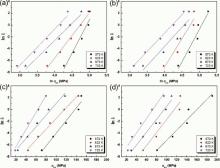
where β =α n1. Ideally, n1 is the same as n in Eq. (1), but n1 can be slightly different fromn in measurement depending on the number of the experimental data points available for analysis. The flow stress at ε = 0.4(σ 0.4) was chosen for the analysis of plastic flow. Using the σ 0.4 values of the as-cast and homogenized 7075 Al alloys, which were corrected for the adiabatic temperature rise, Eq. (2) and Eq. (3) were plotted in the form of
Qc=nRS (4)
where n is the stress exponent measured from the plot of
 | Fig. 7. Plots of |
 | Fig. 8. Plots of |
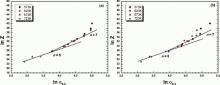
To verify the above analysis results, the plots of ln Z vs.
 | Fig. 9. Plots of ln Z vs. |
The constitutive equation of Eq. (1) does not consider the influence of strain on the flow stress. The effect of strain on flow stress was examined by plotting Eq. (1) at different strains (0.2, 0.4, 0.6 and 0.8), and this is shown in Fig. 9(b) and (c). The curves of each alloy from different strains are almost overlapped and high-quality fitting is obtained at all the strains, indicating that the effect of strain on flow stress is trivial, at least in the current temperature and strain rate range.
For a better understanding of the deformation mechanisms of the as-cast and homogenized 7075 Al alloys, the plots of ln Z vs.lnσ 0.4 were constructed in Fig. 10(a) and (b). The n1 values of the two alloys are approximately 5 at low ln Z, suggesting that lattice diffusion controlled dislocation climb creep dominates the plastic flow at high temperatures and low strain rates. As ln Z further increases, the n1 values gradually increase. Power-law breakdown has been suggested to be associated with n1 > 7 [15, 19]. For the as-cast 7075 Al alloy, only the data obtained from the lowest temperature and the two high strain rates (573 K/1-10 s-1) belong to the power-law breakdown regime. For the homogenized 7075 Al alloy, the data obtained from a wider range of temperatures (573-673 K) and strain rates (10-1-10 s-1) belong to the power-law breakdown regime. The data correlation in the power-law breakdown regime is relatively poor compared to the data correlation in the power law regime.
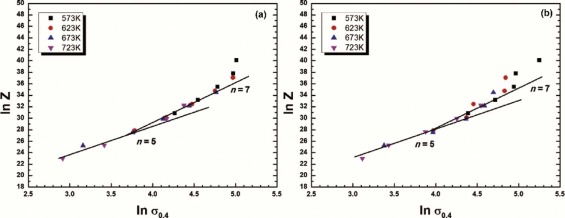 | Fig. 10. Plots of ln Z vs. lnσ 0.4 for the (a) as-cast and (b) homogenized 7075 alloys. |
A processing map based on the dynamic materials model (DMM), which is a superimposition of an instability map on the power dissipation map, has been used to predict the optimum hot working conditions for a variety of metals[20, 21, 22, 23]. According to the DMM-based processing maps[20, 21], the power can be partitioned into two parts: one part is the power dissipation through plastic deformation, most of which is converted into heat, and the other part is the power dissipation through microstructural evolution that includes dynamic recovery, dynamic recrystallization and damage of the material. The power dissipation through microstructural evolution can be depicted in the form of an efficiency of power dissipation (η ), which is a sole function of m[20]:
η =2m/(m+1) (5)
where m = 1/n1. When m = 1, η = 1. The m values for the as-cast and homogenized 7075 Al alloys were measured at different temperatures, strain rates and strains after correction of the flow stress influenced by the adiabatic temperature rise. The typical η values associated with dynamic recrystallization (DRX) and dynamic recovery (DRV) have been proposed to be 35%-45% and 20%-30%, respectively [20], and the lesser efficiency for DRV was attributed to the less effective energy dissipation through dislocation annihilation by DRV compared to DRX. The η values calculated using Eq. (5) for the as-cast and homogenized 7075 Al alloys were plotted on the temperature-strain rate plane to obtain the power dissipation maps at four different strain levels (0.2, 0.4, 0.6 and 0.8). The maps are shown in Fig. 11(a)-(d) and Fig. 12(a)-(d). In both alloys, the domain with the largest η values develops at 673 K/10-3 s-1. Fig. 13 shows the η values of the as-cast and homogenized 7075 Al alloys as a function of strain rate at ε = 0.8. The η -values of the two alloys tend to decrease with increasing strain rate and decreasing temperature. Theη -values of the as-cast 7075Al alloy are larger than those of the homogenized 7075 Al alloy especially at high strain rates. The largest difference in η value between the two alloys at high strain rates is observed at 673 K.
 | Fig. 11. Processing maps for the as-cast 7075 Al alloys at strains of (a) 0.2, (b) 0.4, (c) 0.6 and (d) 0.8. |
 | Fig. 12. Processing maps for the homogenized 7075 Al alloys at strains of (a) 0.2, (b) 0.4, (c) 0.6 and (d) 0.8. |
 | Fig. 13. η values of the as-cast and homogenized 7075 Al alloys as a function of the strain rate at ε = 0.8. |
The instability map can be developed based on the extremum principle of the irreversible thermodynamics applied to the large plastic flow body[24]. The instability criterion is given as follows:
The instability maps (shaded regions) constructed at different strain levels using Eq. (6)were overlapped with the power dissipation maps in Fig. 11(a)-(d) and Fig. 12(a)-(d), in which the instability regions (e.g., the adiabatic shear bands or flow localization) are characterized by the negative
Fig. 14(a)-(f) shows the IQ, IPF and grain boundary map images of the as-cast and homogenized 7075 Al alloys after the compression tests at 673 K at three different strain rates of 10-3, 10-1 and 10 s-1. No micro-cracking was observed in any case, for both alloys. In the case of the homogeneous 7075 Al alloy, at 10-3 s-1 that is associated with the large η -value (38.3%), well-defined subgrains with low angle boundaries (2° -15° ) developed inside and along the elongated original grains. Strings of fine equiaxed grains with high angle boundaries (> 15° ) are preferentially formed along the boundaries of the deformed original grains. At 10-2 s-1, the number of well-defined subgrains in grain interiors decreased and development of dislocation substructure is confined near the grain boundaries. At 10 s-1, shear bands formed over several grains, indicative of the occurrence of highly localized plastic deformation. In the case of the as-cast 7075 Al alloy, at 10-3 s-1, the fraction of high angle boundaries is 0.58, which is much higher than the value of 0.19 measured from the homogenized 7075 Al alloy at the same strain rate. Furthermore, the grain size is smaller and the grain-size distribution is more homogeneous. As the strain rate increased, the image quality (IQ) of the diffraction patterns decreased, indicating that the extent of DRV or DRX decreased. Compared to the homogenized 7075 Al alloy, dislocations and cell structures were more densely populated in the grain interiors of the as-cast 7075 Al alloy. Another to note is that unlike in the homogenized 7075 Al alloy, shear bands were rarely observed at 10 s-1 in the as-cast 7075 Al alloy.
 | Fig. 14. IQ, IPF and grain boundary map images of the (a, b, c) as-cast and (d, e, f) homogenized 7075 Al alloys after the compression tests at 673 K at three different strain rates of 10-3, 10-1 and 10 s-1. In the grain boundary maps, low angle boundaries (2° -15° ) are in blue and high angle boundaries (> 15° ) are in red. |
Above microstructural observations suggest that the phases segregated at interdendritic interfaces provide enhanced sites for DRV or a nucleation site for DRX. In aluminum with high stacking-fault energy, DRV is important and recrystallization occurs mainly by continuous dynamic recrystallization (CDRX)[25, 26]. When DRV occurs, subgrains are developed through the conversion of dislocation cell walls into subgrains, and when CDRX occurs subgrains are converted to grains with high-angle boundaries by continuous accumulation of the dislocations introduced by the deformation at subgrain boundaries. According to the particle stimulated nucleation (PSN) theory [27, 28], a particle with size larger than 1 µ m promotes formation of a plastically deformed zone around it by inducing stress concentration, which stores strain energy and provides the driving force for DRV or CDRX. This PSN effect explains the formation of finer and more homogeneous (sub)grains in the as-cast microstructure than in the homogenized microstructure. The suppression of unstable flow at high strain rates in the as-cast 7075 Al alloy may be also due to the presence of segregated phase particles, which decreases the driving force for shear banding by providing a large number of sites for easy plastic deformation. The degree of conversion of substructure to subgrains or high angle boundary grains should depend on strain rate and temperature. The current study shows that the degree of conversion is higher at a lower strain rate. This result is in agreement with the report by Deng et al. [16], who showed that the degree of conversion increased with an increase in temperature and a decrease in strain rate in a 7050 Al alloy.
Finally, it needs to be explained why the as-cast 7075 Al alloy has a lower stress level compared to the homogenized 7075 Al alloy (Fig. 9(a)). There are two possible explanations for this. First, in the homogenized microstructure, the concentration of solute atoms in the matrix is higher than in the as-cast microstructure. Therefore, from the homogenized 7075 Al alloy, a higher solute strengthening effect, which arises from a stacking-fault-energy effect[29], can be expected. Second, during DRV or CDRX, grain boundary sliding (GBS), which depends on the refined grain size and the characteristics of the angle boundaries, can provide plastic strain. As the as-cast 7075 Al alloy has more highly refined (sub)grains compared to the homogenized 7075 Al alloy, contribution of GBS to total strain is expected to be higher, leading to a lower flow-stress level.
(1) The as-cast and homogenized 7075 Al alloys showed similar activation energy for plastic flow and had similar high temperature deformation mechanisms in which dislocation climb creep and power-law breakdown dominate the plastic flow at small and large Zener-Hollomon parameter values, respectively.
(2) The presence of secondary phases (MgZn2) segregated at dendritic interstices did not cause brittle cracking even at the highest strain rate of 10 s-1 when temperature was above 573 K.
(3) According to the processing maps and microstructure observation after the compression tests, the as-cast 7075 Al alloy has higher power dissipation efficiencies and smaller regions for unstable flow compared to the homogenized 7075 Al alloy. This result indicates that the former exhibits better hot workability than the latter.
(4) The segregated phases provided nucleation sites for DRV or CDRX grains. As a result, fine and more homogeneous microstructure could be obtained from the as-cast 7075 Al alloy.
(5) The current work suggests the possibility of omitting a homogenization processing step and an advantage of using the as-cast microstructure for achieving a good hot workability from the aluminum alloys with high content of solutes.
This work was supported by the Technology Innovation Program (10048322, Continuous casting of high-strength aluminum alloys containing minimum 10% solute element) funded by the Ministry of Trade, Industry and Energy (MI, Korea)
The authors have declared that no competing interests exist.
| [1] |
|
| [2] |
|
| [3] |
|
| [4] |
|
| [5] |
|
| [6] |
|
| [7] |
|
| [8] |
|
| [9] |
|
| [10] |
|
| [11] |
|
| [12] |
|
| [13] |
|
| [14] |
|
| [15] |
|
| [16] |
|
| [17] |
|
| [18] |
|
| [19] |
|
| [20] |
|
| [21] |
|
| [22] |
|
| [23] |
|
| [24] |
|
| [25] |
|
| [26] |
|
| [27] |
|
| [28] |
|
| [29] |
|