Controlled Growth of Pt-Au Alloy Nanowires and Their Performance for Formic Acid Electrooxidation
[Yu Han1 , Yuejun Ouyang2, *  , Zhihui Xie
3 , Jinri Chen1 , Fangfang Chang1 , Gang Yu1, ** ]
, Zhihui Xie]
|
|


Pt-Au alloy nanowires have been controllably electrodeposited on microelectrodes by applying an alternating current and were used as the electrocatalyst for formic acid oxidation. The frequency and voltage of the alternating current and the electrolyte composition were adjusted to precisely control the morphologies, alloying structures and composition. The characteristics of Pt-Au alloy nanowires were analyzed by scanning electron microscopy, X-ray diffraction and transmission electron spectroscopy. Electrocatalytic performance of formic acid oxidation at Pt-Au alloy nanowires electrode was investigated by cyclic voltammetry and chronoamperometry. The results showed that the Pt-Au alloy nanowires possessed highly-crystalline morphologies, the controllable bimetallic composition and single-phase alloy structures, which mainly grow in the <111> crystal orientation. The electrocatalytic activity of formic acid oxidation strongly depended on the bimetallic Pt/Au composition. The Pt35Au65 alloy nanowires displayed superior electrocatalytic performance and high stability toward the electrooxidation of formic acid in acidic solution, owing to the ensemble effect of the Pt and Au components. These findings provided insights into the design of the Pt-Au bimetallic nanomaterials as electrocatalysts for formic acid oxidation.
Direct formic acid fuel cells (DFAFCs) have been studied for decades and considered to be one of the most promising options for the power source in portable electronic devices due to their diverse advantages, such as high energy density and fast oxidation kinetics. Formic acid has lower crossover flux through Nafion than methanol, allowing the use of higher fuel concentrations and thinner membranes[1, 2]. In addition, the toxicity of methanol is still an issue of direct methanol fuel cells (DMFCs) for commercialization[3]. Inversely, formic acid is a liquid substance at room temperature as well as a kind of safe food additive[4]. The outstanding electrocatalytic activity of platinum in the formic acid oxidation reaction makes it desirable as DMFCs electrode materials[5]. One of the major limitations for commercialization of this technology is that pure Pt is easily poisoned by reaction intermediates, such as CO[6]. Pt-based alloy catalysts typically display enhanced catalytic activity toward formic acid oxidation that has been attributed to the so-called bifunctional, ensemble[7] and/or electronic effects[8]. Pt/Ru[3, 9], Pt/Pd[10], and Pt/Au[11, 12] nanostructures have been reported as the anode catalyst alternatives for DFAFCs. Among them, the Pt-Au electrocatalysts have attracted much attention because of their higher electrocatalytic activity and long-term stability. Choi et al.[4] prepared Pt-Au alloy nanoparticles via a successive chemical reduction process. They investigated its catalytic activity for DFAFCs, presenting higher catalytic activity compared to pure Pt nanoparticles. Lee et al.[13] investigated Pt-Au nanoparticles as an anodic catalyst in the direct liquid fuel cell. The result indicated that Pt-Au nanoparticles exhibited higher activity than that of commercial PtRu. Furthermore, the catalytic performance greatly depended on the morphology and composition of the catalyst material. Among the different morphologies investigated (nanowires such as dendrites[14, 15]), network[16] structures were particularly sought because the relative amount of low-coordinated platinum atoms on their surface was significantly lower than spherical nanoparticles, leading to higher catalytic activity and durability toward the formic acid oxidation[17, 18]. The electrodeposition from an aqueous solution via applying alternating current (AC) sine-shaped signal can obtain desirable Pt-Aualloy nanowires (NWs) with controllable morphology, size andcomposition. Ozturk et al.[19] proposed the concept of directional electrochemical nanowire assembly (DENA) on the basis of the dendritic solidification. Therefore, controlling the morphology, size and composition of Pt-Au alloy NWs can effectively improve the activity and stability toward FA electrooxidation. The resistance of deposited alloy NWs in this article was up to 10 Ω , which led to good electric conductivity and outstanding mechanical property.
Currently, a number of techniques exist for the synthesis of metallic nanowires, including template driven electrodeposition[20], directed growth via chemical vapor deposition[21] and electrochemical deposition in pre-patterned structures[22]. However, such techniques always need a secondary processing or become a time-consuming process, limiting their utility in applications. Directed deposition by AC was a promising one-step, high growth rate approach to producing oriented, single crystal nanowires. In this method, an alternating electric field was applied to a salt solution to induce the crystallization of metallic wires or dendrites with metal bond[23]. Metal ions are reduced into metal nucleus with the help of AC. Metal nuclei are assembled into continuous nanowires with high mechanical strength by electric field force. The ends of nanowires can be electrodeposited to the electrode sides automatically and bridge two electrode sides[24]. Thus, they can be used as anodic electrocatalysts for formic acid oxidation without reconnection before applications.
In our previous work[25], the Pt-Au alloy NWs were fabricated between two gold electrodes by dielectrophoretic growth following a two-step method: the nucleation initiated at a lower frequency followed by a second-step growth at a higher frequency. The alloy nanowires were shown to exhibit electrocatalytic response characteristics for the detection of hydrogen peroxide, exhibiting a high sensitivity, low detection limit, and fast response time. However, few people investigated the formic acid oxidation at the alloy nanowires yet. What's worse, the two-step method has a great impact on the alloy morphology since the time of the nucleation phase is too short to control.
Herein, a one-step electrodeposition was proposed to synthesize the controllable Pt-Au alloy NWs between two gold microelectrodes by applying an AC. During the process, AC parameters were changed to achieve the controllability of the morphology and size of NWs. The composition was mainly tuned by changing the ratio of H2PtCl6 and HAuCl4concentration in the solution. The NWs were synthesized at room temperature for 20 min. This procedure greatly simplified the synthetic process and reduced the cost of preparation.
In the present work, the various composited Pt-Au alloy NWs were synthesized on microelectrodes by applying AC. We tried to understand the influence of Au on Pt-Au alloy nanowires and did a more systematic approach to the effect of Au contents on the electrooxidation of formic acid. We measured electrocatalytic oxidation activity of formic acid on various composited Pt-Au alloy NW catalysts. The activity and stability toward formic acid electrooxidation were investigated by cyclic voltammetry and chronopotentiometry. We tried to explain the electrooxidation mechanism of formic acid and hoped to find a more effective and cheaper catalyst to be applied in DFAFCs.
Gold microelectrodes spaced about 50 µ m were successively polished with 0.05 µ m alumina polishing powder and flannel. After ultrasonic cleaning in ultrapure water (0.078 µ S cm-1, 25 ° C), it was dried under ambient condition. The microelectrodes were immersed in a series of ion concentration ratio electrodeposition solution, namely, the mixtures of 0.2 mmol dm-3 HAuCl4⋅ 6H2O, 0.5 mol dm-3 H3BO3 with 11, or 12, or 13, or 14, or 15 mmol dm-3 H2PtCl6⋅ 6H2O, respectively. All reagents above were purchased from Sinopharm Chemical Reagent Co., Ltd. All chemicals were of analytical grade. All solutions were prepared with ultrapure water. The Pt-Au NWs were fabricated by using a function generator (EE1412) and a power amplifier (Tabor 9250). Pure Ar (99.999%) was insufflated for 15 min to eliminate the oxygen dissolved in the electrolyte before electrochemical deposition. An oscilloscope (ADS1000) timely monitored the change of synthetical signals. When a sharp voltage drop appeared, the self-assembly of NWs was ended. During the electrodeposition process, the solution remained static.
The Pt-Au NWs was carefully rinsed with double distilled water and then dried under ambient condition. A scanning electron microscope (SEM, Model JEOL JSM-5600LV) equipped with an energy-dispersive X-ray analyzer (EDX, Noran Vantage 4105) was used to determine the morphology and composition of the Pt-Au NWs. The composition was determined from the average data of three zones of NWs. The crystal structure of materials was determined by Rigaku 2500 X-ray diffraction (XRD). Cu Kα radiation (wavelength, 0.15405 nm) was used as an incident X-ray source (50 kV, 300 mA). The high-resolution transmission electron microscopy (HRTEM) images were obtained on a JEM-3010 microscope at an accelerating voltage of 300 kV.
The electrocatalytic activity of the NWs electrodes toward formic acid were evaluated by cyclic voltammetry (CV) in solutions of 0.5 mol dm-3 HCOOH+0.5 mol dm-3 H2SO4 at a scan rate of 50 mV s-1 from 0 to 1 V. The chronoamperometry curves (i-t) were measured at a fixed potential (0.3 V) for 3600 s. The electrolyte cell was composed of three electrodes: a Pt-Au NWs electrode as the working electrode, a saturated calomel electrode (SCE) as the reference electrode and a 4 cm2 platinum strip as the auxiliary electrode. The electrodes were scanned in the range from -0.2 to 1.2 V in a 0.5 mol L-1H2SO4 solution for 20 cycles at a scan rate of 100 mV s-1 until a stable curve was obtained to measure electrochemical surface area (ECSA)[26]. All the electrochemical measurements were carried out at room temperature on an electrochemical workstation (Reference 600, American Gamry). The potential values were relative to saturated calomel electrode (SCE) here. Before the experiment, pure Ar (99.999%) was insufflated into the solution for 20 min to purge oxygen dissolved.
3.1.1. Effect of potential on nanowires growth
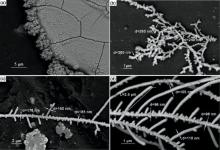
The fabrication of Pt-Au NWs from an aqueous solution via applying AC sine-shaped signal can achieve directional growth at the specified location of a gold microelectrode. The particular crystallographic direction and tip radius of alloy nanowires were controlled by the AC voltage and frequency. We employed the pH ≈ 3 mixed aqueous solution composed of 13 mmol dm-3 H2PtCl6 +0.2 mmol dm-3 HAuCl4 + 0.5 mol dm-3 H3BO3 in the following experiment of deposition. It is assumed that the majority of the platinum ([PtCl6]2-) and gold ([AuCl4]-) complexes in the solution were negatively charged. The growth process in the sine-AC field comprised two phases. In the positive half-wave[27], the negatively charged metal complexes attracted and accumulated around the tips. In the negative half-wave, the complexes were repelled or reduced by contacting negative charge electrons. Reduction only took place for those complexes which were still in close vicinity to the nanowire tips when the reduction potential was reached. Once these atoms were adsorbed to the sides of the wires, adatoms diffuse along (111) direction of the lattice until they find a binding site, or they were desorbed back into the solution. A minimum starting potential was required to satisfy the redox potential. In the deposition cycles, Pt and Au species attach to the sides of the wires to form conductive alloy NWs between the microelectrodes. The growth could not be observed at a low potential (< 4 Vpp, peak to peak). When the potential is 5 Vpp, irregular sedimentary deposits take place along the edges of the electrodes, as shown in Fig. 1(a). When the potential comes to 8 Vpp, as shown in Fig. 1(b), the morphologies of nanowires exhibit ordered accumulation of particles due to the rise of nucleation rate caused by higher potential. Complex or ion reduction rate was higher than the migration rate of the particles remaining in the tip of the nanowires piled into a nanochain structure.
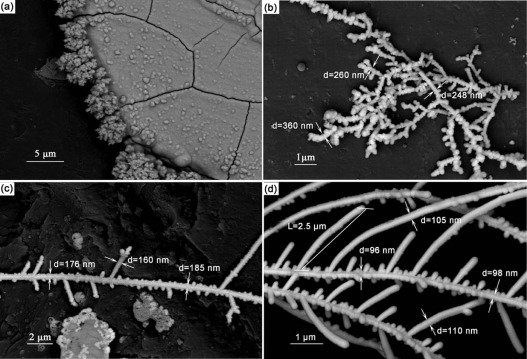 | Fig. 1. SEM images of Pt-Au NWs electrodeposited on gold microelectrodes by various AC sine-shaped signal at 20 MHz: (a) 5 Vpp, (b) 8 Vpp, (c) 12 Vpp, and (d) 16 Vpp. |
The nanowires were successfully assembled in the AC potential range of 8-16 Vpp (fixed 20 MHz frequency). The anisotropy growth of Pt-Au alloy NWs appeared at 12 Vpp as shown in Fig. 1. It took 41 min to form obvious branches in Fig. 1(c). The NWs evolved from the linear to the branched wires with 55° angle, as shown in Fig. 1(d), at the arrival of 16 Vpppotential. The NW branches reached as long as 2 µ m in 20 min. Moreover, the applied potential also modifies the extent of the nanowire branches. It can be implied that the increase in the applied potential leads to higher nucleation density and faster growth rate. The highly branched nanowires were typical products of the diffusion limited process in dendritic solidification[28]. With the increase of the driving force (potential amplitude), the nucleation and growth were accelerated. It was likely to impassion instability on the crystallized interface, and plane cellular structures were formed[29, 30]. Crystals grow into lateral branches in the axial of the instability interface and further develop into dendrites. Simultaneously, the dendrite tip radius becomes much smaller than the dendrite spacing. When the potential exceeded 18 Vpp, the interconnection of NWs was easily burned out and the reaction of hydrogen evolution increased so as to blow off the nanowires. As a result, interconnected wires could not be formed.
3.1.2. Effect of frequency on nanowire growth
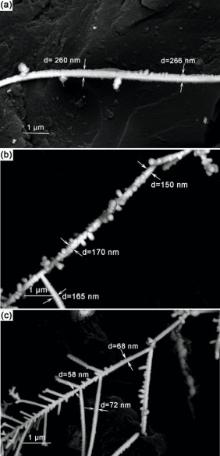
Experiments displayed that rougher nanowires produced at lower frequencies, which can be clarified by the following two points: on the one hand, the lower frequency leads to more double layer voltage drop[31], while the overpotential accelerated nucleation due to the non-shielding effect. On the other hand, the longer attraction phase (positive half-wave) caused a greater accumulation of complexes around the nanowires and provided a longer delay time for the new atoms to form ordered crystalline. In the deposition phase (negative half-wave), more species attached to the sides of the wires because the species had no enough time to leave when the reduction potential was reached. The reaction rate at the tip surface was slower compared to the flux of arriving metal complexes, which resulted in their accumulation at the tip surface (reaction-limited case). However, when the frequency was higher than a critical value, the overpotential was too low to nucleate. The nucleation rate was almost zero and could not get any crystal on the electrode surfaces. A frequency range between 1 MHz and 20 MHz was found to fabricate desirable nanowires by applying an AC sine-shaped signal to the electrodes.
Fig. 2(a-c) displays the SEM images of unbranched and branched Pt-Au alloy NWs, which are fabricated at 1 MHz, 10 MHz, 20 MHz separately and at the fixing potential of 16 Vpp. The magnitude of this increase is similar to that observed when the potential is increased. Besides, the diameters of the NWs decreased from 266 nm at 1 MHz (in Fig. 2(a)) to 68 nm at 20 MHz (in Fig. 2(c)). In dendritic solidification theory, the diameter dw of the grain solidified from the liquid, depending on the following several factors. The equation can be written as[14]:
where D is the diffusion coefficient of the charged particles in the solution and can be calculated from the Stokes-Einstein equation, St is the Stefan-number (a measure of the degree of undercooling of a liquid), and f is the frequency of the applied voltage. In our experiment, it was difficult to get straight and thinner wires with 25 MHz frequency synthesis. Excessive frequency would lead to changepolarization so fast that there was not enough time for the nuclei to migrate and accumulate wires. In order to obtain finer branched nanowires, 20 MHz should be selected to deposit the nanowires.
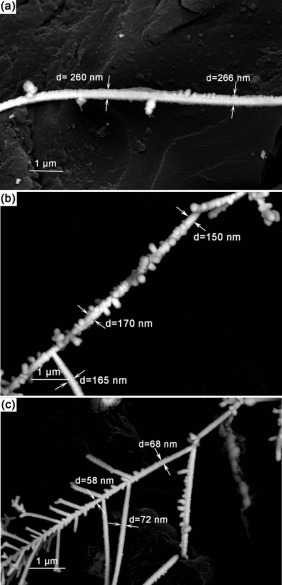 | Fig. 2. SEM images of NWs obtained at 16 Vpp with different frequencies: (a) 1 MHz, (b) 10 MHz, and (c) 20 MHz. |
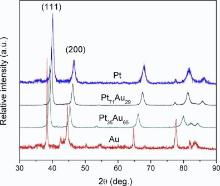
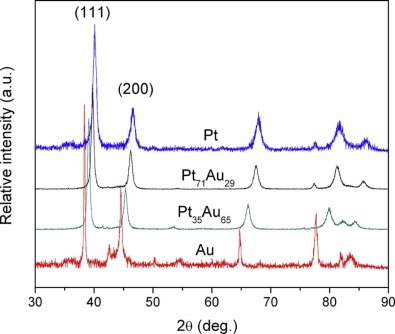
Fig. 3 shows the XRD patterns of pure Pt, Au and Pt71Au29, and Pt35Au65 alloy NWs growing in an AC electric field. The diffraction patterns can unambiguously display a typical face-centered cubic (fcc) structure. It is seen in Fig. 3 that (111), (200) and (220) orientations are observed, while (111) is more visible than others. So the electrodeposited Pt-Au NWs shows a marked tendency to preferential (111) orientation. The (111) and (200) peaks for the Pt-Au NWs are located between the characteristic peaks of Au and Pt[32]. As the proportion of Pt is lowered, the diffraction peaks in the Pt-Au NWs are shifted to lower 2θ values. The 2θ of (111) peaks for Pt71Au29 (39.52° ) and Pt35Au65 (39.20° ) negatively shifts by 0.22° and 0.54° compared with pure Pt (39.74° ), respectively. The main diffraction peak Pt-Au (111) does not split into two peaks, indicating that there is no separate Pt and Au generated. In other words, Pt-Au NWs bear the characteristic of an alloy type compound involving Au and Pt.
 | Fig. 3. Typical XRD patterns of the fabricated Pt71Au29, Pt35Au65 alloy NWs, pure Au and Pt NWs. |
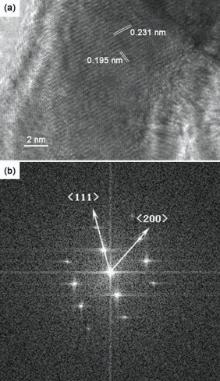
High-resolution TEM (HRTEM) images of Pt-Au NWs are shown in Fig. 4. Fig. 4(a) shows that the d-spacing of adjacent lattice planes is determined to be 0.231 nm, which corresponds to the average value of the (111) planes of fcc Au (0.2355 nm) and Pt (0.2265 nm). The value of the lattice spacing is estimated by ten data using software of digital micrograph. The d-spacing based on FFT image is 0.234 nm which is near 0.231 nm calculated from TEM image. It is in good agreement with d111 value calculated from XRD results. The corresponding fast Fourier Transform (FFT) pattern clearly shows spots index to the < 02
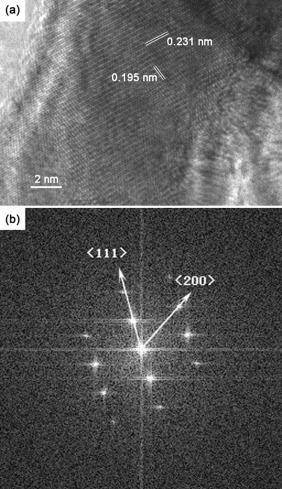 | Fig. 4. HRTEM image (a) and the corresponding FFT pattern (b) of Pt-Au NWs electrodeposited at 20 MHz, 16 Vpp. |
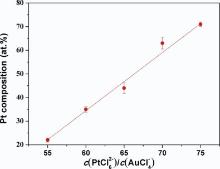
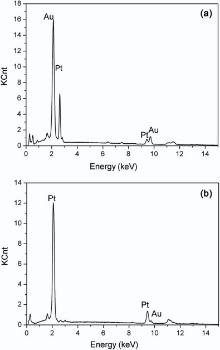
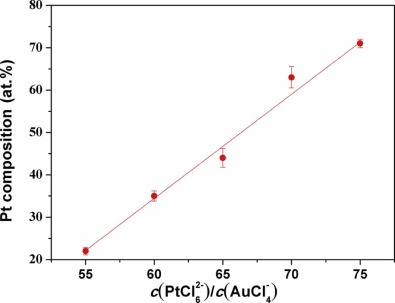
The formation of the bimetallic composition in the Pt-Au alloy NWs was examined under different feeding ratios of the binary components, i.e. the ratio of [PtCl6]2- and [AuCl4]- ions in the electrolyte. The ratios of c(PtCl62-)/c(AuCl4-) in electrolytes and Pt atom (at.%) in electrodeposited Pt-Au alloy NWs are shown in Table 1. Fig. 5 shows the dependence of Pt atom content in the alloy on the concentration rate of c(PtCl62-)/c(AuCl4-) in the electrolytes. To examine the nanowire composition, EDX measurement was then performed. Fig. 6 shows the EDX of two alloy nanowires. The curve exhibits a nearly linear relation for the Pt content in the range of 22-71 at.% in the bimetallic nanowires as the ratios of c(PtCl62-)/c(AuCl4-) increase from 55:1 to 75:1. This result indicates that there is a relatively stronger competition for [AuCl4]- than [PtCl6]2- under the experimental conditions.
| Table 1. Solutions of various ion molar ratios and the Pt content in the Pt-Au alloy NWs |
 | Fig. 5. Dependence of Pt content in the bimetallic Pt-Au alloy NWs on the concentration rate ofc(PtCl62-)/c(AuCl4-) in the electrolytes. |
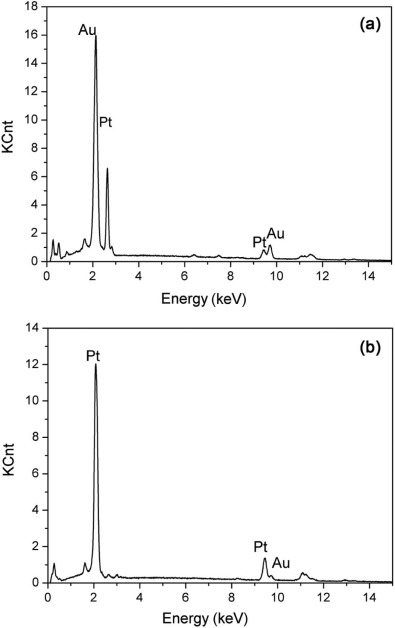 | Fig. 6. EDX spectra of nanowires with 35 at.% (a) and 71 at.% (b) of Pt. |
This finding can be explained by the difference in the reduction potential between [AuCl4]-(+1.00 V) and [PtCl6]2- (+0.68 V), favoring more reduction of Au species. A higher deposition tendency of Au led to a lower Pt content in the deposited NWs. The reduction potentials of [AuCl4]- and [PtCl6]2- are shown in equations (1b), (2b), and (3b)[23]:
According to the Nernst equation, Pt and Au can be reduced simultaneously at one potential, when the concentration ratio of c(PtCl62-)/c(AuCl4-) is 65:1. At this concentration ratio, the experimentally measured Pt content is 44 at.%, which was lower than the theoretical calculation. The c(H2PtCl6) was two orders of magnitude higher than c(HAuCl4), which was believed to have different control mechanisms of the two particles [28, 33]. Chloroauric acid with low concentration was diffusion controlled while chloroplatinic acid tended to be reaction controlled. The diffusion time was shortened at 20 MHz, causing more gold species to remain in the solidifying front and reducing the ratio of platinum complexes around the electrodes. Platinum complexes had fewer reduction opportunities for the fixed electrons.
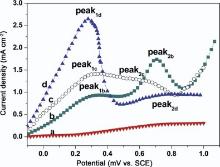
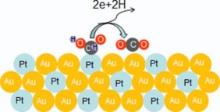
As we know, formic acid oxidation on Pt is considered as a model reaction in organic fuel electrocatalysis[34], because the oxidation of formic acid is a simple surface sensitive process that involves only two electrons. Fig. 7 presents the positive scan CVs of Au NWs, Pt NWs, Pt71Au29 and Pt35Au65 alloy NWs catalysts in a mixed solution of 0.5 mol dm-3HCOOH +0.5 mol dm-3 H2SO4 in the potential range from 0 V to +1.0 V. Current densities in the voltammogram were normalized to ECSA. Both Pt35Au65 and Pt71Au29 alloy NWs were fabricated at 16 Vpp, and 20 MHz and c(PtCl62-)/c(AuCl4-) were 60:1 and 75:1, respectively. The composition of nanowires was determined by EDX. As shown in curve (a) of Fig. 7, pure Au NWs are inactive toward formic acid oxidation under the experimental conditions performed here. Therefore, the measured current densities for formic acid oxidation were normalized by the ECSA of Pt. The typical feature of the formic acid oxidation is observed according to the dual-pathway mechanism [1, 35], as shown inFig. 7. The first peaks (marked as peak1) are related to the oxidation of HCOOH into CO2via the active intermediate (path1) HCOOH→ CO2 + 2H++2e-, while the second peaks (marked as peak2) at the higher potential represented the oxidation process via the poisonous COads intermediate (path 2) HCOOH→ COads + H2O→ CO2 + 2H++2e-. Path 2 is problematic because COads poisoned the Pt surface. The peak1b on Pt in curve (b) ofFig. 7 appears at about 0.3 V with current density of 0.85 mA cm-2. The current density starts to rise from 0.5 V and reaches 1.75 mA cm-2 at 0.7 V (peak2b). The current platform was caused by the COads poisoning of Pt active sites. Then COads were removed with Pt-OHads forming at high potential. Along with the release of Pt, formic acid oxidation current density gradually increased. As HCOOHads on Pt surface reduced, the current density declined. Curves (c and d) of Fig. 7 demonstrate the positive scan curves for the electrooxidation of formic acid at Pt71Au29 and Pt35Au65 alloy NW catalysts with lower onset potential. The peak1c and peak1d current densities are 1.4 mA cm-2 and 2.8 mA cm-2, respectively, which are 1.64 and 3.29 times higher compared with pure Pt. This indicated that the incorporation of Au greatly enhanced the activity of Pt NWs. In the catalyst of Pt35Au65 alloy NWs, the first anodic peak (0.25 VSCE) appeared at more negative potential than that (0.30 VSCE) in carbon-supported Pt-Au alloy nanoparticle catalysts from the reference[36]. It is indicated that Pt35Au65 alloy NWs were more propitious to catalyze the electrooxidation of formic acid. The difference is that there is a wider oxidation peak potential range on Pt71Au29 alloy NWs catalyst from 0.26 V to 0.7 V. The current density at 0.65 V (peak2c) is about 1.2 mA cm-2, only slightly less than 1.4 mA cm-2 at 0.29 V (peak1c). It is revealed that intermediate COads poisoning possibility still existed in Pt71Au29 alloy NWs catalyst. However, Pt35Au65 alloy NWs catalyst for oxidation of formic acid mainly followed direct dehydrogenation pathway, hardly with indirect dehydration pathway. The results of the electrooxidation of formic acid at the studied catalysts are summarized in Table 2. The ratio of j1/j2 in Table 2 is further used to evaluate the poison resistance of Pt-Au alloy NWs with different compositions on formic acid oxidation pathway. The j1/j2 on Pt35Au65 NWs is larger than that on pure Pt NWs, suggesting a stronger poison resistance.
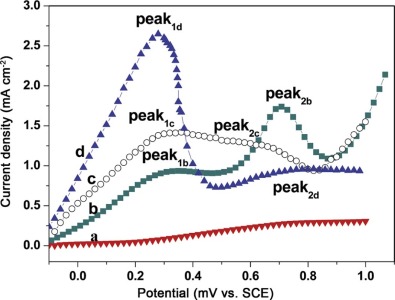 | Fig. 7. Positive scan cyclic voltammograms of formic acid oxidation on the catalysts in 0.5 mol dm-3 HCOOH and 0.5 mol dm-3 H2SO4 solution at 50 mV/s: (a) Au NWs, (b) Pt NWs, (c) Pt71Au29 alloy NWs and (d) Pt35Au65 alloy NWs. |
| Table 2. Peak1 potential (E1), peak1 current density (j1), peak2 potential (E2), peak2 current density (j2), and j1/j2for formic acid oxidation at the Pt, Pt71Au29, Pt35Au65 alloy NW catalysts |
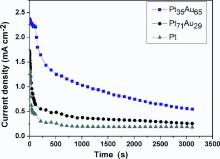
In order to further evaluate the activity and stability of the electrodeposited Pt-Au alloy NW catalysts for formic acid electrooxidation, chronoamperometric (i-t) measurements of Pt, Pt71Au29 and Pt35Au65 NWs in 0.5 mol⋅ dm-3 HCOOH+0.5 mol⋅ dm-3 H2SO4 were performed for 3600 s at 0.3 V (formic acid fuel cell operating potential), as shown in Fig. 8. At the beginning of i-t curves (< 100 s), it can be seen that the current decays very rapidly for all the catalysts. After 300 s, the Pt35Au65 alloy NW catalyst maintains a higher catalytic activity than other catalysts in the chronoamperometry time frame. It is indicated that Pt35Au65 alloy NW was the most active and stable one among them in the formic acid electrooxidation.
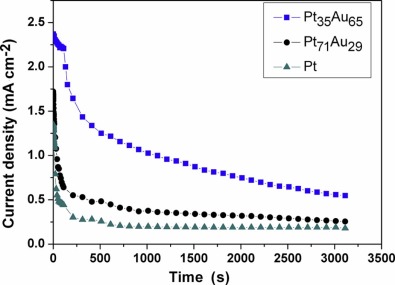 | Fig. 8. Chronoamperometric curves at 0.3 VSCE in 0.5 mol dm-3 HCOOH and 0.5 mol dm-3 H2SO4 on the electrodeposited Pt, Pt71Au29 and Pt35Au65 alloy NWs. |
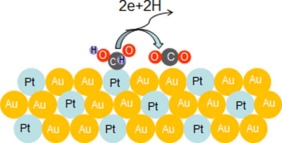
Fig. 9 illustrates the proposed reaction pathway for the conversion of formic acid to CO2 by a Pt35Au65 alloy NW catalyst. The improvement of electrocatalytic activity with the presence of Au can be explained with the ensemble effect[4]. Cuesta et al.[37] showed that the dehydration of formic acid to COads requires at least three adjacent Pt atoms, whereas the dehydrogenation path requires at most two Pt atoms. Pt embedding in the crystal lattice of Au resulted in the increase of the Pt-Pt lattice spacing with hardly adjacent Pt atom existence. Platinum atoms can be effectively dispersed by gold atoms, preventing CO adsorbing on active sites of Pt. The probability of the direct dehydrogenation to CO2 was increased. Besides, its presence on the surface weakened the bond between Pt and COads. Recent density functional theory (DFT) calculations indicated the d-band shift for Pt in a Pt-Au surface because of higher electronegativity of Au than Pt, which was also in fact supported by high-resolution XPS data [38, 39]. In addition, the alloy property of Pt and Au resulted in a tensile strain because of the larger lattice constant of Au than that of Pt.
 | Fig. 9. Schematic illustration of the electrocatalytic oxidation of formic acid on the Pt35Au65 alloy NWs. |
In the case of different nanomaterials, nanowires had broad application prospects, due to the aspect ratio and significant nonlinear and quantum effects. Compared with the nanoparticles, metal atoms were attached by metal bond tightly in nanowires[40], which made a better electrical connection and remained stable in an acidic electrolyte solution without decomposition. Hence, durability of the catalysts was improved. Regularly arranged nanowires also made the flow of formic acid molecules on the catalyst surface smooth, which enhanced the electrooxidation rate.
In conclusion, Pt-Au alloy NW has been electrodeposited on microelectrodes by applying an AC. It can be used as an anode electrocatalyst for formic acid electrooxidation directly. The alloy NWs possessed high electron transfer efficiency and excellent electrical connection performance. Sine-shaped AC signal and concentration ratios have been changed to prepare nanoscale Pt-Au alloys with controllable morphologies and composition with a length of 50 µ m. The Pt35Au65 alloy NWs had superior electrocatalytic activity, showing a lower onset potential and larger current density. The presence of Au can improve electrocatalytic activity by reducing the adsorption of CO due to ensemble effect without adjacent Pt atoms. Formic acid oxidation with the alloy NW catalyst inclined to the direct dehydrogenation and reduced the possibility of poisoning. The novel Pt-Au alloy NWs may serve as efficient anodic catalysts in DFAFCs.
This research was supported by the National Natural Science Foundation of China (No.51271074), and the Key Project of Hunan provincial Education Department of China(No.15A146).
The authors have declared that no competing interests exist.
| [1] |
|
| [2] |
|
| [3] |
|
| [4] |
|
| [5] |
|
| [6] |
|
| [7] |
|
| [8] |
|
| [9] |
|
| [10] |
|
| [11] |
|
| [12] |
|
| [13] |
|
| [14] |
|
| [15] |
|
| [16] |
|
| [17] |
|
| [18] |
|
| [19] |
|
| [20] |
|
| [21] |
|
| [22] |
|
| [23] |
|
| [24] |
|
| [25] |
|
| [26] |
|
| [27] |
|
| [28] |
|
| [29] |
|
| [30] |
|
| [31] |
|
| [32] |
|
| [33] |
|
| [34] |
|
| [35] |
|
| [36] |
|
| [37] |
|
| [38] |
|
| [39] |
|
| [40] |
|