


Synthesis, Characterization and Gas Sensing Properties of Graphene Oxide-Multiwalled Carbon Nanotube Composite
[T. Kavinkumar, S. Manivannan*  ]
]
]
|
|


Graphene oxide (GO)-multiwalled carbon nanotube (MWCNT) composite was synthesized and characterized by X-ray diffraction, atomic force microscopy, scanning electron microscopy, micro Raman, Fourier transform infrared and ultraviolet-visible near infrared spectroscopy techniques. Spectral characteristics of cladding modified fiber optic gas sensors were studied for various concentrations of ammonia, ethanol and methanol at 27 °C. Thickness of the gas sensing layer was controlled by varying the concentration of composite in ethanol medium (0.5 and 1 mg/mL) for three times dipping process. The 0.5 mg/mL concentrated GO-MWCNT coated sensor showed 1.20, 1.40 and 1.15 times higher sensitivity than the GO coated sensor for ammonia, ethanol and methanol vapors, respectively. Furthermore, it exhibited 1.50, 1.80 and 1.80 times better sensitivity than 1 mg/mL concentrated GO-MWCNT coated sensor for ammonia, ethanol and methanol vapors, respectively. The presence of functional groups in GO increased the sensitivity. This is mainly attributed to the effective electron charge transfer between the composite materials and analytes.
Sensing of toxic gases such as ammonia, ethanol and methanol in the atmosphere is an active area of research due to its wide use in human safety, agricultural and industrial activities[1, 2]. Therefore, it is important to develop inexpensive, low power and highly sensitive sensors to monitor toxic gas concentration in the environment. Carbon nanomaterials are suitable candidates for electrochemical and gas sensing applications due to their high surface to volume ratio, high carrier mobility and large gas adsorption capability[3, 4, 5, 6, 7, 8, 9, 10]. These characteristics can lead to small size novel sensors over metal oxide based sensors at room temperature. In particular, multiwalled carbon nanotubes (MWCNT) are promising materials because of their excellent electrical, mechanical and optical properties. The outermost layer of MWCNT governs the electronic properties and is chemically very active[11]. MWCNT have raised expectations as novel sensing materials since their discovery by Iijima in 1991 due to their large surface area to volume ratio and nanoscale structure. The sensitivity of pristine MWCNT sensor is poorer than functionalized MWCNT[12]. Drawback of the functionalization is adding strong acids, such as nitric and sulfuric acids those will damage the MWCNT structure. Furthermore, the covalent functionalization of MWCNT structure and its unique properties are changed after functionalization.
On the other hand, graphene oxide (GO) has been suggested as a new nano-combination with MWCNT to improve the gas sensing performance due to their large surface to volume ratio. GO consists of oxygenated functional groups, such as carboxyl, hydroxyl and epoxy, which are attached on basal plane and edges of the graphene sheets[13]. GO has the more and less amount of sp3 and sp2 hybridized carbon atoms, respectively. It has attracted great attention due to its unique mechanical, chemical and optical properties. The oxygen functional groups offer more active sites for the interaction with other complexes [14, 15]. Presence of oxygen functional groups in GO could adsorb the MWCNT through π -stacking interaction, thus MWCNT provide the stable dispersion in aqueous media. GO-MWCNT composites exhibit much attention for gas sensing because of their great advantages of low cost fabrication and bulk quantity production. The assembled composite combines advantages of the two materials and shows unique synergistic properties by surface modification. GO-MWCNT composites have been paid tremendous concerns owing to their gas sensing properties originated from the GO.
Among the various sensors, fiber optic sensors are greatly attractive because of their advantages such as light weight, small size and high sensitivity over conventional electrical based sensors[16]. The gas sensing mechanism is generally based on adsorption/desorption of gas molecules on surface of the sensing material, which leads to change in refractive index of cladding[17, 18]. In our previous study, sensing performance of GO and reduced GO (rGO) were reported at 27 ° C toward ammonia, ethanol and methanol vapors[19]. Existence of various oxygen functional groups developed the better sensitivity of GO than that of rGO sensor. Nevertheless, GO coated sensor exhibited poor stability and decelerated the response of the sensor. Hence, GO coated sensor required certain improvements. It is performed by adding MWCNT with GO, which improves the sensitivity of the sensor. It is very important to explore the GO-MWCNT composite sensor instead of GO and MWCNT sensors to achieve a low cost and high sensitive device fabrication. The present study aims to combine the one-dimensional MWCNT and two-dimensional GO to prepare a GO-MWCNT composite using sonication process. For the first time, ethanol, methanol and ammonia vapor sensing properties of GO-MWCNT composite coated fiber are carried out, and the results are presented.
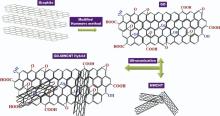
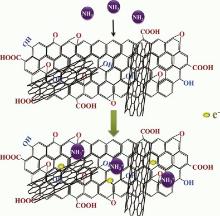
GO was synthesized using modified Hummers' method[20]. The GO-MWCNT composite was synthesized through sonication process[21]. The formation route to GO-MWCNT composite is schematically illustrated in Fig. 1. The synthesized materials were confirmed by powder X-ray diffraction (XRD, RigakuUltima III, CuKα 1 radiation (0.15406 nm)), Fourier-transform infrared (FTIR, Nicolet IS5) and ultraviolet-visible near infrared (UV-Vis-NIR, JASCO-V-670) techniques. The microstructure was obtained using micro Raman (Horiba JobinYvonLabRam) with an excitation wavelength of 514.5 nm laser beam. The morphology of GO-MWCNT composite was studied using a field emission scanning electron microscope (FE-SEM, Quanta 250 FEG, FEI). The topological characteristics of the composite was observed by atomic force microscopy (AFM, Park Systems NX10) operated in non-contact mode. Thermogravimetric analyses (TGA) was carried out in the temperature range of 30-750 ° C at the heating rate of 20 ° C min-1 under N2 atmosphere (SIINT, EXSTAR 6200).
 | Fig. 1. Schematic diagram for the preparation route of GO-MWCNT composite structure. |
A multimode step index poly-methyl methacrylate (PMMA) fiber cladding region was removed over 3 cm long at the center of 42 cm long fiber using mechanical cleaving method. Dip coating was adopted for 30 s dipping followed by 30 s drying and repeated for three times. GO-MWCNT composite was mixed with ethanol and is coated over the cladding removed portion of the fiber through dip coating technique. The GO-MWCNT coated fiber was then used as a sensor. Coating thickness was increased by increasing the concentration of the sensing material (0.5 mg mL-1, 1 mg mL-1) in ethanol for 3 times dip coating. The prepared fiber optic gas sensor was inserted into the gas-sensing chamber and the schematic diagram has been reported previously[19]. Ammonia, ethanol and methanol vapors prepared at different concentrations (0-500 ppm) were allowed separately to pass into the gas-sensing chamber through a gas inlet with the help of a regulator. After 10 min of passing the vapor, variation of output light intensity was continuously measured for each concentration. All the measurements were made at 27 ° C. Gas sensing properties were measured with white light source (100-2000 nm, Model: SL1, Steller Net Inc., USA) and a miniature fiber optic spectrometer (200-1000 nm, Model: EPP-2000, Stellar Net Inc., USA). A signal in the form of light observed using the spectrometer was interfaced with a computer, and the spectral response of the fiber was recorded independently for each vapor.
GO exhibited an intense diffraction pattern at 9.5° and a weak pattern at 42° originated from the (002) and (100) (Fig. 2) respectively. The interlayer spacing was calculated as 0.930 nm. It arises due to the intercalation of water molecules and attachment of oxygen functional groups between the layers of graphite. The strong diffraction pattern observed at 25.8° corresponds to the graphitic-layered structure of MWCNT with an interlayer spacing of 0.342 nm, which is relatively smaller than that of GO. The powder XRD pattern of GO-MWCNT composite displays the combined structures of both GO nanosheets and MWCNT, indicating the formation of GO-MWCNT composite. Major diffraction patterns of GO and MWCNT were shifted slightly to higher angle in the composite as ultrasonication reduces and exfoliates the GO sheets in the mixture.
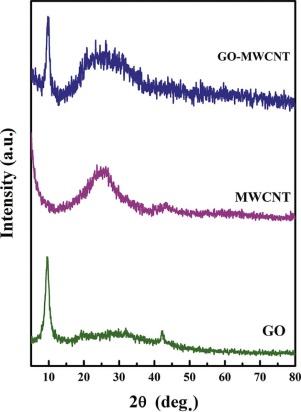 | Fig. 2. Powder XRD patterns of GO, MWCNT and GO-MWCNT composites. |
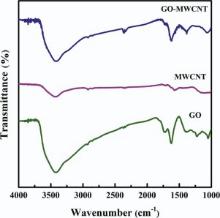
GO shows the absorption peaks at 3420, 1226 and 1052 cm-1 which are attributed to O-H, C-O (epoxy) and C-O (alkoxy) stretching vibrations, respectively (Fig. 3). The absorption peaks at 1727 and 1624 cm-1 show the formation of C=O and C=C, respectively, which are intrinsic characteristics of the GO. This represents the different functional groups existing on edges and basal planes of the GO nanosheets. Pristine MWCNT exhibits major absorption peaks at 3422 cm-1 and 1580 cm-1 due to O-H stretching vibrations of adsorbed water and aromatic C=C, respectively. GO-MWCNT composite shows the absorption peaks at 3420 and 1724 cm-1 arising from the O-H and C=O groups, respectively. The diminution of hydroxyl group for composite indicates the presence of O-H groups but in lower proportion. Furthermore, these oxygen functional groups are originated from GO sheets after the incorporation of MWCNT in the GO. This confirms the existence of GO sheets in the GO-MWCNT composite.
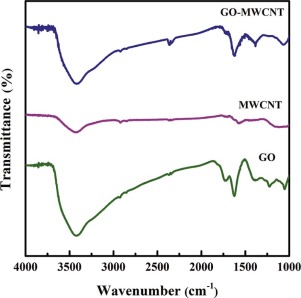 | Fig. 3. FTIR spectra of GO, MWCNT and GO-MWCNT composite. |
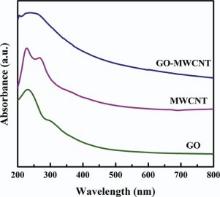
GO exhibits a major absorption peak at 230 nm due to π -π * transition of aromatic C-C and small shoulder peak at about 300 nm is due to n-π * transition of C=O in sp3 hybrid regions (Fig. 4). Pristine MWCNT showed significant peaks at 227 and 270 nm. After the dispersion of MWCNT in GO dispersed aqueous medium and repeated centrifugation process, the shoulder peak of GO at about 300 nm disappeared and major absorption peak at 230 nm is shifted to 248 nm. This indicates the presence of π -π * transition in GO after its incorporation with MWCNT to form GO-MWCNT composite via π -π interaction. This interaction essentially originated between the hydrophobic sp2 hybridized regions of GO nanosheets and the outer surface of the MWCNT[22].
 | Fig. 4. UV-Vis-NIR absorption spectra of GO, MWCNT and GO-MWCNT composites dispersed in ethanol. |
Fig. 5 shows the recorded TGA of GO, MWCNT and GO-MWCNT composites. In GO, the major weight loss was observed between 100 and 200 ° C, indicating the release of O-H, CO and CO2 from the most labile functional groups. At 750 ° C, the total weight loss was measured about 70% for GO. The weight loss about 3% was observed in pristine MWCNT from room temperature to 600 ° C. There are three major weight losses observed for GO-MWCNT composite. Weight loss about 8% was observed at 110 ° C for composite and is assigned to water evaporation which is lesser than the weight loss of GO (20%). The second step degradation about 28% at 220 ° C is associated with loss of labile oxygen functional groups. This is much lower than that of GO (50%), indicating a successful attachment of MWCNT in the mixer. Interestingly, the GO-MWCNT composite exhibited higher thermal stability than GO, which is originated from MWCNT. TGA also proved that more oxygen functional groups are still present in the composite. Decomposition of COOH group resulted to the weight loss of about 600 ° C.
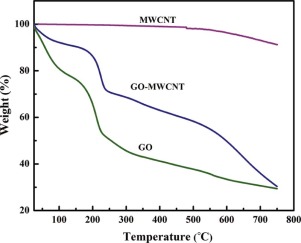 | Fig. 5. TGA of GO, MWCNT and GO-MWCNT composite in N2 atmosphere. |
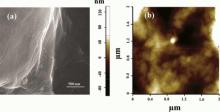
The network of MWCNT are homogeneously distributed on the surface of GO nanosheets, implying that the GO and MWCNT are evenly mixed together (Fig. 6(a)). The strong bonds have been formed through π -π interactions and van der Waals forces when the MWCNT was deposited on top of the GO layer. This is due to the amphiphilic nature of both the GO and MWCNT surfaces[23]. The presence of hydrophilic functionalities in GO created well dispersed GO-MWCNT composite in water. AFM image reveals that the MWCNT are randomly embedded over GO wrinkles and is clearly seen on the surface (Fig. 6(b)).
 | Fig. 6. (a) Typical FESEM image of surface of GO-MWCNT composite, (b) AFM image of GO-MWCNT composite showing the distribution of MWCNT. |
The significant vibration modes in Raman spectra such as D and G bands were monitored between 1100 to 1700 cm-1 for all the three samples (Fig. 7). The Raman spectrum of pristine MWCNT displayed a high intense G band and is located at 1583 cm-1. This is due to in-plane vibration of aromatic carbon and is attributed to first-order scattering of E2gphonon vibration mode symmetry. Additional low intense D band at 1343 cm-1 associated with disordered structural defects arising from a breathing mode of κ -point phonons of A1gsymmetry is observed[24]. The Raman spectrum of GO exhibited two intense peaks at 1355 and 1594 cm-1 corresponding to the D and G bands, respectively. After mixing with MWCNT, the G and D bands of GO are shifted to 1586 and 1350 cm-1, respectively, indicating the presence of majority of sp2 domain in composite. The intensity of D band is related to size of in-plane sp2 domains. The degree of crystallization or surface defects density of materials was calculated by measuring the intensity ratio of D and G bands (ID/IG) and is listed in Table 1. The ID/IG ratio of MWCNT (0.81) is lower than the GO (1.00) representing the less disordered structure in MWCNT. After the addition of MWCNT onto GO, the intensity ratio was increased to 0.91 due to the attachment of oxygen functional groups on the surface of pristine MWCNT. The increase in ID/IG ratio of composite compared to that of MWCNT suggested the increase of surface defects in composite structure.
 | Fig. 7. Raman spectra of GO, MWCNT and GO-MWCNT composites. |
| Table 1. ID/IG ratio of GO, MWCNT and GO-MWCNT composites |
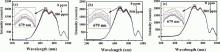
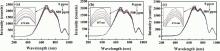
Herein, the intensity variation against vapor concentration in the range 0-500 ppm is plotted for both 1 and 0.5 mg/mL concentrated GO-MWCNT coated fibers. The spectral characteristics of 1 mg/mL concentrated GO-MWCNT coated sensor (sensor A) exposing to various concentrations of ammonia, ethanol and methanol vapors are given in Fig. 8. The characteristic spectra of optical fiber show three peaks around 679, 760 and 936 nm. However, large output intensity variation was observed at 679 nm for ammonia, ethanol and methanol vapors compared to other wavelengths, and hence the sensitivity was calculated at this wavelength. Similar characteristic spectra were monitored for 0.5 mg/mL concentrated GO-MWCNT coated sensor (sensor B) for ammonia, ethanol and methanol vapors, respectively. The maximum output intensity variation for the sensor B was observed at 672, 667 and 676 nm for ammonia, ethanol and methanol vapors, respectively, and is given in Fig. 9. The output light intensity decreases (from the reference intensity) with increasing vapor concentration for all the three vapors. The downward arrows marked inFig. 8 and Fig. 9 indicate the decrease in output light intensity with increasing vapor concentration.
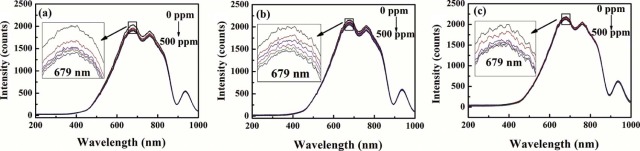 | Fig. 8. Spectral response of sensor A exposed to (a) ammonia, (b) ethanol and (c) methanol vapors. |
 | Fig. 9. Spectral response of sensor B exposed to (a) ammonia, (b) ethanol and (c) methanol vapors. |
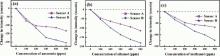
Initially, GO-MWCNT coated fibers were exposed to the water vapor to find out the interference of water vapor in the sensing performance. No change in output light intensity was observed during the exposure. The GO-MWCNT coated fibers were then tested in air atmosphere in the absence of test vapors. No change in output intensity was noticed and that output intensity was taken as reference intensity (reference or zero intensity mentioned in dotted line in Fig. 10) for sensing.
 | Fig. 10. Plot depicting change in output light intensity versus vapor concentration (0-500 ppm) of (a) ammonia (b) ethanol and (c) methanol in sensors A and B. |
Sensitivity graphs were plotted between change in output intensity of the sensors and test vapors concentration and are shown in Fig. 10. Here, the sensitivity is defined as the ratio of change in output intensity (counts) to the change in concentration of the test vapors (ppm). Thus, the sensitivity of sensor A was measured as -0.27, -0.20 and -0.128 counts/ppm for ammonia, ethanol and methanol vapors, respectively. For sensor B, it is calculated as -0.41, -0.36 and -0.23 for ammonia, ethanol and methanol vapors, respectively. Sensitivity is calculated using slope of curve (linear fit) drawn between the sensor response (i.e. change in output intensity from the reference intensity) and vapor concentration. The negative sign in the sensitivity indicates decrease in spectral intensity while concentration of the vapor increases. Sensor B showed better response toward test vapors compared to sensor A at 27 ° C. This is due to enhanced surface to volume ratio and presence of active sites in sensing material. At larger thickness, the presence of gas molecules did not interrupt much on the refractive index of the modified cladding layer resulting to minimum changes in output light intensity. Sensor B showed 1.20, 1.40 and 1.15 times higher sensitivity than the previously reported GO coated sensor for ammonia, ethanol and methanol vapors, respectively[19]. It was 1.50, 1.80 and 1.80 times better sensitivity than sensor A for ammonia, ethanol and methanol vapors, respectively. The sensing performances of sensors A and B are also compared with similar fiber optic sensors reported recently (Table 2). The stability of GO-MWCNT composite sensor was tested by performing the same experiment after two months. No remarkable change in the sensitivity was noticed for all the three vapors in the concentration range 0-500 ppm, suggesting that the sensor is stable in the atmospheric condition.
| Table 2. Comparison of sensing performance of various materials toward ammonia, ethanol and methanol vapors using fiber optic sensor at 27 ° C |
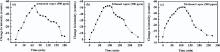
Fig. 11 and Fig. 12 show the real time responses of sensors A and B for all the three vapors at 27 ° C, respectively. The response time (time taken to attain the maximum intensity/saturation at the given concentration) and recovery time (time taken to fall from the maximum intensity to the minimum level) of sensors A and B are also studied. In the case of sensor A, response/recovery times for ammonia, ethanol and methanol vapors are found to be 60/90, 70/90 and 80/80 min, respectively, for 500 ppm vapor concentration. Similarly, the response/recovery times for sensor B are observed as 70/70, 60/80 and 80/70 min for ammonia, ethanol and methanol vapors, respectively. The response and recovery times are quite longer for all the three vapors. This is due to the vapors produced from the solutions passed into the gas sensing chamber without any carrier gas. Similar observations have been made in fiber optic sensors reported recently[27, 29].
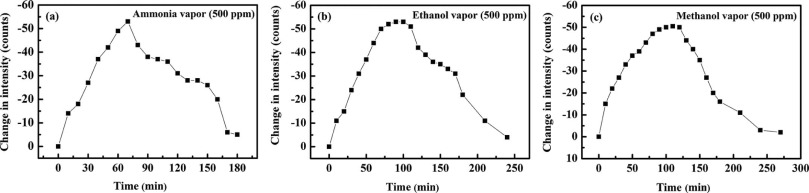 | Fig. 11. Time response curve of sensor A for (a) ammonia, (b) ethanol and (c) methanol vapors at the maximum response wavelength for 500 ppm concentration. |
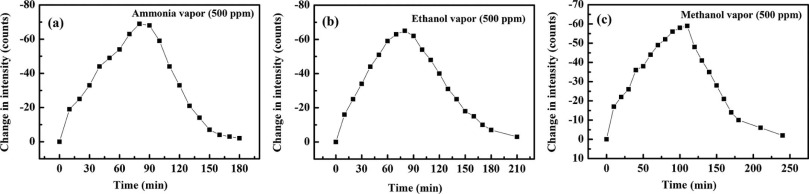 | Fig. 12. Time response curve of sensor B for (a) ammonia, (b) ethanol and (c) methanol vapors at the maximum response wavelength for 500 ppm concentration. |
Variation of output light intensity arises due to physical adsorption of gas molecules on the surface of sensing materials[29, 30]. The refractive index of GO-MWCNT composite was controlled by the presence of oxygen functional groups in GO through the interaction with analytes. The structure of GO and its functional groups play an important role in the adsorption of tested vapors. The schematic diagram illustrating the gas sensing mechanism of GO-MWCNT composite is shown in Fig. 13. In the case of ammonia sensing, gas molecules are initially adsorbed (physical adsorption) on the surface of the GO-MWCNT composite during the interaction. The adsorbed ammonia is donating electron to the composite leading to increase in charge density on the surface of composite which in turn change the complex refractive index of the modified cladding[29]. Thus, the π -π interaction between MWCNT and GO accelerates the effective detection of gases through the change in refractive index of the composite nanostructure in the modified cladding. The existence of GO in composite leads to offer more active sites such as defects, oxygen functional groups for the adsorption of tested vapors and increases the sensitivity compared to the pure MWCNT[19]. This is directly related to the number of ammonia molecules adsorbed on the sensor surface which changes the optical properties of the modified cladding. Thus, the evanescent wave absorption occurred at the modified cladding-air interface during the interaction of ammonia with GO-MWCNT composite. Here, the magnitude of adsorption was higher than that in the pure air environment. Poorer sensitivities were observed for alcohol vapors compared to ammonia. Poorer electronegativity nature of the alcohol vapors than that of ammonia decreased the charge concentration of the composite, which limits the sensitivity.
 | Fig. 13. Schematic representation of ammonia sensing mechanism at surface of GO-MWCNT composite. |
Stable GO-MWCNT composite was successfully synthesized through sonication method. The structural changes and interlayer spacing of GO, MWCNT and GO-MWCNT composite were investigated using XRD technique by measuring the position of the diffraction patterns. Existence of various oxygen functional groups in GO and GO-MWCNT composite was confirmed by FTIR spectroscopy. AFM and FE-SEM studies witnessed the uniform distribution of MWCNT on the surface of GO. The establishment of π -π interaction between GO and MWCNT was proven by UV-Vis-NIR spectroscopy. Highly sensitive GO-MWCNT composite fiber optic sensor toward ammonia, ethanol and methanol vapors at room temperature was fabricated. Sensor B showed 1.20, 1.40 and 1.15 times higher sensitivities than the GO coated fiber optic sensor for ammonia, ethanol and methanol vapors, respectively. Meantime, sensor B exhibits 1.50, 1.80 and 1.80 times better sensitivity than sensor A for ammonia, ethanol and methanol vapors, respectively. These results indicate that the new composite nanostructure is scientifically interesting and has a great potential use in sensors and nanoelectronic applications.
The authors thank Prof. D. Sastikumar, Department of Physics, NITT for extending the fiber optic sensor facilities.
The authors have declared that no competing interests exist.
| [1] |
|
| [2] |
|
| [3] |
|
| [4] |
|
| [5] |
|
| [6] |
|
| [7] |
|
| [8] |
|
| [9] |
|
| [10] |
|
| [11] |
|
| [12] |
|
| [13] |
|
| [14] |
|
| [15] |
|
| [16] |
|
| [17] |
|
| [18] |
|
| [19] |
|
| [20] |
|
| [21] |
|
| [22] |
|
| [23] |
|
| [24] |
|
| [25] |
|
| [26] |
|
| [27] |
|
| [28] |
|
| [29] |
|
| [30] |
|