Hyunsik Bang, Ke Ma, Kai Wei, Chang-Yong Kang, Byoung-Suhk Kim, Mayakrishnan Gopiraman, Jung Soon Lee, Ick-Soo Kim. A Simple Method for the Fabrication of Metallic Copper Nanospheres-Decorated Cellulose Nanofiber Composite. Journal of Materials Science & Technology, 2016, 32(7): 605-610
Permissions
Copyright reserved, Editorial board of Journal of Materials Science & Technology
Received:2015-09-11
A Simple Method for the Fabrication of Metallic Copper Nanospheres-Decorated Cellulose Nanofiber Composite
Hyunsik Bang1, Ke Ma1, Kai Wei2, Chang-Yong Kang3, Byoung-Suhk Kim4, Mayakrishnan Gopiraman1, Jung Soon Lee5,*, Ick-Soo Kim1,**
1 Nano Fusion Technology Research Group, Division of Frontier Fibers, Institute for Fiber Engineering (IFES), Interdisciplinary Cluster for Cutting Edge Research (ICCER), Shinshu University, Tokida 3-15-1, Ueda, Nagano 386 8567, Japan
2 College of Textile and Clothing Engineering, Soochow University, Suzhou 215021, China
3 Department of Metallurgical Engineering, Pukyong National University, Busan 608 739, Republic of Korea
4 Department of Organic Materials & Fiber Engineering, Chonbuk National University, 567 Baekje-daero, Deokjin-gu, Jeonju-si, Jellabuk-do 561-756, Republic of Korea
5 Department of Clothing & Textiles, College of Human Ecology, Chungnam National University, 99 Daehak-ro, Yusung-gu, Daejeon, 305-764, Republic of Korea
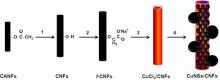
Herein, we report a new and simple method for the preparation of metallic copper nanospheres-decorated cellulose nanofiber composite (CuNSs/CNFs). Initially, the cellulose acetate nanofibers (CANFs) were electrospun followed by deacetylation and anionization to produce functional anionic cellulose nanofibers ( f-CNFs). The CuCl2precursor was deposited on the f-CNFs (CuCl2/CNFs) by a simple dipping method. Then the CuCl2/CNFs were reduced under vacuum by using aluminum foil to produce the CuNSs/CNFs. The resultant CuNSs/CNFs composite was characterized by various microscopic and spectroscopic methods. Fourier transform infrared spectroscopy (FT-IR) confirmed the successful functionalization of anionic groups with the CNFs. The field emission scanning electron microscopy (FE-SEM) and transmission electron microscope (TEM) results confirmed the formation of CuNSs on the surface of CNFs. From the scanning electron microscopy-energy dispersive spectroscopy (SEM-EDS) analysis, the weight percentage of Cu was found to be 23.5 wt%. The successful reduction of CuO to metallic Cu was confirmed by X-ray photoemission spectroscopy (XPS) and X-ray diffraction (XRD) analyses. Mechanism has been proposed for the formation of metallic Cu sphere on CNFs.
Metal nanoarchitectures such as nanospheres[1], nanocubes[2], nanorods[3], nanoflowers[4]and nanoflakes[5] have recently received immense attention in nanotechnology due to their various physicochemical properties, such as large specific surface area and unique structures. Among them, copper nanospheres (CuNSs) have also gained considerable attention due to their attractive optical, catalytic, mechanical and electrical properties[1]. The CuNSs have demonstrated an efficient role in various applications, such as energy[6], biomedical[7], sensors[8] and catalysis[9]. Particularly, due to simple process, recovery and reusability, supported-CuNSs are often preferable materials for several industrial applications[10]. In addition, due to strong interaction between metal nanostructures (MNSs) and supports, the supported-MNSs are highly versatile andoften exhibit unique properties compared to unsupported MNSs[11, 12]. Silica, alumina, carbon materials, metal oxides and polymers are the most well-known supports for the active CuNSs. To date, several supported-MNSs including copper nanospheres (CuNSs) have been reported[13]. In our recent investigation, we prepared various MNSs-decorated carbon nanofiber composites and found that the composites are highly efficient for catalytic organic transformations[14, 15].
Recently, the development of various electrospun nanofibers (NFs), including cellulose nanofibers (CNFs) and their composites, has significantly attracted much attention because of their unique properties, such as large surface area to volume ratio, biocompatibility, flexibility in surface functionalities, easy-handling and outstanding mechanical properties[16, 17, 18]. Particularly, the surface modification of cellulose nanofibers with various functional groups is simple and unique[19]. Several MNSs-immobilized CNFs composites have been developed to date[20, 21]. The most common methods for the deposition of MNSs are metal deposition[23], chemical reduction[24] and in-situ deposition[25]. Recently, Fang et al.[24] prepared AuNPs-immobilized electrospunpolyethyleneimine (PEI)/polyvinyl alcohol (PVA) nanofibers by chemical reduction methodusing NaBH4 as a reducing agent. Eroglu et al.[26] prepared PdNPs-immobilized chitosan NFs by using photosynthetic method. They found that the prepared composite is highly efficient for Mizoroki-Heck cross-coupling reaction. However, for the direct reduction of metal salts (particularly metal chlorides) to metallic nanostructures, several factors such as solvent, concentration of metal precursor, reducing agent, time and temperature need to be controlled very carefully. Herein, we report a new and very simple method for the fabrication of CuNSs/CNFs composite.
2. Materials and Methods
2.1. Materials
Cellulose acetate (CA, 39.8% acetyl content having average Mw = 30 kDa), N, N-dimethylformamide (DMF) and acetone were purchased from Sigma Aldrich. Copper chloride (CuCl2), sodium hydroxide (NaOH), and sodium chloroacetate (ClCH2COONa) were obtained from Wako Pure Chemicals, Japan. Aluminum foil was purchased from SumikeiAlumiHaku Co. Ltd., Japan. All the other chemicals were purchased either from Sigma-Aldrich or Wako Pure Chemicals and used as received.
2.2. Preparation of cellulose acetate nanofibers (CANFs)
The CANFs were prepared according to our previously reported procedure[27]. In a typical experiment, 18 wt% of CA solution was prepared by addition of 3.6 g of CA in 20 mL of acetone/DMF mixture (3:2 ratio). A high-voltage power supply (Har-100* 12, Matsusada Co., Tokyo), capable of generating voltages up to 100 kV, was used as a source of the electric field to produce the electrospun CANFs. The above obtained 18 wt% CA solution was poured in a 5 mL plastic syringe attached to a capillary tip of about 0.6 mm in inner diameter. The Cu wire connected to an anode was inserted into the CA polymer solution, and a cathode was attached to a grounded rotating metallic collector. The tip to collector distance (TCD) was 12 cm and the applied voltage was 10 kV. All the processes were carried out at 25 ° C.
2.3. Deacetylation of CANFs
In a typical deacetylation test, 100 mg of the above prepared CANFs were dipped into a 100 mL of 0.05 mol/L NaOH solution for 48 h at 25 ° C. After that, the CANF samples were thoroughly washed with distilled water to remove excess NaOH and dried in an oven at 60 ° C for 4 h. The deacetylated samples (CNFs) were further used for the anionization process.
2.4. Preparation of functional anionic cellulose nanofibers (f-CNFs)
Initially, the CNFs were dipped in 1.5 mol/L NaOH aqueous solution for 30 s to produce soda cellulose (Na-CNFs) and subsequently washed with 0.05 mol/L NaOH solution and dried in air. Then the Na-CNFs were dipped into a 1.0 mol/L ClCH2COONa solution for 6 h. Finally, the resultant f-CNFs were washed thoroughly with distilled water and dried in air. All these steps were carried out at 25 ° C.
2.5. Preparation of CuNSs/CNFs
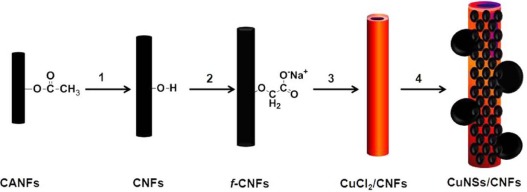
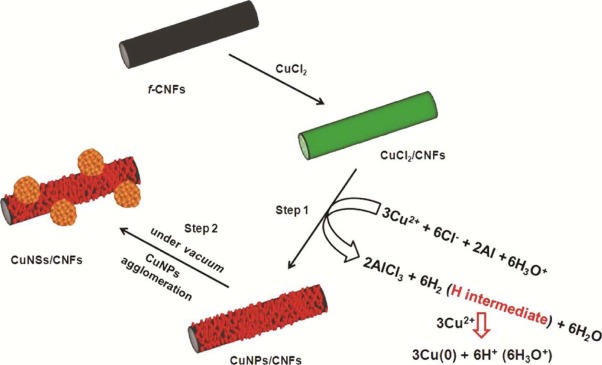
At first, the CuCl2 salt was deposited on the f-CNFs by a simple dipping method. In a typical process, 50 mg of the f-CNFs were dipped into an aqueous solution of CuCl2 (50 mL of 0.1 mol/L CuCl2) at 25 ° C for 24 h. Then the resultant fibers (CuCl2/CNFs) were gently rinsed with distilled water to remove the excess CuCl2. Subsequently, the CuCl2/CNF was well covered with aluminum foil and kept under vacuum for 24 h. Fig. 1 shows the schematic illustration of the preparation of CuNSs/CNFs composite.
Fig. 1. Schematic illustration for the preparation of CuNSs/CNFs (1— deacetylation, 2— anionization, 3— CuCl2deposition and 4— reduction).
2.6. Characterization
Field emission scanning electron microscopy (FE-SEM, S-5000, Hitachi Co., Japan) and transmission electron microscopy (TEM, JEOL model 2010 FasTEM) were used to characterize the morphology of the nanofibers. Prior to the FE-SEM analysis, the nanofibers were sputtered with Pd-Pt. To quantify the weight percentage of Cu and Cl in CuCl2/CNFs, scanning electron microscope (SEM) images and corresponding energy dispersive spectra (EDS) were recorded using Hitachi 3000H SEM. The same field of view was then scanned using an EDS spectrometer to acquire a set of X-ray maps for Cu and Cl using 1 ms point acquisition for approximately one million counts. The chemical functionalization of CNFs was analyzed by Fourier transform infrared spectroscopy (FT-IR, IR Prestige-21, Shimadzu, Japan). The X-ray photoelectron spectrometer (XPS, Kratos Axis-Ultra DLD, Kratos Analytical Ltd, Japan) measurements were performed to confirm the chemical state of CuNSs.
3. Results and Discussion
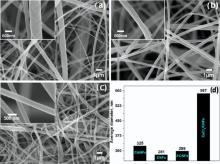
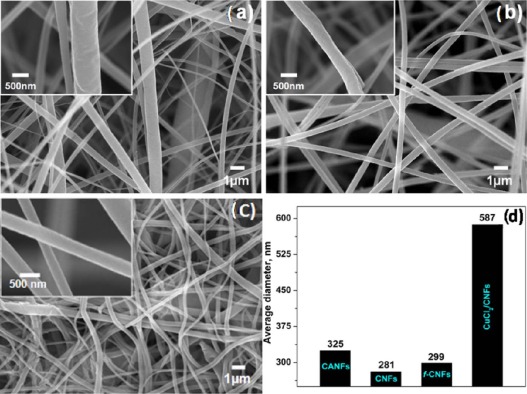
The FE-SEM images in Fig. 2(a-c) show the surface morphology of the CANFs, CNFs andf-CNFs. It can be seen that the morphology of the CANFs was smooth and continuous with fiber diameters ranging from 300 nm to 600 nm and lengths up to several millimeters. The average fiber diameter of the CANFs was calculated to be 325 ± 0.5 nm ( Fig. 2(d)). Similarly, after deacetylation process, the fiber morphology (CNFs) was smooth and continuous, but the average diameter of the fiber reduced from 325 nm to 281 nm (Fig. 2(d)), which may be due to the elimination of the acetate group[28]. However, after the anionization process, the morphology of the f-CNFs was rough with the mean fiber diameters of 299 ± 0.5 nm. In fact, the replacement of acetyl group (CH3COO-) with carboxyl methyl group (-CH2-COOH) and the presence of alkali metal (Na) might have caused the rough morphology.
Fig. 2. FE-SEM images of (a) CANFs, (b) CNFs, (c) f-CNFs (inset: magnified FE-SEM images), and (d) average fiber diameter of CANFs, CNFs, f-CNFs and CuCl2/CNFs.
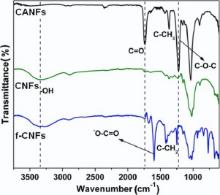
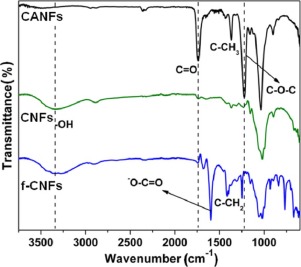
To further confirm the successful deacetylation and anionization processes, FT-IR spectra were taken for CANFs, CNFs and f-CNFs ( Fig. 3). As expected, for pure CANFs, three intense peaks appeared at 1730 cm-1, 1375 cm-1 and 1220 cm-1 corresponding to the stretching vibrations of C=O, C-CH3 and C-O-C groups, respectively[17]. After the deacetylation process of CANFs, the strong acetyl carbonyl adsorption at 1730 cm-1disappeared, along with the appearance of a much broader and stronger hydroxyl (-OH) peak at around 3400 cm-1[29], indicating the efficient regeneration of CNFs from CANFs. Interestingly, after anionization process, a strong new peak appeared at 1570 cm-1 (-COO-), along with the appearance of strong C-CH2 stretching vibration at 1610 cm-1, which confirms the formation of Na-carboxymethyl group (-CH2-COONa)[30]. The results confirmed the successful functionalization of the CNFs.
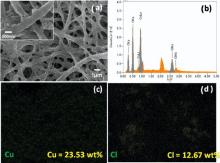
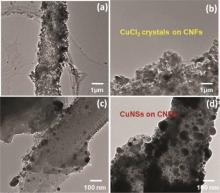
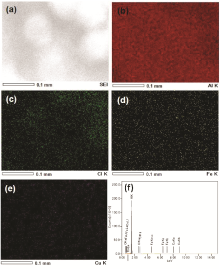
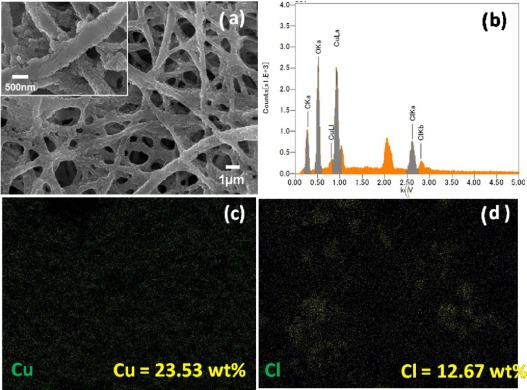
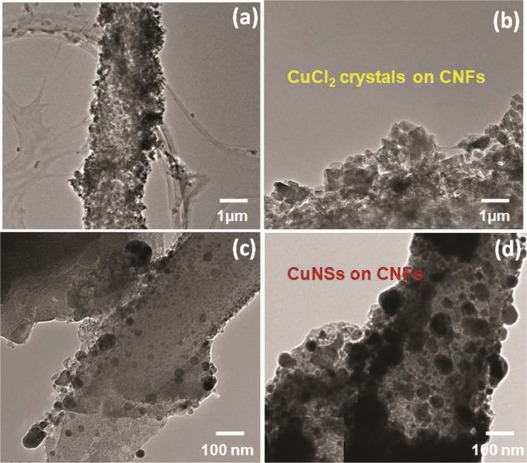
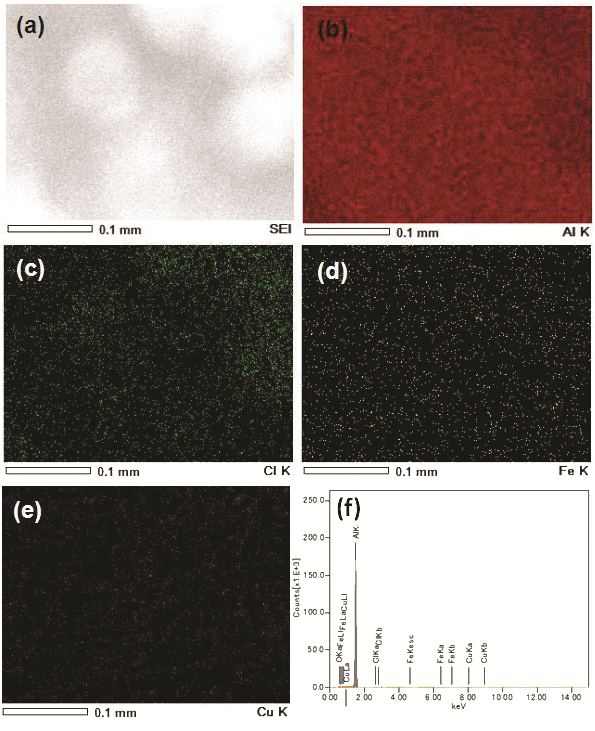
The anionic group functionalized f-CNFs were used for the preparation of CuCl2/CNFs.Fig. 4 shows the FE-SEM image, EDS spectrum and its corresponding elemental mapping (Cu and Cl) of CuCl2/CNFs. It can be seen that the surface morphology of CuCl2/CNFs was rough with a very fine distribution of CuCl2 salt (Fig. 4(a)). Compared to f-CNFs, the average fiber diameter of the CuCl2/CNFs increased from 299 nm to 587 nm (Fig. 3(d)), demonstrating the efficient deposition (~288-nm-thick coating) of CuCl2 salt on the surface of f-CNFs. From the EDS analysis ( Fig. 4(b)), it was found that the content of Cu and Cl in CuCl2/CNFs was 23.5 wt% and 12.7 wt%, respectively. Moreover, the Cu and Cl elemental mappings of CuCl2/CNFs display the distribution of CuCl2 salt on the f-CNFs, which is homogeneous ( Fig. 4(c, d)). Furthermore, the surface morphology of the CuCl2/CNFs was investigated in detail by TEM analysis (Figs. 5(a) and 4(b)). As seen from Fig. 5(a), the morphology of the CuCl2/CNFs was rough with uniform deposition of CuCl2 salt on the f-CNFs. Moreover, the magnified TEM image ( Fig. 5(b)) revealed that the deposited CuCl2on the f-CNFs was in crystalline nature. The result agrees well with the SEM images (Fig. 4(a)). In fact, the uniform and fine attachment of the CuCl2 salt (with high Cu) on the f-CNFs may be due to the electrostatic attraction of Cu ions by the anionic groups present in the f-CNFs.
Fig. 4. (a) FE-SEM image and (b) EDS spectrum of CuCl2/CNFs, and its corresponding elemental mapping of (c) Cu and (d) Cl (inset: magnified SEM images).
Fig. 5. TEM images of (a, b) CuCl2/CNFs and (c, d) CuNSs/CNFs.
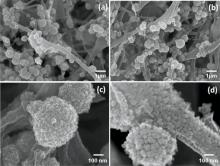
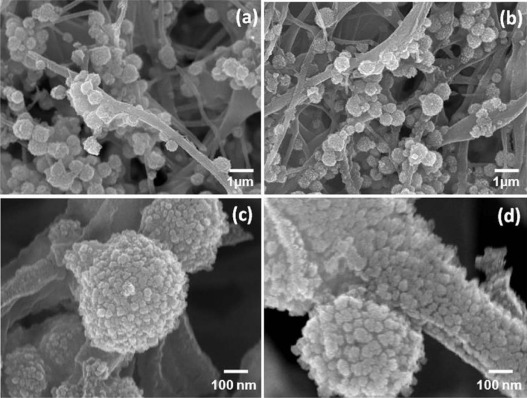
After the successful deposition of CuCl2 on the surface of f-CNFs, the resultant material CuCl2/CNFs was covered with aluminum foil and kept under vacuum for the reduction of CuCl2 to metallic Cu. It is worth to mention that the morphology of the resultant composite (CuNSs/CNFs) was very interesting. Fig. 6 shows the FE-SEM images of the CuNSs/CNFs. It can be seen that there are several CuNSs formed on the surface of the CNFs. The highly magnified SEM images (Fig. 6(c, d)) confirm the perfect spherical shape of the CuNSs. In addition, the formed CuNSs are uniformly distributed and strongly attached on the surface of the CNFs. The diameter of the CuNSs was ranging from 90 nm to 300 nm, as confirmed by SEM and TEM analysis ( Fig. 5 and Fig. 6). Apart from the CuNSs, copper nanoparticles (CuNPs) with particles sizes ranging from 10 nm to 50 nm were also observed on the surface of the CNFs (Fig. 5(c, d)). The results confirmed that the formation of the CuNSs may be due to the aggregation of weakly attached CuNPs on the surface of CNFs. Moreover, we noticed that the color of nanofiber sheets changed from light blue (CuCl2/CNFs) to light brown (CuNSs/CNFs) (data not shown).
Fig. 6. (a, b) Low magnification and (c, d) high magnification FE-SEM images of CuNSs/CNFs.
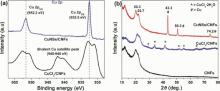
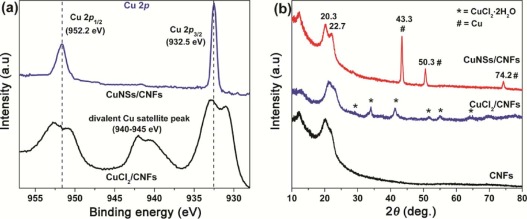
To investigate the chemical state of CuNSs, Cu 2p XPS and XRD spectra were taken for CuCl2/CNFs and CuNSs/CNFs (Fig. 7(a)). For the CuCl2/CNFs sample, two peaks at around 952 eV (Cu 2p1/2) and 932 eV (Cu 2p3/2) were observed. In addition, divalent Cu satellite peak was observed at around 945-940 eV[31]. This clearly indicates the presence of +2 oxidation state of Cu (in the form of CuCl2) on the CNFs surface. However, the XPS spectra of CuNSs/CNFs and CuCl2/CNFs were completely different from each other. The Cu 2p XPS spectra of the CuNSs/CNFs showed two intense peaks at 952.2 eV (Cu 2p1/2) and 932.5 eV (Cu 2p3/2). Moreover, the divalent Cu satellite peak at around 945-940 eV completely disappeared; this result confirms the complete reduction of CuCl2 to metallic Cu[32]. Fig. 7(b) shows the XRD patterns of CNFs, CuCl2/CNFs and CuNSs/CNFs. All the three samples demonstrated two dominant XRD peaks at 2θ of 20.3° and 22.7° , which correspond to (021) and (002) crystal planes of cellulose I [18]. The XRD pattern of CNFs after CuCl2 immobilization showed several new peaks corresponding to CuCl2⋅ 2H2O phases (CuCl2⋅ 2H2O, JCPDS No. 33-0451), whereas after the reduction process, the peaks of CuCl2⋅ 2H2O completely disappeared and three intense peaks at 43.3° , 50.3° and 74.2° were observed for the CuNSs/CNFs. These peaks were attributed to metallic Cu (JCPDS card No. 4-0836), indicating the complete reduction of CuCl2⋅ 2H2O to metallic Cu[33]. The result is in good agreement with the XPS data.
Fig. 7. (a) Cu 2p XPS spectra of CuCl2/CNFs and CuNSs/CNFs, and (b) XRD patterns of CNFs, CuCl2/CNFs and CuNSs/CNFs.
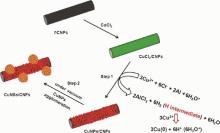
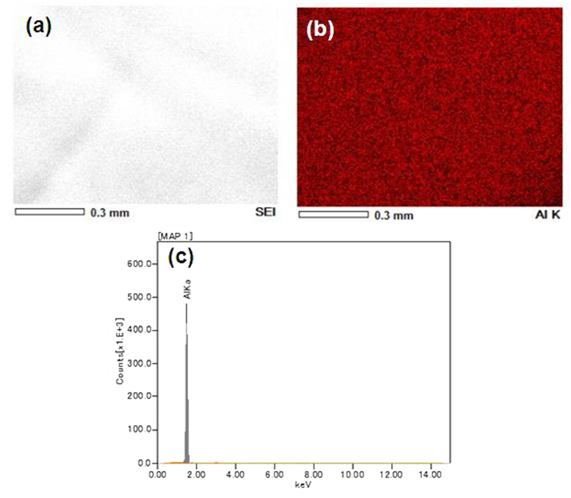
Based on the results obtained, a mechanism has been proposed for the formation of metallic CuNSs (CuNSs/CNFs) from CuCl2 (CuCl2/CNFs) (Fig. 8). First, in the wet condition, CuCl2 ionizes to form Cu2+ and 2Cl- ions. Subsequently, the aluminum reacts with Cl- ions to form AlCl3 and produces H2 gas, in which atomic hydrogen is generated as an intermediate[34]. The formation of AlCl3 was confirmed by EDS and its corresponding elemental mappings (Figs. S1 and S2 in the Supplementary material). Finally, the atomic hydrogen reduces the Cu2+ ions to metallic Cu (step 1). After the reduction process, the applied vacuum assists for the agglomeration of weakly attached CuNPs on the CNFs surface (step 2). In fact, NPs have high van der Waals forces and ability toward the agglomeration[35]. The CuNSs/CNFs may be opted for catalytic and sensor applications due to its unique nanostructure.
Fig. 8. Proposed mechanism for the formation of metallic CuNSs on CNFs.
4. Conclusion
We successfully prepared the CuNSs-decorated CNFs by a simple reduction method. FT-IR results confirmed the successful chemical functionalization of CNFs. FE-SEM and TEM images demonstrated the formation of CuNSs on the CNFs. Higher loading of Cu (23.5 wt%) on CNFs was confirmed by the SEM-EDS analysis. The successful reduction of CuCl2to metallic Cu was confirmed by XPS and XRD analyses. Based on the results, the mechanism was proposed for the formation of metallic Cu sphere on CNFs. Overall, the method is very simple, effective and economical feasible for the fabrication of metal nanostructures supported cellulose composites (CuNSs/CNFs).
This research was supported by the Basic Science Research Program through the National Research Foundation of Korea (NRF) funded by the Ministry of Science, ICT & Future Planning (2014R1A1A3A04049595).
The authors have declared that no competing interests exist.
H. Guo, Y. Chen, M. B. Cortie, X. Liu, Q. Xie, X. Wang, D. L. Peng. J. Phys. Chem. C, 118(2014), pp. 9801-9808[Cited within:2]
[2]
T. V. Alves, W. Hermoso, F. R. Ornellas, P. H. C. Camargo. Chem. Phys. Lett, 544(2012), pp. 64-69[Cited within:1]
[3]
A. K. Patra, A. Dutta, A. Bhaumik. Catal. Commun, 11(2010), pp. 651-655[Cited within:1]
[4]
S. Karan, D. Basak, B. Mallik. Chem. Phys. Lett, 434(2006), pp. 265-270[Cited within:1]
[5]
O. Akhavan, E. Ghaderi. J. Mater. Chem, 21(2011), pp. 12935-12940[Cited within:1]
[6]
Y. Zhao, C. Burda. Energy Environ. Sci, 5(2012), pp. 5564-5576[Cited within:1]
[7]
G. Ren, D. Hu, E. W. C. Cheng, M. A. Vargas-Reus, P. Reip, R. P. Allaker. Int. J. Antimicrob. Agents, 33(2009), pp. 587-590[Cited within:1]
[8]
S. Anand an, X. Wen, S. Yang. Mater. Chem. Phys, 93(2005), pp. 35-40[Cited within:1]
[9]
M. L. Kantam, V. S. Jaya, B. Sreedhar, M. M. Rao, B. M. Choudary. J. Mol. Catal. A Chem, , 256(2006), pp. 273-277[Cited within:1]
[10]
A. Ehsani, B. Jaleh, M. Nasrollahzadeh. J. Power Sources, 257(2014), pp. 300-307[Cited within:1]
[11]
M. Gopiraman, S. GaneshBabu, Z. Khatri, W. Kai, Y. A. Kim, M. Endo, R. Karvembu, I. S. Kim. Carbon, 62(2013), pp. 135-148[Cited within:1]
[12]
M. Gopiraman, S. GaneshBabu, Z. Khatri, W. Kai, Y. A. Kim, M. Endo, R. Karvembu, I. S. Kim. J. Phys. Chem. C, 117(2013), pp. 23582-23596[Cited within:1]
[13]
S. GaneshBabu, R. Karvembu. Catal. Surv. Asia, 17(2013), pp. 156-176[Cited within:1]
[14]
M. Gopiraman, S. GaneshBabu, R. Karvembu, I. S. Kim. Appl. Catal. A Gen, 484(2014), pp. 84-96[Cited within:1]
[15]
M. Gopiraman, R. Karvembu, I. S. Kim. ACS Catal, 4(2014), pp. 2118-2129[Cited within:1]
[16]
F. Ahmed, S. Saleemi, Z. Khatri, M. I. Abro, I. S. Kim. Carbohydr. Polym, 115(2014), pp. 388-393[Cited within:1]
[17]
Z. Khatri, M. Gopiraman, Y. Hirata, K. Wei, I. S. Kim. Carbohydr. Polym, 91(2013), pp. 434-443[Cited within:2]
[18]
D. Kesavan, H. Y. Kim, B. S. Kim. Carbohydr. Polym, 117(2014), pp. 408-413[Cited within:2]
[19]
Z. Khatri, F. Ahmed, A. K. Jhatial, M. I. Abro, G. Mayakrishnan, I. S. Kim. Cellulose, 21(2014), pp. 3089-3095[Cited within:1]
[20]
S. Arai, M. Endo. Electrochem. Commun, 5(2003), pp. 797-799[Cited within:1]
[21]
H. Bang, K. Watanabe, R. Nakashima, W. Kai, K. H. Song, J. S. Lee, M. Gopiraman, I. S. Kim. RSC Adv, 4(2014), pp. 59571-59578[Cited within:1]
[22]
K. Mallick, M. J. Witcomb, A. Dinsmore, M. S. Scurrell. Langmuir, 21(2005), pp. 7964-7967[Cited within:1]
[23]
H. R. Kim, T. Ito, B. S. Kim, I. S. Kim. J. Exp. Nanosci, 8(2013), pp. 852-858[Cited within:1]
[24]
X. Fang, H. Ma, S. Xiao, M. Shen, R. Guo, X. Cao, X. Shi. J. Mater. Chem, 21(2011), pp. 4493-4501[Cited within:2]
[25]
J. Yang, D. Sun, J. Li, X. Yang, J. Yu, Q. Hao, W. Liu, J. Liu, Z. Zou, J. Gu. Electrochim. Acta, 54(2009), pp. 6300-6305[Cited within:1]
[26]
E. Eroglu, X. Chen, M. Bradshaw, V. Agarwal, J. Zou, S. G. Stewart, X. Duan, R. N. Lamb, S. M. Smith, C. L. Raston, K. S. Iyer. RSC Adv, 3(2012), pp. 1009-1012[Cited within:1]
[27]
M. Gopiraman, K. Fujimori, K. Zeeshan, B. S. Kim, I. S. Kim. Express Polym. Lett, 7(2013), pp. 554-563[Cited within:1]
[28]
L. Deng, R. J. Young, I. A. Kinloch, Y. Zhu, S. J. Eichhorn. Carbon, 58(2013), pp. 66-75[Cited within:1]
[29]
A. Mtibe, L. Z. Linganiso, A. P. Mathew, K. Oksman, M. J. John, R. D. Anand jiwala. Carbohydr. Polym, 118(2015), pp. 1-8[Cited within:1]
[30]
T. Baran, A. Mentes, H. Arslan. Int. J. Biol. Macromol, 72(2015), pp. 94-103[Cited within:1]
[31]
N. A. Khan, S. H. Jhung. Angew. Chem, 124(2012), pp. 1224-1227[Cited within:1]
[32]
B. K. Park, S. Jeong, D. Kim, J. Moon, S. Lim, J. S. Kim. J. Colloid Interface Sci, 311(2007), pp. 417-424[Cited within:1]
[33]
Y. Kobayashi, S. Ishida, K. Ihara, Y. Yasuda, T. Morita, S. Yamada. Colloid Polym. Sci, 287(2009), pp. 877-880[Cited within:1]
[34]
W. Li, T. Cochell, A. Manthiram. Sci. Rep, 3(2013), p. 1229[Cited within:1]
[35]
F. R. Reinoso. Carbon, 36(1998), pp. 159-175[Cited within:1]
2
2014
0.0
0.0
... IntroductionMetal nanoarchitectures such as nanospheres[1], nanocubes[2], nanorods[3], nanoflowers[4]and nanoflakes[5] have recently received immense attention in nanotechnology due to their various physicochemical properties, such as large specific surface area and unique structures ...
... Among them, copper nanospheres (CuNSs) have also gained considerable attention due to their attractive optical, catalytic, mechanical and electrical properties[1] ...
1
2012
0.0
0.0
... IntroductionMetal nanoarchitectures such as nanospheres[1], nanocubes[2], nanorods[3], nanoflowers[4]and nanoflakes[5] have recently received immense attention in nanotechnology due to their various physicochemical properties, such as large specific surface area and unique structures ...
1
2010
0.0
0.0
... IntroductionMetal nanoarchitectures such as nanospheres[1], nanocubes[2], nanorods[3], nanoflowers[4]and nanoflakes[5] have recently received immense attention in nanotechnology due to their various physicochemical properties, such as large specific surface area and unique structures ...
1
2006
0.0
0.0
... IntroductionMetal nanoarchitectures such as nanospheres[1], nanocubes[2], nanorods[3], nanoflowers[4]and nanoflakes[5] have recently received immense attention in nanotechnology due to their various physicochemical properties, such as large specific surface area and unique structures ...
1
2011
0.0
0.0
... IntroductionMetal nanoarchitectures such as nanospheres[1], nanocubes[2], nanorods[3], nanoflowers[4]and nanoflakes[5] have recently received immense attention in nanotechnology due to their various physicochemical properties, such as large specific surface area and unique structures ...
1
2012
0.0
0.0
... The CuNSs have demonstrated an efficient role in various applications, such as energy[6], biomedical[7], sensors[8] and catalysis[9] ...
1
2009
0.0
0.0
... The CuNSs have demonstrated an efficient role in various applications, such as energy[6], biomedical[7], sensors[8] and catalysis[9] ...
1
2005
0.0
0.0
... The CuNSs have demonstrated an efficient role in various applications, such as energy[6], biomedical[7], sensors[8] and catalysis[9] ...
1
2006
0.0
0.0
... The CuNSs have demonstrated an efficient role in various applications, such as energy[6], biomedical[7], sensors[8] and catalysis[9] ...
1
2014
0.0
0.0
... Particularly, due to simple process, recovery and reusability, supported-CuNSs are often preferable materials for several industrial applications[10] ...
1
2013
0.0
0.0
... In addition, due to strong interaction between metal nanostructures (MNSs) and supports, the supported-MNSs are highly versatile andoften exhibit unique properties compared to unsupported MNSs[11,12] ...
1
2013
0.0
0.0
... In addition, due to strong interaction between metal nanostructures (MNSs) and supports, the supported-MNSs are highly versatile andoften exhibit unique properties compared to unsupported MNSs[11,12] ...
1
2013
0.0
0.0
... To date, several supported-MNSs including copper nanospheres (CuNSs) have been reported[13] ...
1
2014
0.0
0.0
... In our recent investigation, we prepared various MNSs-decorated carbon nanofiber composites and found that the composites are highly efficient for catalytic organic transformations[14,15] ...
1
2014
0.0
0.0
... In our recent investigation, we prepared various MNSs-decorated carbon nanofiber composites and found that the composites are highly efficient for catalytic organic transformations[14,15] ...
1
2014
0.0
0.0
... Recently, the development of various electrospun nanofibers (NFs), including cellulose nanofibers (CNFs) and their composites, has significantly attracted much attention because of their unique properties, such as large surface area to volume ratio, biocompatibility, flexibility in surface functionalities, easy-handling and outstanding mechanical properties[16,17,18] ...
2
2013
0.0
0.0
... Recently, the development of various electrospun nanofibers (NFs), including cellulose nanofibers (CNFs) and their composites, has significantly attracted much attention because of their unique properties, such as large surface area to volume ratio, biocompatibility, flexibility in surface functionalities, easy-handling and outstanding mechanical properties[16,17,18] ...
... As expected, for pure CANFs, three intense peaks appeared at 1730 cm-1, 1375 cm-1 and 1220 cm-1 corresponding to the stretching vibrations of C=O, C-CH3 and C-O-C groups, respectively[17] ...
2
2014
0.0
0.0
... Recently, the development of various electrospun nanofibers (NFs), including cellulose nanofibers (CNFs) and their composites, has significantly attracted much attention because of their unique properties, such as large surface area to volume ratio, biocompatibility, flexibility in surface functionalities, easy-handling and outstanding mechanical properties[16,17,18] ...
... , which correspond to (021) and (002) crystal planes of cellulose I [18] ...
1
2014
0.0
0.0
... Particularly, the surface modification of cellulose nanofibers with various functional groups is simple and unique[19] ...
1
2003
0.0
0.0
... Several MNSs-immobilized CNFs composites have been developed to date[20,21] ...
1
2014
0.0
0.0
... Several MNSs-immobilized CNFs composites have been developed to date[20,21] ...
1
2005
0.0
0.0
1
2013
0.0
0.0
... The most common methods for the deposition of MNSs are metal deposition[23], chemical reduction[24] and in-situ deposition[25] ...
2
2011
0.0
0.0
... The most common methods for the deposition of MNSs are metal deposition[23], chemical reduction[24] and in-situ deposition[25] ...
... [24] prepared AuNPs-immobilized electrospunpolyethyleneimine (PEI)/polyvinyl alcohol (PVA) nanofibers by chemical reduction methodusing NaBH4 as a reducing agent ...
1
2009
0.0
0.0
... The most common methods for the deposition of MNSs are metal deposition[23], chemical reduction[24] and in-situ deposition[25] ...
1
2012
0.0
0.0
... [26] prepared PdNPs-immobilized chitosan NFs by using photosynthetic method ...
1
2013
0.0
0.0
... Preparation of cellulose acetate nanofibers (CANFs)The CANFs were prepared according to our previously reported procedure[27] ...
1
2013
0.0
0.0
... 2(d)), which may be due to the elimination of the acetate group[28] ...
1
2015
0.0
0.0
... After the deacetylation process of CANFs, the strong acetyl carbonyl adsorption at 1730 cm-1disappeared, along with the appearance of a much broader and stronger hydroxyl (-OH) peak at around 3400 cm-1[29], indicating the efficient regeneration of CNFs from CANFs ...
1
2015
0.0
0.0
... Interestingly, after anionization process, a strong new peak appeared at 1570 cm-1 (-COO-), along with the appearance of strong C-CH2 stretching vibration at 1610 cm-1, which confirms the formation of Na-carboxymethyl group (-CH2-COONa)[30] ...
1
2012
0.0
0.0
... In addition, divalent Cu satellite peak was observed at around 945-940 eV[31] ...
1
2007
0.0
0.0
... this result confirms the complete reduction of CuCl2 to metallic Cu[32] ...
1
2009
0.0
0.0
... 2H2O to metallic Cu[33] ...
1
2013
0.0
0.0
... Subsequently, the aluminum reacts with Cl- ions to form AlCl3 and produces H2 gas, in which atomic hydrogen is generated as an intermediate[34] ...
1
1998
0.0
0.0
... In fact, NPs have high van der Waals forces and ability toward the agglomeration[35] ...
A Simple Method for the Fabrication of Metallic Copper Nanospheres-Decorated Cellulose Nanofiber Composite
[Hyunsik Bang1, Ke Ma1, Kai Wei2, Chang-Yong Kang3, Byoung-Suhk Kim4, Mayakrishnan Gopiraman1, Jung Soon Lee5,*, Ick-Soo Kim1,**]


 , Ick-Soo Kim