
Effects of Process-Induced Voids on the Properties of Fibre Reinforced Composites
[Chensong Dong ]
]
]
|
|


It is well known that voids have detrimental effects on the performance of composites. This study aims to provide a practical method for predicting the effects of process induced voids on the properties of composites. Representative volume elements (RVE) for carbon fibre/epoxy composites of various fibre volume fractions and void contents are created, and the moduli and strengths are derived by finite element analysis (FEA). Regression models are fitted to the FEA data for predicting composite properties including tensile, compressive and shear. The strengths of composite laminates including tensile strength and interlaminar shear strength (ILSS) are calculated with the aid of the developed models. The model predictions are compared with various experimental data and good agreement is found. The outcome from this study provides a useful optimisation and robust design tool for realising affordable composite products when process induced voids are taken into account.
Nomenclatures
E11 longitudinal modulus of composite
E22 transverse modulus of composite
EfL longitudinal modulus of fibre
EfT transverse modulus of fibre
Em modulus of matrix
Eme effective modulus of matrix with voids
G12 longitudinal-transverse (in-plane) shear modulus of composite
G23 transverse-transverse shear modulus of composite
Gf shear modulus of fibre
Gme effective shear modulus of matrix with voids
K23 transverse-transverse bulk modulus of composite
Kf bulk modulus of fibre
KfTT transverse-transverse bulk modulus of fibre
Kme effective bulk modulus of matrix with voids
KmTTe effective transverse bulk modulus of matrix with voids
SLt longitudinal tensile strength of composite
STt transverse tensile strength of composite
Vf fibre volume fraction
Vv void content with respect to matrix
Vvc critical void content
Vvn void content with respect to composite (net void content)
ε fu strain at failure of fibre
ε mu strain at failure of matrix
ε u effective strain at failure of composite
ν 12 longitudinal-transverse Poisson's ratio of composite
ν 23 transverse-transverse Poisson's ratio of composite
ν me effective Poisson's ratio of matrix with voids
Fibre-reinforced composite materials are widely used in many structural components in aircraft, automotive, marine, and other industries[1] because of their low density, high strength, high stiffness to weight ratio, excellent durability, and design flexibility. However, the high complexity and cost of the manufacturing process have been limiting the use of composite materials. One common problem associated with the complicated nature of material and processing is process induced defects, e.g. dry spots and voids, resin-rich surfaces/zones, fibre distortions. These defects can cause large variation in the product dimensions and mechanical performance, and even product scrap.
Conventional composite void characterisation techniques, e.g. Archimedes test, matrix burn-off, matrix digestion and microscopy, provide results of limited accuracy and/or reliability due to inherent testing errors. Recent techniques include X-ray computed tomography and micro-computed tomography (micro-CT) [2].
It is well known that voids have detrimental effects on the properties of composites. For the purpose of minimising voids, much research [3, 4, 5, 6] has been done for process optimisation. Despite this effort, it is impossible to eliminate voids in the composites processing. Thus, it is very important to understand the effects of voids on the material properties.
Various results have been found on the effects of voids in the literature. In general, it is found that the matrix-dominated properties, e.g. interlaminar shear strength (ILSS) [7, 8, 9], flexural and compressive properties [10, 11, 12], fatigue [13, 14] and fracture toughness[12] are affected by voids while the fibre-dominated properties are not affected by voids.
For tensile properties, Zhang et al.[15] found slight decrease in the tensile strength of the woven-fabric carbon/epoxy prepregs (T300/914) laminates when the void content increased from 0.33% to 1.50%. Similar results were found by Guo et al.[16] for T700/TDE85 carbon fibre reinforced epoxy composites.
Liu et al.[11] found that ILSS, flexural strength and flexural modulus were most sensitive to void content; tensile strength showed a slow decrease with increasing void content; and tensile modulus was insensitive to void. Hagstrand et al.[10] studied the effect of porosity on the flexural behaviour of unidirectional glass fibre reinforced polypropylene beams, and found that voids had a negative effect on the flexural modulus and strength, which both decreased by about 1.5% for each 1% of voids.
Many studies have been carried out on the effects of voids on ILSS. Hancox[17] found that voids had a serious degrading effect on shear modulus and strength, reducing properties to 30% of their void free value at 5 vol% voids. Costa et al.[18] studied the ILSS of T300 carbon fibre fabric reinforced epoxy composites with intentionally high porosity levels from 1.4% to 5.6% produced using the technique proposed by de Almeida et al.[8]. The stacking sequence was [0/90]14, resulting in a nominal thickness of 4.1 mm. The volume fibre content was between 64% and 72%. The same technique was used to make T300 carbon fibre fabric reinforced epoxy bismaleimide (BMI) of the same stacking sequence with intentionally high porosity levels from 1.1% to 3.4%[18]. The fibre volume fraction was between 64% and 70%. For both materials, the ILSS was measured by the short-beam method described in ASTM D2344 and the adequacy of a fracture criterion to represent the experimental data for both materials was assessed. Jeong[9] studied the effects of voids on the ILSS for both unidirectional and woven graphite/epoxy composites. Guo et al.[16]studied the effects of voids on the shear and flexural strengths of T700/TDE85 carbon fibre reinforced epoxy composites. The nominal fibre volume fraction was 60% and the stacking sequence was [0/90]3S. Bureau and Denault[13] studied the ILSS of continuous glass fibre/polypropylene (CGF/PP) composites. It is shown from these studies that ILSS significantly decreases due to the presence of voids.
More recently, Scott et al.[19] used a multi-scale computed tomography (CT) technique to determine the material structure and damage mechanisms in hydrostatically loaded composite circumferential structures. Their study revealed matrix cracking in the longitudinally wound plies and fibre breaks in the circumferentially wound plies. The matrix cracking within the longitudinally wound plies interacted directly with intralaminar voids, while less distinct correlation of voids with fibre breaks in the circumferential was found.
Since composite laminates have the ability to withstand high stresses acting over small regions, the strength of a laminate with high void content over a small area is unaffected by the existence of such defect. It is also shown that a critical volume fraction exists below which the strength is unaffected by voids[20]. De Almeida and Neto[8] presented a criterion to estimate the effect of void content on the strength of composites using Mar-Lin equation[21] and found the critical volume was about 3%. Jeong[9] studied the effect of voids on ILSS and determined the critical volume to be 1%. Guo et al.[16] showed that this critical volume was about 1% for ILSS, flexural and tensile strengths. Costa et al.[18] found that the ILSS of carbon/epoxy laminates and carbon/BMI laminates with void content above 0.9% decreased.
In addition to void content, Huang and Talreja[22] showed the effects of void geometry on the elastic properties of unidirectional fibre reinforced composites and concluded that voids had much larger influence on reducing the out-of-plane properties than the in-plane ones. The in-plane properties were found to be most sensitive to the width-height aspect ratio.
It is seen that various experimental results exist for the effects of voids on the moduli and strengths of composites. Voids remain a significant topic in the development of composites, especially in the nano-scale. Recent studies by Yu et al.[23, 24] suggest a 3% decrease in the effective moduli of composites containing multiple nanoheterogeneities. This study aims at providing a model to take into account the effects of voids in the design stage. For this purpose, finite element models based on representative volume elements (RVE) with randomly distributed voids were developed. The resulting finite element analysis (FEA) data were used to fit a simple regression model. Using the regression model, the strengths of composite laminates with voids can be predicted conveniently. The model is validated against various experimental data.
FEA has been used in some studies to investigate the effects of process-induced voids[22]. In this study, an RVE-based FEA approach was employed with the aid of a commercial software package, ANSYS Mechanical APDL. For simplicity, 2D analyses were employed based on the assumption of plane strain conditions. Since fibre reinforced composites are highly orthotropic, FEA models were developed for transverse and longitudinal properties, respectively.
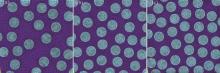
For computing transverse properties, RVEs of 50 µ m × 50 µ m with three different fibre volume fractions: 33.73%, 42.92%, and 51.11%, were created, as shown in Fig. 1.
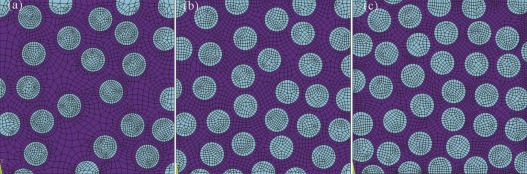 | Fig. 1. RVEs of 50 µ m × 50 µ m with three different fibre volume fractions: 33.73% (a), 42.92% (b), and 51.11% (c), for modelling the transverse properties. |
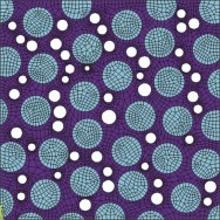
For each fibre volume fraction, RVEs of five different void contents are created. The voids are introduced to the matrix randomly. Only intra-tow voids are considered and their sizes are limited by the inter-fibre distances. The actual void content is determined by the area of RVE. As an example, the maximum void content is 17.64% for Vf = 42.92%, as shown inFig. 2.
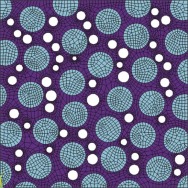 | Fig. 2. Maximum void content of 17.64% for Vf = 42.92%. |
In this study, the void content, Vv, is defined to be with respect to the matrix only. The void content with respect to the composite is defined as the net void content, Vvn, which is related to Vv by
Vvn=(1-Vf)Vv(1)
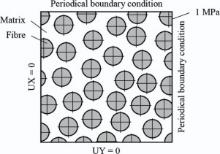
PLANE183 element is used with the option of plane strain. As shown in Fig. 3, the horizontal and vertical displacements are constrained for the left and bottom edges, respectively. Periodical boundary conditions are applied to the right and top edges. A unit tensile stress (p0 = 1 MPa) was applied at the right edge.
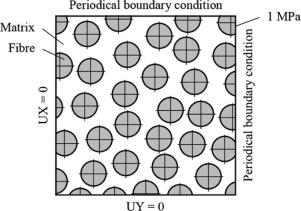 | Fig. 3. Boundary conditions for transverse properties. |
The x- and y- displacements of the RVE, δ x and δ y, are used for deriving the effective transverse modulus and transverse-transverse Poisson's ratio.
 |
 |
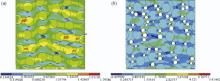
where L0 is the size of the RVE (50 µ m). In addition to deformation, the distribution of stress, σ xxmax, was obtained from FEA. When the fibre volume fraction is 42.92%, the distributions of σ xxmax with no voids and maximum voids are shown in Fig. 4. It is shown that high stress is induced around fibres. When voids are introduced, higher stress concentrations occur in the matrix around the voids.
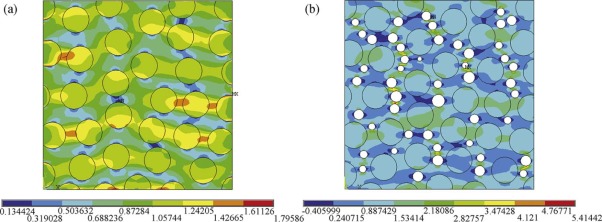 | Fig. 4. Normal stress due to tensile load for transverse RVEs of 42.92% fibre volume fraction with no voids (a) and maximum voids (b). |
Similar to computing the transverse properties, RVEs of 50 µ m × 50 µ m with three different fibre volume fractions, 33.73%, 42.92%, and 51.11%, are created for the modelling of the longitudinal properties. Similarly, for each fibre volume fractions, RVEs of five different void contents are created. The voids are introduced to the matrix randomly. The x- and y- displacements of each RVE, δ x and δ y, are used for deriving the effective longitudinal modulus and longitudinal-transverse Poisson's ratio.
For comparison, the effective moduli of composites when voids were present were also studied using two analytical approaches. The first approach was based on Kernermodel[25]and Hashin's circular cylinder model (CCM)[26], and the second approach was based on Mori-Tanaka approach. Because of the existence of voids, the composite is a material consisting of three phases, i.e. fibres, matrix, and voids.
In order to take into account the voids, homogenisation was carried out for the matrix and voids. The effective modulus of the matrix with voids was predicted using Kerner model, which reads
where
These equations coincide numerically with the corresponding lower bounds of Hashin's sphere assemblage model.
The effective modulus of resin is used for calculating the properties of a composite with voids. In general, longitudinal modulus can be predicted using the rule of mixtures (RoM) with good accuracy, i.e.
E11=EfLVf+Eme (1-Vf) (8)
Likewise, the Poisson's ratio is given by
ν 12=ν fLTVf+ν me (1-Vf) (9)
For transverse modulus, many models have been developed. In this study, Hashin's CCM was chosen. For a two phase composite material, the transverse modulus is given by
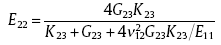 |
where
cf, cm, c1, c2 and c3 are constants, given by
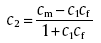 |
The transverse-transverse Poisson's ratio is given by
The in-plane shear modulus is given by
The elastic properties were also modelled using the Mori-Tanaka method[27, 28] based on Eshelby's inclusion theory[29] and Mori-Tanaka's mean field theory[30]. Using the Mori-Tanaka method, the effective composite modulus is given by
C=[(1-Vf)Cm+VfCfA][(1-Vf)I+VfA]-1(24)
where Cf and Cm are the elastic stiffness tensors for the matrix and fibres, respectively; Ais the concentration factor relating the average strain in the effective reinforcement to that of the unknown effective material in which it is embedded; and S is the Eshelby tensor.
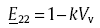
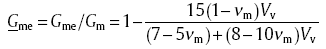
It is seen from Eqs. ((4), (5), (6) and (7)) that the modulus of the matrix decreases with increasing void content. An approximate linear relationship is found. For the epoxy used in this study, the normalised matrix modulus when voids are present is given by
 |
Eq. (26) shows that a 1% increase in void content will cause a 1.76% decrease in the matrix modulus.
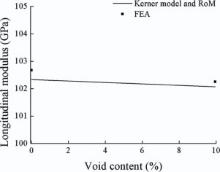
The matrix modulus from Eq. (26) can be used for calculating the lamina properties. The longitudinal moduli from the FEA and Kerner-RoM approach are shown in Fig. 5. It is shown that the RoM can well predict the longitudinal modulus, and voids have little effect on the longitudinal properties. For example, when the fibre volume fraction is 42.92%, a 1% increase in void content will only cause a 0.04% decrease in the matrix modulus.
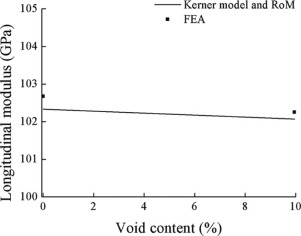 | Fig. 5. Longitudinal moduli from the FEA predictions and the analytical approach. |
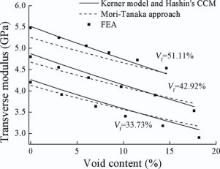
The transverse moduli from the FEA and two analytical approaches, i.e. Kerner-Hashin and Mori-Tanaka, are shown in Fig. 6. It is shown that good agreement is found between Kerner-Hashin approach, Mori-Tanaka method and FEA.
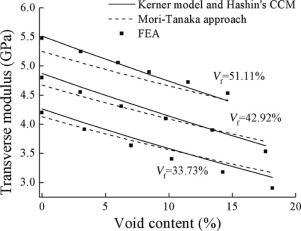 | Fig. 6. Transverse moduli from the FEA and two analytical approaches. |
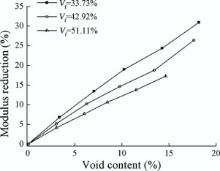
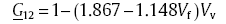
The transverse modulus reduction caused by voids is shown in Fig. 7. It is shown that approximate linear relationships exist, with the slope decreasing with increasing fibre volume fraction. On average, every 1% increase in the void content results in 1.5% decrease in the transverse modulus. For any given fibre volume fraction, for convenience, the relative transverse modulus, 
 |
where E220 is the void-free transverse modulus. The relative transverse modulus is then given by
 |
As aforementioned, k is the slope which is dependent on fibre volume fraction. A regression model can be fitted to the slope data. Thus, the relative transverse modulus is given by
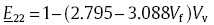 |
 | Fig. 7. Transverse modulus reduction vs. void content. |
The in-plane shear modulus is obtained using the Kerner-Hashin approach. According to Eq. (5), the normalised shear modulus of the matrix when voids are present is given by
 |
When the void content is low, Eq. (30) can be approximated by a linear regression model, as given by
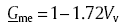 |
The in-plane shear modulus of the composite can then be calculated using Eq. (23). The in-plane shear modulus decreases with increasing void content. At low void content, linear relationships can be assumed. Likewise, the relative in-plane shear modulus, 
 |
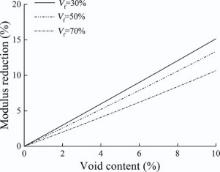
where G120 is the void-free in-plane shear modulus. The in-plane shear modulus reduction caused by voids is shown in Fig. 8. A regression model can be fitted to the data:
 |
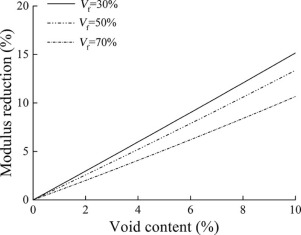 | Fig. 8. In-plane shear modulus reduction vs. void content. |
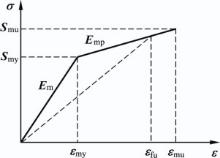
In general, fibres exhibit elastic behaviour, but yielding must be taken into account for the matrix. If the fibres have higher failure strain than the matrix, e.g. glass, yield of the matrix needs to be considered. In this study, a bilinear relationship as shown in Fig. 9 is used to describe the stress-strain relationship for the epoxy.
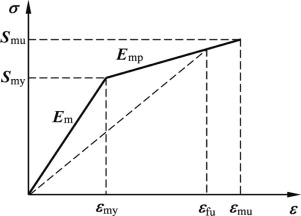 | Fig. 9. Bilinear stress-strain relationship for epoxy. |
It is shown from an experimental study[31] that ε mu is approximately 4%. The yield strength is empirically determined to be Smy≈ 0.75Smu. The yield strain is then ε my≈ 0.75Smu/Em. The modulus of the epoxy in the plastic region is then Emp=0.25Smu/(ε mu-ε my). If the fibres fail before the ultimate strain of the epoxy, the effective modulus of the epoxy is given by
If the epoxy fails before the fibres, the effective modulus for the epoxy is then Eme=Smu/ε mu. Eme can be used in the micromechanical modelling for deriving the lamina properties. The longitudinal tensile strength is given by
SLt=E11ε mu(35)
On the other hand, if the fibres have lower failure strain than the matrix, e.g. carbon, the possible failure mode is fibre breakage, and the longitudinal strength can be simply calculated using the effective modulus and fibre failure strain, e.g. 1.65% for AS4 graphite fibres, i.e.
SLt=E11ε fu(36)
It is seen the modulus of the matrix decreases with increasing void content. However, because the fibres have much higher modulus, only a slight decrease in the longitudinal strength occurs with increasing void content, and this confirms that voids have little effect on the longitudinal properties.
It is well known that the transverse tensile strength is more complex than the longitudinal one, and is affected by many factors including interfacial bonding, fibre distribution, and voids. In general, the transverse strength is less than that of the unreinforced matrix. The consequence is that the transverse plies in a cross-ply laminate usually start to crack before the parallel ones[32].
It is shown from the FEA predictions that the introduction of fibres to the matrix increases the maximum stress of stress concentration. It is postulated that the increased stress concentration will reduce the strength. Thus, the transverse strength is related to the maximum stress from FEA as given by
where STt0 is the void-free transverse tensile strength; c is a constant; σ xxnom is the nominal stress being applied; and σ xxmax0 is the maximum stress in the void-free composite. The introduction of c is due to the fact that localised high stress has limited effect on strength decrease [8].
A model for predicting the transverse strength of a fibre reinforced composite is given by[1]
where
In this study, the tensile strength of the matrix was determined to be 55 MPa from experiments. It is found when c = 1.5, the transverse strengths from FEA prediction are in good agreement with those obtained using Eq. (38), as shown in Fig. 10. This can be well explained by Weibull theory.
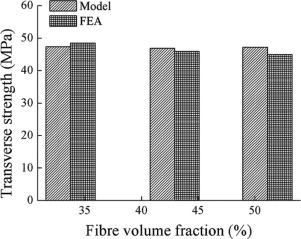 | Fig. 10. Transverse strengths from FEA prediction and analytical model. |
The presence of voids in the matrix increases the maximum stress and consequently reduces the transverse strength. Similar to Eq. (37), the strength with voids is given by
where σ xxmax is the maximum stress when voids are present. The same constant c is used.
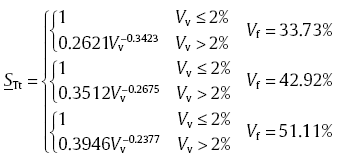
For convenience, the ratio of the transverse strength when voids are present and the void free transverse strength is defined as the relative transverse strength,
 |
The relative strength can be expressed by the following formula[18].
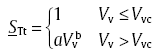 |
The critical void content was empirically determined to be 2% from the FEA data. For the three fibre volume fractions being studied, the regression formulas are given by
 |
Eq. (42) can be summarised to
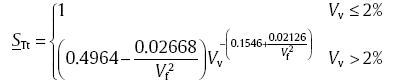 |
A comparison of the relative transverse strengths from the FEA predictions and the regression model is given in Fig. 11, which has proven the validity of the developed regression model.
 | Fig. 11. Relative transverse strengths from the FEA predictions and the regression model. |
The longitudinal compressive strength is dependent on the failure mode. The possible compressive failure modes include pure compression, delamination/shear, and microbuckling or kinking. When voids are present, no models are available for the longitudinal compressive strength. However, since the compressive strength and transverse tensile strength are both matrix-dominated properties, voids have large effect, and in this study, the model developed for the relative transverse tensile strength in Eq. (43)is used for finding the longitudinal compressive strength when voids are present.
In transverse compressive loading, the failure is initiated by fibre-matrix debonding. The transverse compressive modulus is higher than the matrix modulus and is close to the transverse tensile modulus. The transverse compressive strength is found to be nearly independent of fibre volume fraction[33]. This type of failure is expected at an applied normal stress of about two times the in-plane shear strength, on planes inclined at 45° to the loading direction and parallel to the fibreaxis[32]. Likewise, the transverse compressive strength is a matrix-dominated property. Thus, Eq. (43) is used for finding the transverse compressive strength when voids are present.
It is expected, unless for very high fibre volume fractions, the in-plane shear strength is close to the shear strength of the matrix[32, 34]. The shear strength of commonly used resins, e.g. epoxy is normally higher than the tensile strength. Experimental data show that the in-plane shear strength can be between 2 and 2.5 times the transverse tensile strength [32]. Since shear strength is also matrix-dominated, when voids are present, the model developed for the relative transverse tensile strength in Eq. (43) is also used to obtain the shear strength.
When voids are present, the strength of a composite laminate is determined using the developed regression models. In this study, both tensile strength, interlaminar shear strengths (ILSS), and flexural strength are studied.
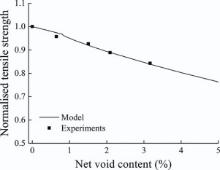
Guo et al.[16] studied the effects of voids on the tensile strength of T700/TDE85 carbon fibre reinforced epoxy composites. The nominal fibre volume fraction was 60% and the stacking sequence was [0/90]3S. For this type of carbon fibre reinforced composites, the transverse plies are more sensitive to voids and will fail before the longitudinal plies. After the failure of the transverse plies, the laminate will fail catastrophically because of the lack of load transfer. When deriving the tensile strength, the transverse modulus and strength are first derived using Eqs. (12), (31), (38) and (45). The strain to failure can be calculated accordingly, and this will be the strain to failure. The effective stiffness of the laminate is calculated using the RoM. Using the calculated strain to failure and effective stiffness, the tensile strength is calculated. The calculated relative tensile strength and the experimental results are shown in Fig. 12, from which it is seen that good agreement exists.
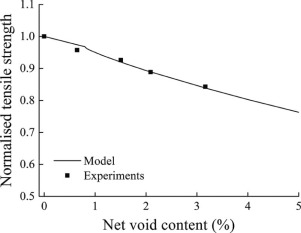 | Fig. 12. Tensile strengths from model and experiments. |
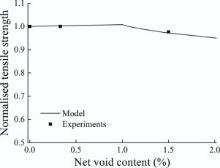
Zhang et al.[15] studied composites made from woven-fabric carbon/epoxy prepregs (T300/914). The stacking sequence was [(± 45)4/(0, 90)/(± 45)2]S. Three different porosity levels ranging from 0.33% to 1.50% were obtained by implementing different magnitudes of autoclave pressures.
For a laminate of general stacking sequences, the effective stiffness of each lamina needs to be derived. For a lamina of θ angle, the effective stiffness can be given by [35]
Eθ =E22+(E11-E22)cos4θ (44)
For ± 45 laminas, the effective stiffness is then E± 45=(E11+3E22)/4. For this [(± 45)4/(0, 90)/(± 45)2]S stacking sequence, the effective stiffness is
Because of the existence of 90° and 45° plies, the strain to failure decreases with increasing void content and the tensile strength can be calculated accordingly. It is found that the general trend of the tensile strength decreases with increasing void contents. With void contents increasing from 0.33% to 1.50%, the tensile strength of the non-aged, aged, and dried specimens decrease by 2.36%, 4.87% and 2.16%, respectively. The calculated relative tensile strength and the experimental results are shown in Fig. 13. It is seen there is little change in the normalised tensile strength when the net void content is less than 1%, and then the strength decreases with increasing void content. Because the change in the strength is not significant, it is difficult to see the critical void content around 1%. Based on the existing data, it is seen the model presented in this paper can predict the strength with satisfactory accuracy.
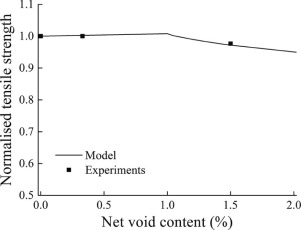 | Fig. 13. Tensile strengths from model and experiments. |
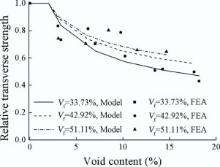
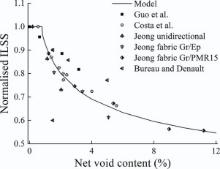
Because the ILSS is a matrix-dominated property, Eq. (43) is used for finding the ILSS when voids are present. The composites were made of around 60% carbon fibres. The calculated relative ILSS and various experimental data from literature[9, 13, 16, 18] are shown in Fig. 14. It is seen from Fig. 14 that the model being developed in this study shows excellent agreement with the experimental data, which could be used as a useful guideline in composites design.
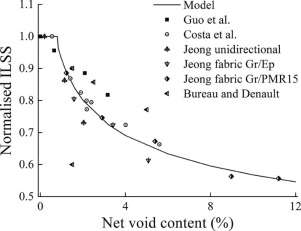 | Fig. 14. ILSS from model and experiments. |
In this work, the effects of voids on the stiffness and strength of fibre-reinforced composites are studied numerically by RVE FEA and analytically by Kerner-Hashin model and Mori-Tanaka approach, respectively. It is seen from the results that all three models are in good agreement.
All results suggest that voids significantly affect matrix-dominated properties, e.g.transverse properties. Every 1% increase in the void content results in 1.5% decrease in the transverse modulus. For the transverse strength, the critical void content is around 2%. For any void content above the critical value, transverse strength decreases with increasing void content, and the strength reduction decreases with increasing fibre volume fraction. On the other hand, voids have little effects on longitudinal properties.
Regression models are fitted to the FEA data for predicting the effects of voids of stiffness and strength. The strengths of composite laminates including tensile strength and ILSS are calculated consequently. It is shown the model calculations are in excellent agreement with various experimental data, which proves the validity of the presented approach. The outcome from this study provides a useful optimisation and robust design tool for realising affordable composite products when the process-induced voids are taken into account.
The authors have declared that no competing interests exist.
| [1] |
|
| [2] |
|
| [3] |
|
| [4] |
|
| [5] |
|
| [6] |
|
| [7] |
|
| [8] |
|
| [9] |
|
| [10] |
|
| [11] |
|
| [12] |
|
| [13] |
|
| [14] |
|
| [15] |
|
| [16] |
|
| [17] |
|
| [18] |
|
| [19] |
|
| [20] |
|
| [21] |
|
| [22] |
|
| [23] |
|
| [24] |
|
| [25] |
|
| [26] |
|
| [27] |
|
| [28] |
|
| [29] |
|
| [30] |
|
| [31] |
|
| [32] |
|
| [33] |
|
| [34] |
|
| [35] |
|