


Bulk Metallic Glasses: MRI Compatibility and Its Correlation with Magnetic Susceptibility
[Da-Bo Zhou1 , Shao-Ping Wang2 , Shao-Gang Wang2 , Hong-Jun Ai1, *  , Jian Xu
2, ** ]
, Jian Xu]
|
|


Several bulk metallic glasses (BMGs) were selected to in vitro assess their magnetic resonance imaging (MRI) compatibility with agarose gel as a phantom, in terms of the extent of susceptibility artifacts in magnetic resonance image. The investigated metals include the Au49Ag5.5Pd2.3Cu26.9Si16.3, Zr61Ti2Cu25Al12, Cu50.4Ni5.6Ti31Zr13 and Ti47Cu38Zr7.5Fe2.5Sn2Si1Ag2, together with pure titanium (CP-Ti) and Co-28Cr-6Mo alloy (ASTM-F799) for comparison. The artifact extent in MR images was quantitatively characterized according to the total volume in reconstructed 3D images with a series of slices under acquisition by fast spin echo (FSE) sequence and gradient echo (GRE) sequence. As indicated, artifact severity of the BMGs is much less than that of the CoCrMo alloy. The AuAgPdCuSi BMG manifested the smallest artifact among the four BMGs, while the TiCuZrFeSnSiAg BMG is comparative to the CP-Ti. The MRI compatibility of BMGs is ranked as a sequence of the Au-, Zr-, Cu- and Ti-based alloys. Dependence of material magnetic susceptibility on artifact extent is also the case of the BMGs, even though it does not follow a simple linear relationship within a range of Δ χv = 30-180 ppm. These findings are of interest to reveal that the BMGs are potentially applied in the fields associated with an interventional MRI for MRI-guided surgeries.
Magnetic resonance imaging (MRI) is widely used in clinical evaluations of neurology, oncology, cardiology, and orthopedics. It has several remarkable advantages over conventional imaging techniques such as radiography and computed tomography (CT). It entails superior soft tissue contrast, no exposure to ionizing radiation and direct acquisition of all tomographic information in any desired plane[1]. However, the presence of implanted metallic objects may either render MRI unsafe or greatly limit its diagnostic utility. Although some metallic implants are safe for MRI, their presence can cause substantial artifacts in the image, including signal loss, signal pile-up, and geometric distortion[2, 3].
It has been well documented that magnetic susceptibility artifacts in MRI from ferromagnetic metallic implants or devices are the most critical issue[4, 5]. Because susceptibility artifacts are particularly prominent close to edges, holes and tips on the metallic surface, they can obscure regions of interest (ROI) adjacent to surgical implants, making the interpretation of images difficult [6, 7, 8]. In general, the susceptibility artifacts depend upon the chemical composition of implanted metals, the size and geometry of implants, the orientation of implants in relation to the direction of main magnetic field (B0), the type of pulse sequence, and other MRI parameters that primarily include the voxel size as determined by the field of view (FOV), image matrix, section thickness, echo train length, etc [6, 8, 9, 10, 11, 12, 13, 14, 15].
From the materials perspective, it is of interest to develop new MRI-compatible alloys based on the elements with lower magnetic susceptibility, and to simultaneously meet the requirements of mechanical properties, corrosion resistance and biocompatibility. Recently, such tissue-susceptibility matched metals have been concerned in several alloy systems, including the Cu-Sn [16], Au-Pt-Nb[17], Zr-Mo[18], Zr-Nb[19], Nb-Ta-W-Zr[20] and Nb-Ta-Zr [21, 22, 23].
In contrast to conventional crystalline metals, metallic glasses (or amorphous alloys) manifest substantially uniform microstructure, without defects such as dislocations or grain boundaries. Atomic ordering arrangement in metallic glass only occurs in short range rather than in long range like crystalline solids. Consequently, glassy/amorphous alloys exhibit many unique properties, such as high yield strength, large elastic strain (∼2%) and excellent corrosion resistance. In light of these attractive features, considerable attention has been paid to the potential of bulk metallic glasses (BMGs) as biomedical implants[24, 25, 26, 27, 28, 29]. To our knowledge, however, very few studies on the magnetic susceptibility of the paramagnetic and diamagnetic BMGs and their MRI compatibility have been carried out so far[30, 31].
As the pioneer work, Horton and Parsell[31] showed that the Zr52.5Ti5Cu17.9Ni14.6Al10 (in atomic percentage) BMG (designated as BAM11) exhibits a magnetic susceptibility (χ v = 109 ppm) significantly lower than that of Ti-6Al-4V alloy (χ v = 190 ppm) that is a typical implant metal. Their preliminary results with in vitro assessment indicated that the BAM11 is surprisingly MRI-compatible, possibly due to its amorphous structure. It encourages the potential application especially associated with an interventional MRI for MRI guided surgeries.
In this work, several newly-developed BMGs with robust glass-forming ability (GFA) were selected to investigate their susceptibility artifacts in MRI, including the Au49Ag5.5Pd2.3Cu26.9Si16.3[32], Zr61Ti2Cu25Al12[33, 34], Cu50.4Ni5.6Ti31Zr13[35], Ti47Cu38Zr7.5Fe2.5Sn2Si1Ag2[36], which are desired to be MRI-compatible, together with pure titanium (CP-Ti) and Co-28Cr-6Mo alloy (ASTM F799, CoCrMo) for comparison. These amorphous metals are of interest to have potential use as dental mini-implants, orthopedic implants and biopsy needles. With the agarose gel phantom in which the metallic cylinders were embedded, the two-dimensional (2D) MR images were taken in the manner of fast spin echo (FSE) and gradient echo (GRE) pulse sequences. Using a series of 2D image slices, the total volume of artifacts was quantitatively attained in terms of a three-dimensional (3D) reconstruction using a computer program. Based on such an in vitro assessment, dependency of material magnetic susceptibility on artifact severity in MRI was examined as well.
Elemental pieces with purity higher than 99.9 wt% were used as the starting materials. The master alloy ingots with desired nominal compositions were prepared by arc melting under a Ti-gettered argon atmosphere in a water-cooled copper hearth. The alloy ingots were re-melted several times to ensure compositional homogeneity. The BMG cylindrical samples of 4 mm in diameter were fabricated by the copper mold casting of the arc-melted alloys. The details are described elsewhere[33, 34]. Using the disc samples taken from the cross-sectional surface of the as-cast rods, the amorphous features of the as-cast cylinders were confirmed using X-ray diffraction (XRD) under a Rigaku D/max 2500 diffractometer (Rigaku, Tokyo, Japan) with monochromatic Cu Kα radiation. Commercial pure titanium (99.98%) and CoCrMo alloy were obtained in plate and bulk form, respectively. The cylinder specimens for MRI examination were machined into a desired dimension of 3 mm in diameter and 25 mm in length. For comparison, mechanical and thermal properties of the investigated BMGs are listed in Table 1.
| Table 1 Mechanical and thermal properties given in literatures for the investigated bulk metallic glasses |
Note: Au-based = Au49Ag5.5Pd2.3Cu26.9Si16.3, Cu-based = Cu50.4Ni5.6Ti31Zr13, Zr-based = Zr61Ti2Cu25Al12, Ti-based = Ti47Cu38Zr7.5Fe2.5Sn2Si1Ag2.
The volume magnetic susceptibility (χ v) of the investigated metals and phantom gel was measured using the MPMS-7S superconducting quantum interference device (SQUID, Quantum Design, San Diego, USA). A piece of sample of approximately 0.6 g in weight was taken from each metal. Then, the samples were polished and weighed. The measurements were conducted at room temperature and in the applied external magnetic field with a strength that increased from 0 to 3 T. The ratio of magnetic moment to applied magnetic field strength at 3 T was calculated as magnetic susceptibility. The measurements were repeated at least three times for a given alloy specimen.
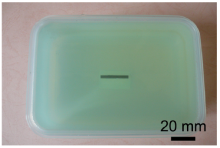
A polymethyl methacrylate container with inner dimensions of 135 mm × 90 mm × 55 mm was used, and filled with the nickel-doped agarose gel as a phantom. The phantom consisted of de-ionized, distilled water, a stock solution of 10 mmol/L Ni(NO3)2 and a 2% polysaccharide agarose powder (BIOWEST, Spain)[39]. A cylindrical BMG sample for MRI examination was embedded in the middle of the phantom, as shown in Fig. 1. The longitudinal axis of the phantoms was set both parallel and perpendicular to the static magnetic field (B0) under a laser beam guide to ensure the nearly identical location for every imaging acquisition.
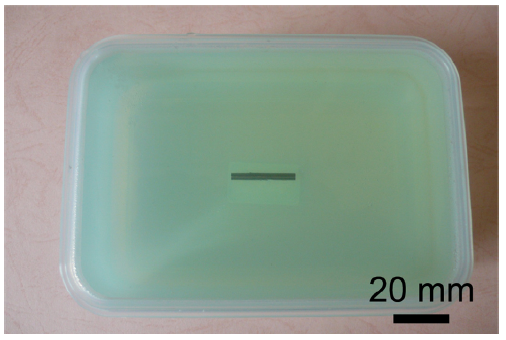 | Fig 1. Phantom used for in vitro MR examination showing that a cylinder specimen placed in the container center was embedded in the Ni-doped agarose gel. |
MRI was performed in a 3-T system (HDx Twinspeed; GE, NY, USA) using an 8-channel transmit/receive head coil. Two types of radiofrequency pulse sequences were applied for imaging as follows: (1) T1-weighted, FSE pulse sequence; repetition time (TR), 400 ms; echo time (TE), 27.3 ms; bandwidth (BW), 19.2 kHz; matrix size, 512 × 512; slice thickness, 1 mm; FOV, 150 mm × 150 mm; number of excitations (NEX), 3 times; (2) GRE pulse sequence; TR, 20 ms; TE, 5.5 ms; BW, 31.2 kHz; matrix size, 512 × 512; slice thickness, 1 mm; FOV, 150 × 150 mm; NEX, 4 times; flip angle 60° . The frequency encoding direction started from the head and travelled down to the feet (HF), parallel to B0 and the slicing moved from anterior to posterior.
According to the specification of ASTM F2119-07[40], the extent of the artifact in MRI was defined as the distance from the specimen boundary to the fringe of the artifact in which signal intensity (SI) varied within ± 30% with respect to the mean value of SI. To determine the mean SI, it was necessary to fix four ROIs in each MR image, which should be as close to the specimen as possible without involving any artifacts. This methodology were used in several studies, and rendered a comparison with other metals under similar evaluations of artifacts[41, 42, 43]. To avoid underestimation of artifacts, the imaging locations acquired through the specimens were chosen from a complete set of MR images that covered the largest or worst case of artifacts. Data in the images were processed and analyzed using the authorized data visualization software (Avizo Fire, VSG, USA). With the original 2D images at a number of individual slices, 3D renderings were constructed from all slices of MR images with the corresponding criteria.
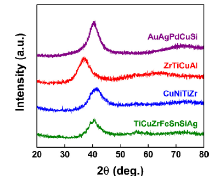
Fig. 2 shows XRD patterns taken from the cross-sectional surface of as-cast 4-mm-diameter BMGs for four alloys, including Au49Ag5.5Pd2.3Cu26.9Si16.3 (AuAgPdCuSi), Zr61Ti2Cu25Al12 (ZrTiCuAl), Cu50.4Ni5.6Ti31Zr13 (CuNiTiZr) and Ti47Cu38Zr7.5Fe2.5Sn2Si1Ag2 (TiCuZrFeSnSiAg). For the Au-, Zr- and Cu-based alloys rods, no Bragg peaks from any crystalline phase are detectable but a broad diffusive diffraction maximum at 2θ = 35° -50° , indicating the formation of monolithic metallic glasses. In the case of Ti-based alloy, however, trace amount of crystalline phase remains, showing visible diffraction lines overlapped with main diffusive peak, but the amorphous phase is predominant in structure.
 | Fig 2. XRD patterns taken from cross-section surface of as-cast BMG cylinders of 4 mm in diameter. |
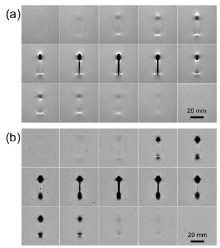
As the representative, Fig. 3 displays fifteen successive slices of 2D MR images around the ZrTiCuAl BMG cylinder, which were taken with FSE and GRE sequences as shown in Fig. 3(a) and (b), respectively. The specimen was set in an orientation parallel to B0. In the case of FSE, the artifacts consisted of the light region due to signal pile-up (hyperintensity) and the dark region caused by a signal loss (hypointensity), taken as a larger area fraction as shown in Fig. 3(a). The former could be the combination of in-plane and through-plane displacement of the signal from multiple locations to one location, while the latter could be due to dephasing or from the signal being shifted away from region[3]. In contrast, only dark artifacts appeared in the GRE-mode images, as shown in Fig. 3(b). Additionally, a blooming ball shaped intensity void at two ends of the cylinder was more remarkable in comparison with the FSE scenario. As suggested, such a shape distortion was caused by the inhomogeneous dipole field[5]. As indicated on all slices, the artifacts were distributed symmetrically from the geometric center of the specimen. Of the entire set of scanning images, the central image at the coronal plane exhibited the worst case, i.e., with the most severe artifacts.
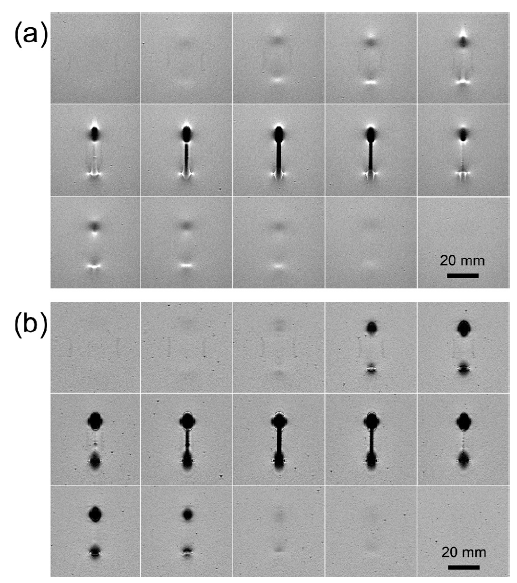 | Fig 3. Successive 2D MR images of (a) FSE and (b) GRE at 3-T field strength for a ZrTiCuAl BMG cylinder. The cylinder specimen in the phantom was parallel to B0. Slices were distributed symmetrically around the specimen center. |
In parallel, as the representative, Fig. 4(a) and (b) shows 2D MR images around the ZrTiCuAl BMG cylinder under a condition that the specimen was perpendicular to B0, which were also taken with FSE and GRE sequences, respectively. Similarly, the artifacts consisting of signal void and signal pile-up appeared in the FSE image, whereas only signal void is present in the GRE image. It is noteworthy that the change in orientation of the longitudinal axis of specimen from parallel to perpendicular results in more severe distortion and exaggeration in the artifacts, if the rest of imaging parameters were fixed. As shown in Fig. 4(a), both the signal void and geometric distortion were extended over a wide range around the cylindrical specimen and wrapped it up tight into an elliptical shape, together with high signal rims partially surrounding the area of signal loss. Nevertheless, such high signal rims do not take place in the GRE case, as shown in Fig. 4(b).
 | Fig 4. Successive 2D MR images of (a) FSE and (b) GRE at 3-T field strength for a ZrTiCuAl BMG cylinder. Cylinder specimen in the phantom was perpendicular to B0. Slices were distributed symmetrically around the specimen center. |
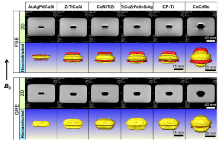
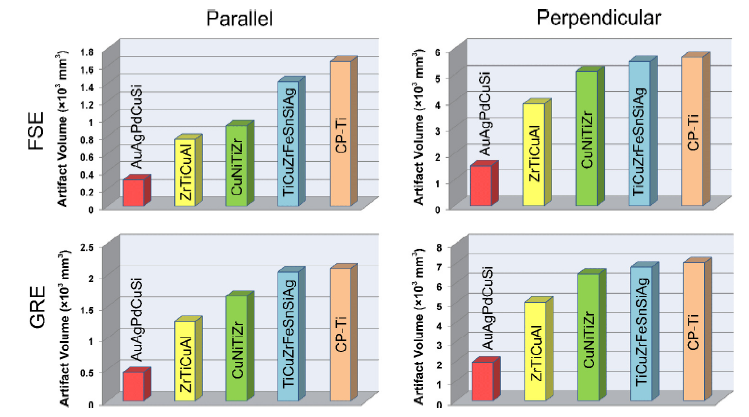
Using these successive 2D slices, a 3D configuration of the artifact was constructed for each metal. Fig. 5 and Fig. 6 show a group of reconstructed 3D images for six investigated metals, together with 2D images with the largest artifact. The longitudinal axes of the metal cylinders were parallel and perpendicular to the B0, respectively, as the two terminal conditions.
In contrast to the 2D images, the 3D image displayed a clear and complete artifact configuration. As shown in Fig. 5, the FSE case of the ZrTiCuAl as the typical, the signal void and signal pile-up were colored by the yellow and the red, respectively, which were equivalent to dark and light contrast in the 2D image, respectively. The artifact profile is less-changed in the middle of cylindrical sample. A significant distortion appears at the end of sample, showing a matchstick-like shape. The sections marked in the red alternatively appeared at the location of the top, middle and bottom of sample. It was noteworthy that the global shape of artifact configuration was markedly asymmetric along the longitudinal direction of cylinder from bottom to top. In the GRE case, the artifact configuration in 3D image displayed appearance of a “ dumbbell” shape. Similar to the 2D GRE images, signal pile-up as displayed by red area was unable to resolute even in the 3D GRE images.
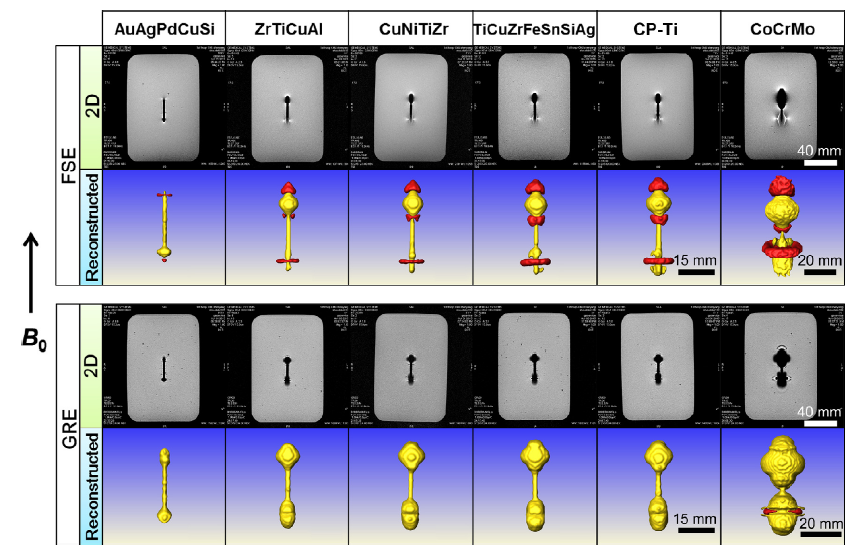 | Fig 5. Artifacts in 2D MR and reconstructed 3D images from six investigated metals. 2D MR images were taken in FSE (upper) and GRE (lower) at 3-T field strength. The direction of B0 indicated by the arrow was parallel to the specimen longitudinal axis. The 2D image was representative of maximum artifact in plane among the set of scanning slices. The 3D image was taken from anterior view, showing artifact configuration constructed in space. |
It was of interest to note that the configurations for the CuNiTiZr, TiCuZrFeSnSiAg and CP-Ti were substantially the same as that for the ZrTiCuAl, even in both imaging sequences. But, it is evident that CoCrMo alloy generated more appreciable distortions and artifacts in both the FSE and GRE images, in which the extent of image degradation was at a more detrimental level with respect to all BMGs and CP-Ti. Location of the signal hypointensity and hyperintensity were almost comparative to that of the ZrTiCuAl, CuNiTiZr, TiCuZrFeSnSiAg and CP-Ti. Nevertheless, the distortion location seems irrespective of distortion severity and artifacts volume. By carefully viewing, it is noticed that the signal pile-up, as displayed by red section in the 3D GRE image and surrounded by signal void, was slightly enhanced, as shown in Fig. 5 and Fig. 6, which did not occur at the remainder metals.
Owing to the diamagnetic feature, Au-based BMG manifests significantly distinct scenario. Its artifact configuration is completely reversed with respect to the other BMGs. As indicated, the artifacts signs such as signal locations, and the direction distortions are opposite to paramagnetic BMGs. Compared with the ZrTiCuAl BMG, matchstick-like configuration of artifact in reconstructed FSE image for the AuAgPdCuSi exhibits upside-down feature in all three dimensions, as shown in Fig. 5. As is well known, artifacts extent in MRI is mainly determined by homogeneity of static magnetic field. In the current situation, difference in magnetic susceptibility between adjacent substances, such as metals and Ni-doped agarose gel phantom, yielded inhomogeneous magnetic field, and then perturbation. The induced disturbance alters the static magnetic field, either by strengthening the field via pulling the static field lines into paramagnetic metal or by weakening the field via deflecting the lines away from diamagnetic metal[44]. This is a reason why the opposite artifacts configurations in space are generated by the diamagnetic and paramagnetic metals.
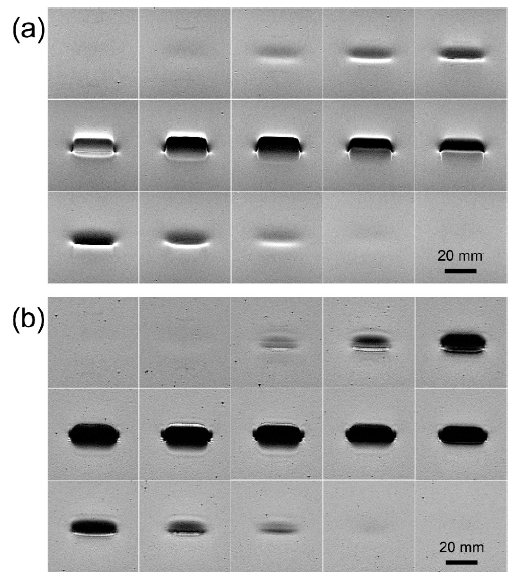
In a scenario where the longitudinal axes of cylinders were perpendicular to B0, the shapes and extents of either distortions or artifacts in the images were significantly different from the case parallel to B0 under identical imaging conditions, as shown in Fig. 6. Typically, artifact configuration in the FSE 3D image displayed a belly-shaped deformation, engulfing the cylindrical specimen, which made it impossible to delineate the contour and location of the specimen. As such, the configuration consisted of red and yellow parts that were associated with the hyperintensity and hypointensity of artifacts, respectively. As indicated, volume of yellow part was larger by approximately a factor of two to four with respect to the red part. In contrast, the hyperintensity effect is insignificant in the GRE 3D image, as shown by the nearly invisible response to the red-colored.
 | Fig 6. Artifacts of six investigated metals in FSE (upper) and GRE (lower) images at 3-T field strength presented in 2D and reconstructed 3D views. Longitudinal axis of specimen was orientated perpendicular to B0. 2D and reconstructed 3D images showing maximum extent and spatial configuration of artifacts. |
Similar to the situation that the cylinder specimens were set parallel to the B0, artifact appearance of the ZrTiCuAl, CuNiTiZr, and TiCuZrFeSnSiAg were nearly similar to that of the CP-Ti, as shown in Fig. 6. For the CoCrMo alloy, however, geometric distortion and spatial configuration of the artifact in the 2D and 3D images were much more severe with respect to the five remainders by orders of magnitude in terms of either maximum area or total volume.
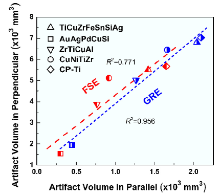
Fig. 7 displays a plot of total artifacts volume for the specimen set in parallel to B0 against the case in perpendicular to B0 for four BMGs and CP-Ti, which were imaged with both pulse sequences. It is indicated that the artifacts volume for the situation perpendicular to B0 generally scale with the volume parallel to B0. As a general trend, artifacts volume in the case perpendicular to B0 is approximately three-folds larger than that parallel to B0, irrespective of the imaging sequences. Such a relationship is meaningful to estimate the artifact severity when the orientation of cylinder-shape implants with respect to the B0 situates between the two terminal conditions.
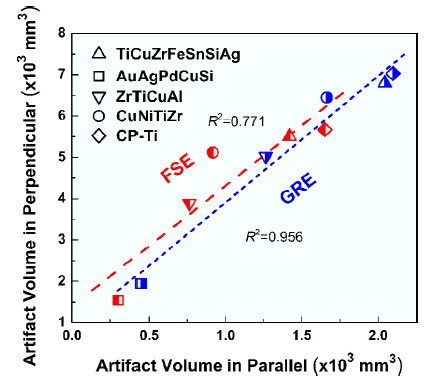 | Fig 7. Plot of total artifacts volume for the specimens imaged parallel to B0 against the case perpendicular to B0 for the investigated BMGs and CP-Ti. The images were acquired with FSE and GRE sequences at 3-T field strength. Dash lines represent the linear fitting of data. |
As is well documented[11, 43, 45, 46, 47, 48, 49, 50], severity of susceptibility artifact is strongly dependent of imaging pulse sequence. The FSE sequence, especially when performed for a short echo time, is less sensitive to susceptibility effects than the GRE, because the GRE mode is absent from multiple refocusing 180° radiofrequency pulses which can reverse intravoxel dephasing, therefore its signal attenuation is more apparent [45, 50, 51]. In this work, it was confirmed again that the artifact in GRE images was more severe than that in FSE images, as shown in Fig. 5 and Fig. 6. Using all data of the artifacts volume for four BMGs in two-sequence images under a given specimen conditions, we suggested a correlation of artifact volume between two sequences, independent of the materials and orientation to B0, as shown in Fig. 8. It is interesting to note that a good linear relationship between two situations was present. With linear fitting for these data, a master equation was attained as:

 | Fig 8. Plot of total artifact volumes in GRE sequence against ones in FSE sequence for BMG materials, with all of measured data, independent of orientation relative to B0. Straight line represents a fitting |
This indicates that, in an empirical sense, artifact volume of FSE images was approximately 20% less than that of GRE images. Such a simple correlation can be used as a helpful utility to estimate the artifact extent as long as any one sequenced image is available in the clinical diagnosis and material screening.
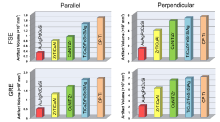
As noticed, among the six investigated metals, CoCrMo alloy exhibits the largest artifact extent, approximately 3-fold larger than that of CP-Ti as assessed by the total volume in 3D. On the contrary, Au-based BMG manifests the smallest artifact. Ti-based BMG is comparative to unalloyed crystalline CP-Ti. It is somewhat surprising to note that artifact extent of Zr-based BMG is approximately double larger than that of Au-based one, but is a half level of either CP-Ti or Ti-based BMG. While the Cu-based BMG situats between the Zr- and the Ti-based BMGs. For comparison, Fig. 9 shows a material ranking of artifact severity in terms of artifact volumes in 3D images under a given imaging conditions and orientation to B0, together with CP-Ti as control material.
 | Fig 9. Comparison of total artifact volumes in all imaging conditions of BMG materials with CP-Ti |
The measured χ v values of six investigated metals are listed in Table 2, as well as the value of agarose gel used as the phantom. As indicated, the χ v of agarose gel in the current work is the nearly identical as the value provided by Imai et al.[41], as well as to the value of human tissues [∼(-11.0 to -7.0 ppm)], whole blood (-7.9 ppm) and water at 37 ° C (-9.05 ppm), as summarized in Ref. [4]. Additionally, the χ v value of CP-Ti was comparable to the previously presented value, χ v = 182 ppm [4, 52]. The reason for minor difference between the data is probably caused by the differences in testing conditions or material purity. As noticed, the χ v of Au-based BMG is more negative than that of the Au-xPt-Nb (5 ≤ x ≤ 40) crystalline alloys with the χ v = -9 ppm [17]. The χ v value of CoCrMo alloy is five-fold larger than that of CP-Ti. Additionally, the χ v of Zr61Ti2Cu25Al12 BMG is comparative to that of Zr52.5Ti5Cu17.9Ni14.6Al10 BMG (χ v = 109 ppm), presented in Ref. [31]. It is surprising that the CuNiZrTi BMG exhibits the χ v greater than that of the ZrTiCuAl even though the based metal Cu is diamagnetic. Obviously, ferromagnetic Ni element in the CuNiZrTi alloy plays a predominant role.
| Table 2 Volume magnetic susceptibility of the investigated metals and gel used as phantom |
As is well-known, a difference in magnetic susceptibilities between adjacent objects, such as tissue and implanted metal, is a physical source to determine the severity of metal-induced artifacts in MRI. To reveal the correlation of artifact extent with the difference in magnetic susceptibilities given by Δ χ v = χ v -χ v', where χ v' is the value of agarose gel, Fig. 10 shows a plot of artifact volume in the MR images against Δ χ v. Because the χ v of the CoCrMo alloy is much greater than that of the others by several times, data in Fig. 10 only focused on the four BMGs, and then covered an interest range within 30-180 ppm for the Δ χ v.
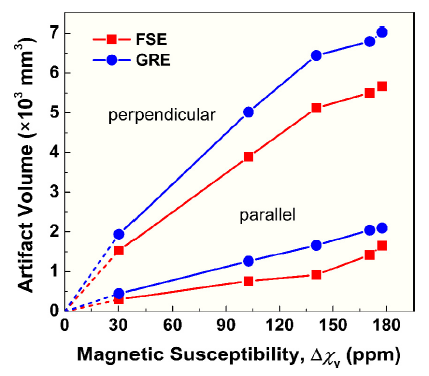 | Fig 10. Correlation of total artifacts volume in all imaging conditions with the difference in magnetic susceptibility between metals and agarose gel, Δ χ v, for four BMGs and CP-Ti |
As shown in Fig. 10, under acquisition conditions parallel to B0, the artifact extent was less sensitive to the increase in the χ v values, even though the artifact in GRE image was somewhat severe with respect to that in the FSE case. In contrast, under perpendicular acquisition, artifact extent exhibits a stronger dependence on the Δ χ v or material susceptibility. In other words, less artifact extent is consistent with lower susceptibility of the metal. As such, the Au- and Zr-based BMGs with a lower χ v exhibits more MRI-compatible even superior to the CP-Ti, let alone the CoCrMo alloy with a higher χ v. In this sense, it is conclusive that the element susceptibility is a predominant factor in designing the MRI-compatible alloys.
In addition, it was suggested that some physical properties such as elastic moduli of a BMG can be estimated by virtue of the approach that the averages of property can be weighted by volume fraction of constituent elements[53], namely, a “ rule of mixture” based on its structure feature of a chemically-uniform single phase. Similarly, susceptibility of the investigated BMGs can also be estimated with Wiedemann's additivity law[54]. This law is a consequence of the superposition principle for electrostatic and magnetic fields that specifies that the field at a given point in space is the linear vector sum of contributions from all sources. Wiedemann's law states that the overall magnetic susceptibility of a mixture is the weighted sum of the magnetic susceptibilities of the constituents, weighted according to their relative volumes of occupation of the mixture. Thus, in mathematical form it is written as:
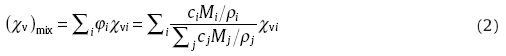
where φ i denotes the volume fraction of the mixture occupied by component i, whose volume magnetic susceptibility is χ vi, ci, Mi, ρ i and cj, Mj, ρ j, represent the molar fraction, molecular weight and density of component i and j, respectively.
As such, for the Au- and Zr-based BMGs containing diamagnetic and paramagnetic components, the χ v was calculated using Eq. (2), as listed in Table 2. As noted, the calculated χ v of Au- and Zr-based BMGs is 87% and 13% lower than the experimental value of respective -38 ppm and 95 ppm, which, however, are substantially comparative to the value of host metal such as -34 ppm for Au and 109 ppm for Zr. It implies that the magnetic susceptibility of a BMG is basically dominated by its host metals if no incorporation of ferromagnetic elements. In other words, the magnetic susceptibility of either diamagnetic or paramagnetic BMG estimated with Wiedemann's additivity law manifests an underestimation with respect to the measured real value. On the contrary, in the cases of Cu- and Ti-based BMGs containing ferromagnetic Ni (χ v = 6 × 10⁸ ppm) and Fe (χ v = 2 × 10¹¹ ppm) elements, Wiedemann's law is no longer adequate since the calculated χ v is dominated by the Ni and Fe because of their overwhelming susceptibility superiority.
In fact, metal-induced artifact occurred in MRI is mainly due to the formation of inhomogeneous static magnetic field, which causes large variations in signal encoding and then results in geometric distortion and associated contrast changes. Typically, such artifacts in the images are characterized by a low intensity region or void that is adjacent to and surrounded by regions of high signal intensity. As usual, severity of artifacts was evaluated in terms of contour and area of ROI in 2D in-plane images. Recently, a 3D-reconstruction approach of successive 2D images was suggested to attain the total volume of artifacts based on a series of scanning slices for a metallic object[41]. With respect to the 2D situation, the reconstructed 3D image has an advantage to present the stereographic configuration of artifacts under different views. Then, such an approach provides a powerful tool for material screening for MRI compatibility, namely, for designing the tissue-susceptibility matched metals.
Using the 3D image approach, we quantitatively gained the artifact extents and stereographic configuration of several typical BMGs with robust GFA and different magnetic features. Our findings indicate that the diamagnetic AuAgPdCuSi and paramagnetic ZrTiCuAl have an exceptional benefit in MRI compatibility with respect to the currently-served implant metals like the CP-Ti and CoCrMo alloy.
Similar to the conventional crystalline metals, the BMG materials also manifest effects of specimen orientation to B0 and of imaging pulse sequence on the artifact. As shown in Fig. 10, the most severe artifacts in the image took place in the situation both that the longitudinal axis of cylinder is perpendicular to the B0 and imaging with the GRE mode. Combined with these assessment conditions, the MRI compatibility of metals can be distinctly identified especially when the susceptibility of alloy was tuned toward the tissue-susceptibility matched level.
As is well understood, the FSE sequence, especially when performed for a short echo time, is less sensitive to susceptibility effects than the GRE, because the GRE mode lacks multiple refocusing 180° radiofrequency pulses which can reverse intravoxel dephasing, therefore its signal attenuation is more apparent. In this work, it is indicated that there exists a very good linear relationship of artifact volumes between the two sequences, independent of the materials and the specimen direction to B0, as presented as Eq. (1). Using such an empirical correlation, artifact volumes under the FSE and GRE could be roughly estimated by mutual conversion.
As usual, magnetic susceptibility of crystalline alloys is determined by its phase constitution and chemical composition[55]. For an alloy containing multi-phases, the nature of constituent phases is predominant factor. As indicated by Nomura et al.[56], as-cast binary Zr-Nb alloys in a composition range of 3-9 wt.% Nb showed a minimum magnetic susceptibility, which is associated with the appearance of athermal ω phase in β phase because the χ v of ω phase was lower than that of the α ' and β phases. Similar tendency is also the case in binary Zr-Mo alloy[57]. Tuning the Mo content in the alloy yields the formation of the α ' phase or β phase, co-existed with the ω phase, which gives a rise to an increase of the χ v of alloy since the magnitude of χ v of each phase is in a sequence of χ β > χ α ' > χ ω .
Furthermore, the χ v of a single-phase solid solution is mainly dominated by its chemical composition. As indicated[56], the χ v of a single β phase solid solution in Zr-Nb alloys linearly increases with the increase of Nb content in the alloy containing more than 20 wt.% Nb, because the χ v of pure Nb is higher than that of pure Zr. Moreover, in ternary Nb-xTa-2Zr (30 ≤ x ≤ 70 in wt.%) alloys of a single-phase solid solution, Li et al. [21] found that the χ v is substantially dependent upon the χ v of each element and their concentration, and the dependency roughly follows the Wiedemann's additivity law. On the other hand, noble Ag-Pd and Au-Pt alloys exhibit non-linear dependence of χ on alloy composition throughout entire composition range, and demonstrate a linear dependence only for a limited range of compositions [58, 59]. Recently, Astary et al.[16] indicated that the χ v of Cu-Sn (1.5 ≤ Sn ≤ 7.0 at.%) solid solution alloys varies linearly with Sn content, but this relationship cannot be described by a weighted-averaged of Cu and Sn susceptibilities. In other words, this alloy system displays deviation from “ idea” mixing behavior, specially an increase in diamagnetism after addition of paramagnetic Sn, due to a decrease in density of state or number of available states at a particular energy level.
In comparison with crystalline alloys, compositional dependence of χ v of diamagnetic and paramagnetic BMGs with an amorphous phase is far from understanding so far. As intuitively assumed, magnetic susceptibility of a BMG is also directly chemically-dependent, following the rule of a single-phase solid solution. In binary amorphous Zr-Cu/Ni alloys, however, Ristić et al.[30] showed that the measured magnetic susceptibility χ exp decreases approximately linearly with either diamagnetic Cu or ferromagnetic Ni content in the alloy, whereas in ferromagnetic Co-containing alloys, the χ remains constant within compositional range of 19 ≤ Co ≤ 35 at.%. Consequently, compositional dependence of χ for diamagnetic and paramagnetic BMGs is complex and needs more investigation to be justified. It is worthy to note that measured susceptibility of Zr52.5Ti5Cu17.9Ni14.6Al10 BMG was very comparative to that of its host element, zirconium, as presented by Horton[31]. This result is in accord with our current findings for the Au-, Zr- and Ti-based BMGs.
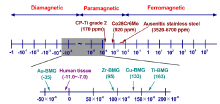
Considering the relationship between magnetic susceptibility and MRI compatibility, Schenck[4] summarized a susceptibility spectrum of the materials and tissue-related soft matters. By adding the current BMG's data, we upgraded this spectrum, as displayed in Fig. 11. Noticeably, the diamagnetic AuAgPdCuSi and paramagnetic ZrTiCuAl are much more tissue-susceptibility matched in comparison with archive metals. Ultimately, regarding a combination of advantages in mechanical properties with excellent MRI compatibility, the BMG materials are of interest to present the potential application especially associated with an interventional MRI for MRI guided surgeries, such as MR-guided biopsy where the minimized metallic needle artifacts in MRI is required.
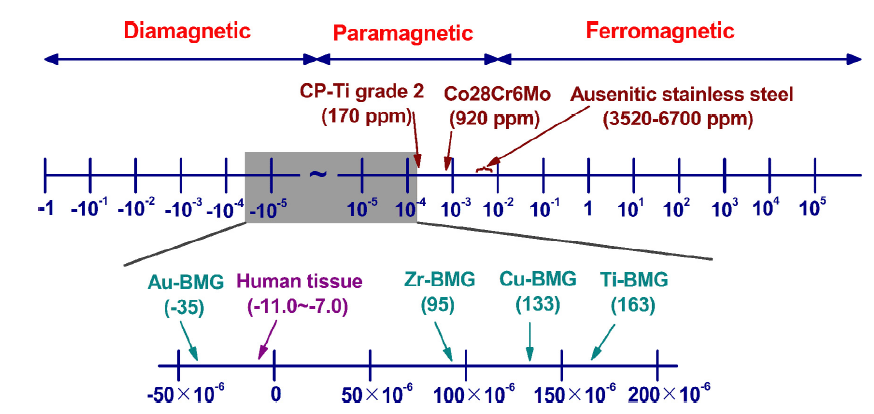 | Fig 11. Susceptibility spectrum. The upper diagram uses a logarithmic scale to indicate the full range of observed magnetic susceptibility values: It extends from χ v = -1.0 for superconductors to χ v > 100000 for soft ferromagnetic materials. The bottom diagram uses a linear scale (in ppm) to indicate the properties of some BMGs with |χ v| less than hundreds ppm. The susceptibilities of most human tissues are in the range from -7.0 to -11.0 ppm |
With nickel-doped agarose gel as tissue-equivalent phantom and MR imagining under FSE and GRE sequences, MRI compatibility of several BMGs was in vitro assessed in terms of the extent of susceptibility artifacts in the MR images. The artifact severity in MR images of the BMGs is significantly less than that of the CoCrMo alloy. The AuAgPdCuSi BMG manifested the smallest artifact among four BMGs, while the TiCuZrFeSnSiAg BMG is comparative to conventional crystalline CP-Ti. As such, MRI compatibility of BMGs can be ranked as a sequence of the AuAgPdCuSi, ZrTiCuAl, CuNiTiZr and TiCuZrFeSnSiAg alloys.
Based on the artifacts volume in 3D reconstructed images for the metallic cylinder specimens, it is suggested as a general trend that artifacts volume in the case perpendicular to B0 is approximately three-folds larger than that parallel to B0, irrespective of the imaging pulse sequences. At least under the current testing conditions for BMGs, artifact extent in FSE images was approximately 20% less than that in GRE images, independent of the materials and orientation to B0.
The dependence of magnetic susceptibility on artifact extent is also the case for the BMGs, of which the metal with lower susceptibility yields fewer artifacts due to the reduction of difference in magnetic susceptibilities between adjacent objects, such as tissue-like gel and metal. Under the condition of imaging acquisition setting the cylinder perpendicular to B0 and the GRE sequence, artifact extent exhibited a stronger dependence on the Δ χ v or material susceptibility. Nevertheless, the dependence of magnetic susceptibility on artifact extent does not simply follow a linear relationship within a range of Δ χ v = 30-180 ppm.
Finally, in comparison with conventional metals used for biomedical implants such as titanium/its alloys and CoCrMo alloys, some BMG materials exhibit remarkable advantage in MRI compatibility due to their lower magnetic susceptibility. It presents the potential application especially associated with an interventional MRI for MRI guided surgeries.
S.P. Wang and J. Xu were supported by the National Natural Science Foundation of China under Grant No. 51571192. The authors gratefully acknowledge the assistance in magnetic susceptibility tests from Dr. Xinguo Zhao.
| [1] |
|
| [2] |
|
| [3] |
|
| [4] |
|
| [5] |
|
| [6] |
|
| [7] |
|
| [8] |
|
| [9] |
|
| [10] |
|
| [11] |
|
| [12] |
|
| [13] |
|
| [14] |
|
| [15] |
|
| [16] |
|
| [17] |
|
| [18] |
|
| [19] |
|
| [20] |
|
| [21] |
|
| [22] |
|
| [23] |
|
| [24] |
|
| [25] |
|
| [26] |
|
| [27] |
|
| [28] |
|
| [29] |
|
| [30] |
|
| [31] |
|
| [32] |
|
| [33] |
|
| [34] |
|
| [35] |
|
| [36] |
|
| [37] |
|
| [38] |
|
| [39] |
|
| [40] |
|
| [41] |
|
| [42] |
|
| [43] |
|
| [44] |
|
| [45] |
|
| [46] |
|
| [47] |
|
| [48] |
|
| [49] |
|
| [50] |
|
| [51] |
|
| [52] |
|
| [53] |
|
| [54] |
|
| [55] |
|
| [56] |
|
| [57] |
|
| [58] |
|
| [59] |
|