W.Z. Tang, L. Yang, W. Zhu, Y.C. Zhou, J.W. Guo, C. Lu.Numerical Simulation of Temperature Distribution and Thermal-Stress Field in a Turbine Blade with Multilayer-Structure TBCs by a Fluid-Solid Coupling Method. Journal of Materials Science & Technology, 2016, 32(5): 452-458
Permissions
Copyright reserved, Editorial board of Journal of Materials Science & Technology
Received:2016-03-07
Numerical Simulation of Temperature Distribution and Thermal-Stress Field in a Turbine Blade with Multilayer-Structure TBCs by a Fluid-Solid Coupling Method
W.Z. Tang1,2, L. Yang1,2,*, W. Zhu1,3, Y.C. Zhou1,2,*, J.W. Guo4, C. Lu5
1. Key Laboratory of Key Film Materials and Application for Equipment (Hunan Province), School of Materials Science and Engineering, Xiangtan University, Xiangtan 411105, China
2 Key Laboratory of Low Dimensional Materials and Application Technology of Ministry of Education, School of Materials Science and Engineering, Xiangtan University, Xiangtan 411105, China
3 Hunan Provincial Key laboratory of Thin Film Materials and Devices, School of Materials Science and Engineering, Xiangtan University, Xiangtan 411105, China
4 School of Mechanical Engineering, Xiangtan University, Xiangtan 411105, China
5 Department of Mechanical Engineering, Curtin University, Perth, WA 6845, Australia
To study the temperature distribution and thermal-stress field in different service stages, a two-dimensional model of a turbine blade with thermal barrier coatings is developed, in which the conjugate heat transfer analysis and the decoupled thermal-stress calculation method are adopted. Based on the simulation results, it is found that a non-uniform distribution of temperature appears in different positions of the blade surface, which has directly impacted on stress field. The maximum temperature with a value of 1030 °C occurs at the leading edge. During the steady stage, the maximum stress of thermally grown oxide (TGO) appears in the middle of the suction side, reaching 3.75 GPa. At the end stage of cooling, the maximum compressive stress of TGO with a value of -3.5 GPa occurs at the leading edge. Thus, it can be predicted that during the steady stage the dangerous regions may locate at the suction side, while the leading edge may be more prone to failure on cooling.
Thermal barrier coatings (TBCs) as a kind of temperature-resistance material have been widely applied in super high temperature components in aircraft engines[1, 2, 3, 4]. Because of its low thermal conductivity, a temperature drop of 200 ° C can be realized through thermal isolation in TBCs with an inner cooling system[5, 6]. Geometric structure of TBCs is very complex, including three layers: top ceramic coating (TC), bond coating (BC) and superalloy substrate[7, 8, 9, 10]. In addition, a fourth layer, named as thermally grown oxide (TGO), is formed between TC and BC due to diffusion and reaction of oxygen and metal aluminum, the growth of which will result in stress concentration in a turbine blade[11, 12, 13]. Furthermore, TBCs are subjected to mechanical loads, thermal stresses, sintering and thermal shock during a long time exposure in service[14, 15, 16, 17, 18]. Due to huge differences between their physical, thermal and mechanical properties, thermal stresses developed in TBCs may result in coating failure. Doubtlessly, the high temperatures and stress concentrations play a critical role in crack initiation and propagation in TBCs[12, 19, 20], which directly leads to the failure of turbine blades. Therefore, the prediction of temperature distribution and thermal-stress field for a turbine blade with TBCs is essential and also desirable.
However, a turbine blade with TBCs usually has a very complex shape and structure, which makes it difficult for us to obtain temperature and thermal stress distributions in service by a theoretical model. Generally, analytical solutions are only available for some simplified models, in which TBCs usually have a simple shape[21, 22]. But these solutions are unavailable for a complex shape or structure associated with actual turbine blades. Therefore, it is necessary to find out a method to investigate the temperature distribution and thermal-stress field in a turbine blade.
In recent years, numerical simulations have been an attractive tool to study temperature distribution and stress field in a turbine blade with TBCs. Based on computational fluid dynamics (CFD) analysis and finite element method (FEM), a lot of work has been done. Temperature distribution with conjugate heat transfer analysis was discussed, where the compressible turbulent flow Navier-Stokes equations are solved simultaneously in the flow-field and the solid material of the structure[23, 24, 25, 26, 27, 28, 29, 30, 31, 32, 33, 34]. Sadowski and Golewski[26, 27, 35]studied the influence of TBCs and quantity of cooling channels on temperature distribution in turbine blades and the damage process as well as progressive fracturing of the most efforted cross sections of the blade by using the submodeling and XFEM technique. Staroselsky et al.[23] introduced a methodology involving transient thermal analysis and viscoplastic damage to estimate the remaining part life of turbine components. Furthermore, considerable work about stress evolution in turbine blades with TBCs has been done. For example, the generation and development of residual stress under cyclic loading were discussed[36], and the effect of interface asperity on the stress formation was investigated[37, 38, 39]. Ranjbar-Far et al.[40] and Biał as[5] studied the influence of the growth of TGO at high temperature on the stress distribution by using anisotropic swelling of the elements in the TGO layer. At the same time, many finite element models have been developed to simulate the crack initiation and propagation process of interface by using cohesive zone elements or a “ debond” technique[41, 42, 43]. However, previous work for predicting stress field in turbine blades mainly focused on simple models such as regular plate or columnar TBCs, in which uniform temperature boundary conditions were specified. There are a few attempts to investigate thermal stress distribution in aircraft turbine blade considering both realistic temperature distribution and TBCs' complex geometry structure.
In this work, a two-dimensional finite element model of a turbine blade with four-layer TBCs is built up to study the temperature distribution and thermal-stress level during different stages in service. It should be noted that this model is based on a certain type of actual turbine blade with one single internal cooling channel and the micro-holes for film cooling technique are not considered here. Based on the fluid-solid coupling method, the compressible turbulent flow as well as heat transfer in fluid domain is solved by CFD method and conjugate heat transfer method is employed to analyze the temperature distribution in solid domain by FEM. Then, the obtained temperature distribution is defined as a predefined variable to calculate stress field by FEM with a decoupled method involved, in which the non-elastic behavior of coating is taken into account. Finally, dangerous regions are predicted based on the obtained stress field.
2. Procedure Description
2.1. Conjugate heat transfer
In this case, the conjugate heat transfer consists of three physical aspects: flow and heat transfer in external flow field, internal cooling passages, and conduction within blade structure. During the conjugate procedure, the calculation of external and internal heat transfer is implemented together with blade conduction simultaneously. Based on the above simulations, the temperature distribution of a blade can be obtained. At the fluid-solid interface, the continuous boundary conditions of temperature and heat flux are specified by:
Tf=Ts (1)
(2)
where Tf and Ts are the temperatures of fluid and solid domain at the interface, respectively. kf and ks are the thermal conductivity coefficients of fluid and solid domain, and n is the normal direction of the interface. To enforce the continuity of temperature and heat flux, during the numerical procedure, the wall temperature calculated from solid domain is defined as the temperature boundary of fluid domain, and inversely, the heat flux calculated from fluid domain is defined as the heat flux boundary condition of solid domain.
In the present study, the external flow field and temperature field of solid domain are governed by compressible turbulent flow Navier-Stokes equations and solid thermal-conductivity equations, respectively. It is worth noting that the interaction between internal cooling gas and metal substrate of the blade are defined by surface film condition with sink temperature and convection heat transfer coefficient, which is not realized by directly solving inner flow field. To improve the simulation accuracy, a conjugate heat transfer procedure is carried out by using the software ABAQUS and FLUENT, which are used to simulate solid and fluid domains, respectively.
2.2. Calculation of thermal stress
Due to the mismatch of thermal expansion coefficient between different layers, thermal stress is generated in a turbine blade in high temperature environment. A decoupled method is adopted to calculate the stress field, in which the temperature distribution determines stress field and the influence of stress field on temperature distribution is ignored. During the elastic stage, the stress field of solid domain is governed by equilibrium equation, that is:
σ ij, i+Fi=0 (i, j=1, 2) (3)
where σ ij is the stress component, Fi is the body force. It is worth noting that the body force is not taken into account in this case (Fi = 0). Thus, we rewrite the form of Eq. (3) as
σ ij, i=0 (i, j=1, 2) (4)
and the elastic stress-displacement relationship is given by:
(5)
where ui is the displacement component, α is the thermal expansion coefficient, G is the shear module, is the lame constant and the term, and α Δ T, is the thermal strain.
As the plastic behavior occurs, the von Mises plasticity flow criterion is adopted to obtain plastic strain increments, which is given by:
(6)
where σ y is the yield stress. Based on the above plastic potential function, the flow rule is given by
(7)
where and are the components of plastic strain and stress deviator, respectively. dλ is a variable relating to the plastic strain rate.
Based on the conjugate heat transfer analysis, the temperature field is obtained by using the software ABAQUS and FLUENT, which is defined as a predefined variable in ABAQUS to simulate the thermal stress field.
3. Numerical Simulation
3.1. Numerical model for solid domain
3.1.1. Geometric description
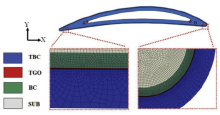
In the solid domain, a two-dimensional turbine blade with TBCs comprising four layers (TC, TGO, BC and Ni-based alloy substrate) is shown in Fig. 1. The thicknesses of TC, BC and substrate are 250 µ m, 100 µ m and 1.4 mm, respectively. Due to high temperature oxidation, TGO formed between TC and BC, whose maximum thickness can reach 10-20 µ m[44]. And the morphological instability of TGO is a fundamental source of failure in TBCs[37, 45]; however, it is experimentally verified that the TGO thickness has a negligible influence on stress in a thick ceramic coating (> 50 µ m)[46]. In this work, the TGO morphology is not taken into account. Instead, the flat interface is assumed and the TGO thickness is set to be 10 µ m. The geometric shapes and dimensions of TC, TGO, BC, and substrate were built up in ABAQUS and then merged together with preservation of interfaces between each layer. It is worth noting that the following assumptions were introduced: (1) each layer in TBCs was perfectly bonded without defect and crack; (2) only one cooling passage was considered; (3) the effects of porosity, creep, phase transformation, sintering of TBC and TGO growth were not taken into account; (4) the thermal convection or radiation was not considered and (5) the plane-strain assumption was adopted in the thermal-stress calculation.
Fig. 1. Illustration of the finite element model of a two-dimensional turbine blade with TBCs.
3.1.2. Material property
In the model mentioned above, each layer of a turbine blade with TBCs is considered as an isotropic and homogeneous material, and these material properties are listed in Table 1 and Table 2<sup>[47, 48], which are temperature-dependent. TC (8 wt% Y2O3-ZrO2 or 8YSZ) is modeled as an elastic body, whereas the BC (NiCrAlY)、TGO (α -Al2O3) and substrate (GH3030) are regarded as elastic-perfect plastic materials. The detailed chemical composition of Ni-based alloy substrate (GH3030) is given in Table 3. It is worth noting that, to limit stress to the experimental level[46, 49], TGO is allowed to undergo the stress relaxation at high temperature, which is realized by introducing the yield strength of TGO at the peak temperature[48]. At a lower temperature, TGO is like an elastic medium[48]. As listed in Table 2, the yield strength of TGO linearly decreases from 10 to 1 GPa with the increase of temperature from 800 to 1100 ° C. The effect of creep is important when the system is subjected to thermal loading cycles at high temperature[50, 51]. However, the effect of creep can be neglected here since it does not play any role in the stress redistribution due to one thermal loading cycle.
Table 1.
Table 1.
Table 1. Temperature-dependent material parameters for different layers
Substrate
BC
TGO
TC
Temperature range(° C)
20-1100
20-1100
20-1100
20-1100
Young's modulus (GPa)
220-120
200-110
400-320
48-22
Poisson'sratio
0.31-0.35
0.30-0.33
0.23-0.25
0.10-0.12
Thermal expansion coefficient (10-6/° C)
14.8-18.0
13.6-17.6
8.0-9.6
9.0-12.2
Thermal conductivity(W/(cm K))
0.88-0.69
0.058-0.170
0.10-0.04
0.020-0.017
Density(kg/m3)
8500
7380
3984
3610
Specific heat(J/(kg K))
440
450
755
505
Table 1. Temperature-dependent material parameters for different layers
3.1.3. Meshing and elements
In the conjugate heat transfer analysis, the 4-node linear heat transfer quadrilateral element (DC2D4) is adopted to mesh the model, while a 4-node bilinear plane strain quadrilateral element (CPE4R) is adopted to mesh this model in the thermal-stress calculation. It is worth noting that the huge thickness difference between each layer makes it difficult to generate smooth mesh. Thus, finer meshes are used around the TGO zone to decrease the aspect ratio (less than 3:1) of elements, which is used to improve the accuracy of simulation results (the inset in Fig. 1). A uniform mesh is used for TGO zone with 6 elements across the TGO thickness direction. With the purpose of guaranteeing a balance between efficiency and accuracy, the number of elements is limited to an acceptable value. In this case, the element number is 285, 756 during both conjugate heat transfer and thermal-stress analysis procedure, which meets the demand of mesh sensitivity.
3.1.4. Boundary conditions
The thermal boundary conditions at the outside surface of this blade are defined by temperature and heat flux calculated from fluid domain, while the interaction between internal cooling gas and metal substrate of this blade is described by surface film condition with convection heat transfer coefficient at 300 W/(m2° C) and sink temperature at 600 ° C. During the decoupled thermal-stress analysis, the mechanical boundary conditions are imposed on point A and point B located at the inner surface (Fig. 1): (1) point A is fixed, which cannot move along the x and y directions; and (2) the displacement in x direction of point B is free, but the displacement in y direction is constrained. Thus, the turbine blade can freely expand at high temperature environment without translation and rotation.
3.2. Numerical model for fluid domain
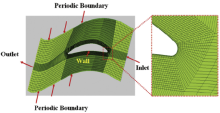
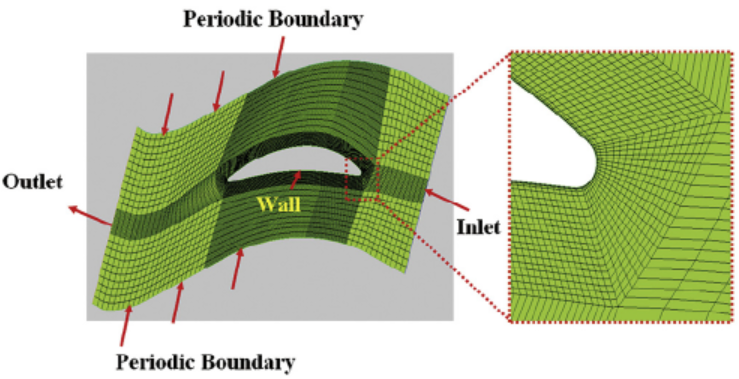
The two-dimensional external flow field model is shown in Fig. 2. The mesh generation in the fluid domain is realized by using the ANSYS software. To reduce the grid skewness and facilitate solving the boundary layer around the blade, O-grid type is utilized to mesh the whole external flow field. There are twenty two points in the fluid boundary layers, and the first point from the solid wall is located at the place where the dimensionless wall distance y + is less than or equal to unity for correct resolution of the viscous sub-layer. And the mesh is stretched away from the viscous wall using a stretching ratio between 0.8 and 2. The study on the mesh sensitivity reveals that an adequate accuracy can be achieved by using about 14, 123 elements of the fluid domain.
Fig. 2. Computational grid of external flow field of CFD model.
Table 2.
Table 2.
Table 2. Variations of yield strength with temperature for different layers
Temperature(° C)
Substrate(MPa)
BC(MPa)
TGO(MPa)
20
800
426
10000
200
800
412
10000
400
800
396
10000
600
800
362
10000
800
800
284
10000
1000
800
202
1000
1100
800
114
1000
Table 2. Variations of yield strength with temperature for different layers
Table 3.
Table 3.
Table 3. Detailed chemical composition of Ni-based alloy substrate (GH3030)
Ni
Cr
Fe
Si
Ti
Al
C
Mn
P
S
73-7
19-2
≤ 1.
≤ 0.
0.15-0.3
≤ 1.
≤ 0.1
≤ 0.
≤ 0.0
≤ 0.0
6
2
5
8
5
5
2
7
3
2
Table 3. Detailed chemical composition of Ni-based alloy substrate (GH3030)
In the fluid domain, the speed and temperature fields of external gas are obtained by solving the time-average Navier-Stokes equations, where the k-ε turbulence model with non-equilibrium wall function is used. The ideal gas assumption is used to model the exhaust gas. The fluid domain involves four different types of boundary conditions: the inlet boundary, the outlet boundary, the solid wall boundary and the periodic boundary. The total temperature (Tt, inlet), total pressure (Pt, inlet) and static pressure (Ps, inlet) are fixed at the inlet boundary, while an average static-pressure (Ps, outlet) is imposed at the outlet boundary. At the solid wall, a no-slip boundary condition is specified for velocity. For the periodic boundaries, the fluid-domain variables are duplicated for the periodic cell pairs or vertex pairs. The detailed parameters of boundary conditions for fluid domain are presented in Table 4.
Table 4.
Table 4.
Table 4. Detailed parameters of boundary conditions for fluid domain
Pt, inlet(MPa)
Ps, inlet(MPa)
Tt, inlet(° C)
Ps, outlet(MPa)
1.422
1.4
1080
0.7
Table 4. Detailed parameters of boundary conditions for fluid domain
4. Results and Discussion
4.1. Temperature distribution
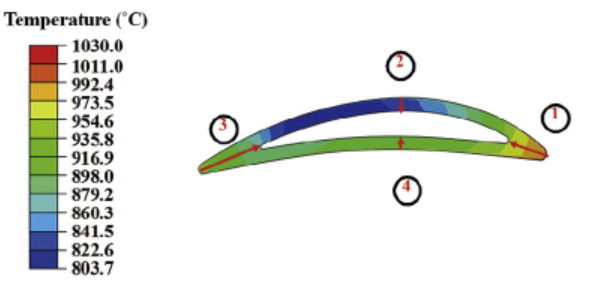
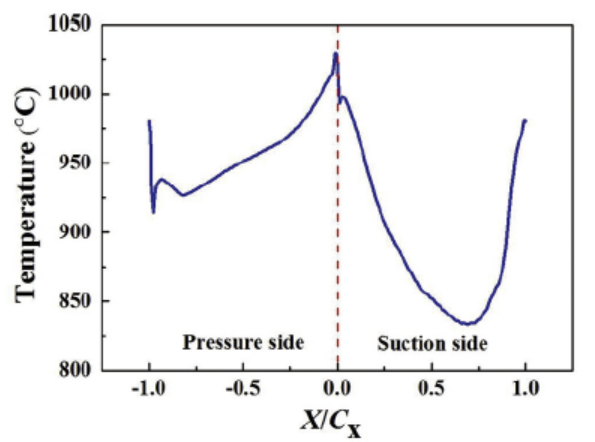
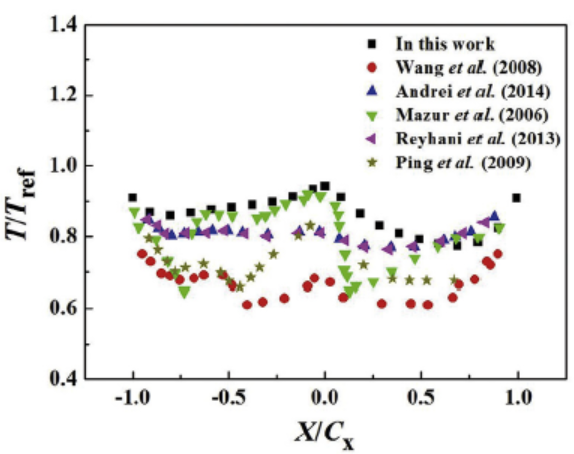
The contour plot of temperature distribution of the whole turbine blade with TBCs at the steady stage is shown in Fig. 3. And Fig. 4 shows the temperature distribution along the external surface of TC. X is the coordinate along the TBCs surface and Cx is the axial chord length. The non-dimensional lengths X/Cx with the values of 0 and ± 1 are the locations of leading and trailing edges, respectively. The locations of the suction and the pressure sides are 0.45 < X/Cx < 0.55 and -0.58 < X/Cx < -0.42. It is found that the temperatures at leading and trailing edge regions are higher than those at other regions, relatively. The maximum temperature with a value of 1030 ° C occurs at the leading edge. The trend of temperature distribution along the outside surface looks like “ valleys” , which is in good agreement with the available experimental data and numerical simulation results in literature (Fig. 5)[28, 31, 32, 34]. Furthermore, the temperature at the pressure side (-0.58 < X/Cx < -0.42) is slightly higher than that at the suction side (0.45 < X/Cx < 0.55). This may be attributed to the fact that the cooling area of the suction side is relatively larger than that of the pressure side.
Fig. 3. Contour plot of temperature of the turbine blade at the steady stage. The regions 1, 2, 3 and 4 are the typical locations, which are the leading edge, the suction side, the trailing edge and the pressure side, respectively.
Fig. 5. Comparison of the non-dimensional temperature distribution on the external surface of TBCs with that of literature.
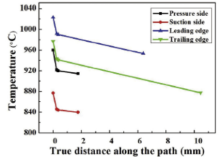
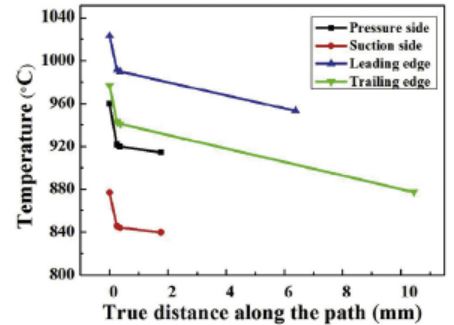
To show the difference of a temperature field in TBCs, temperature distribution along the paths (marked by red arrow in Fig. 3) in four typical regions, including the leading edge, the pressure side, the trailing edge and the suction side, is shown in Fig. 6. It appears that temperature distribution in the coating along thickness direction varies in different regions, ranging from 54 to 108 ° C. The magnitudes of temperature at the trailing edge regions are relatively higher than those of the other areas. This is consistent with the available results obtained by Ottens[52].
Fig. 6. Temperature distribution along the external surface of TBCs to the substrate at the four typical locations.
4.2. Stress distribution
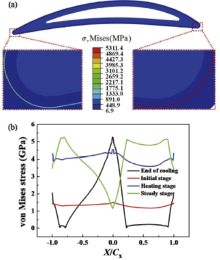
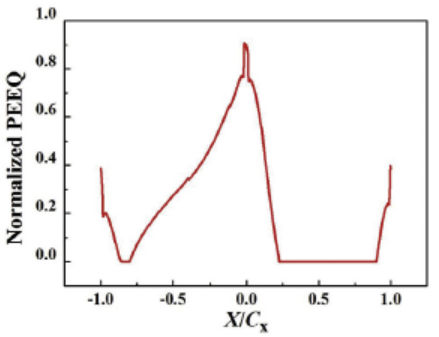
It is a fact that the aircraft engines in service generally experience four stages: initial stage, heating up stage, steady stage and cooling stage. The stress levels that resulted from thermal loading at different stages are different. As we all know, the stress state in TGO has an intimate connection with the crack initiation. Therefore, the stress evolution of TGO at each stage is important for predicting the dangerous regions. Due to the independence of the chosen coordinate system, the von Mises stress is widely adopted to characterize the general stress state. Furthermore, it can accurately reflect the stress level in a turbine blade. Fig. 7(a) presents the von Mises stress contour plot of the entire blade at the end of cooling. It is shown that the stress level in TGO is dramatically higher than that in other layers. Fig. 7(b) detailedly reveals the stress evolution in TGO at different stages. The value of von Mises stress in TGO increases with the rise of temperature during the heating up stage, whereas the magnitude of stress in the vicinity of trailing and leading edges abruptly decreases as the thermal loading comes to a steady stage. This phenomenon is attributed to stress relaxation due to the higher temperature at these regions. During the cooling stage, the stress in TGO decreases as the temperature reduces. It is worth noting that the residual stress value in the vicinity of trailing and leading edges has an abrupt increase at the end of cooling, which is attributed to the non-elastic strain at these regions. This phenomenon also can be explained by the distribution of normalized equivalent plastic strain (PEEQ) in TGO presented in Fig. 8. It is found that the value of PEEQ in the vicinity of trailing and leading edge is not zero. Moreover, the magnitude of PEEQ in TGO at the leading edge is larger than that at the trailing edge. The result is similar to the temperature distribution of the outside surface shown in Fig. 4. The reason is that non-uniform temperature distribution of the turbine blade has directly impact on thermal stress field.
Fig. 7. von Mises stress contour plot of the turbine blade at the end of cooling (a) and stress evolution in TGO at the different stages of thermal loading (b).
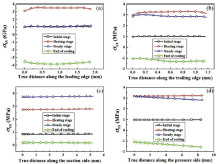
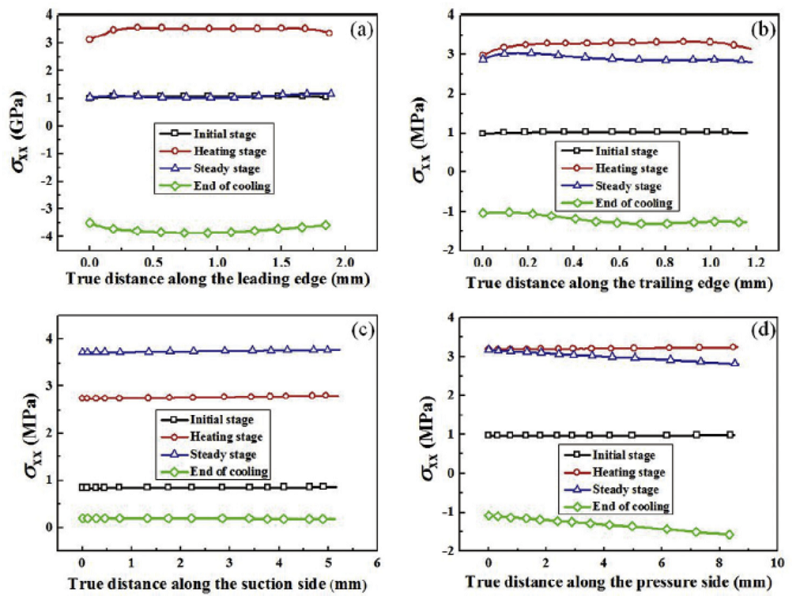
The stress evolution along X direction of the local coordinate system σ xxσ xx in TGO with the thermal loading history at the leading edge is shown in Fig. 9(a). The magnitude of stress keeps increasing during the heating up stage until this blade turns into steady state. Due to the stress relaxation, the magnitude of stress reduces to 1 GPa in the steady stage. As the thermal loading changes from steady into cooling stages, the stress σ xx declines with the decrease of temperature, varying from tension to compression. The stress inversion process can be reasonably explained by the thermal cycling, i.e., heating expansion and cooling contraction. At the end of cooling stage, the value of residual stress at the leading edge reaches -3.5 GPa, which is consistent with the experimental data [53, 54]. Lee et al.[53] have systematically investigated the residual stress in TGO, which is in the range of -2.0 to -4.5 GPa. Such a huge compressive stress causes the interfacial instability, which may trigger a crack in TGO. As shown in Fig. 9(b), the evolution of stress at the trailing edge has a trend similar to that of the leading edge. Compared with the stress state during the heating up stage, both the stress levels drop in the steady stage. And the value of the stress at the trailing edge is larger than that at the leading edge. However, the magnitude of residual stress at the trailing edge is less than that at the leading edge at the end of the cooling stage. The stress evolution in the middle of the suction and the pressure sides is displayed in Fig. 9(c) and (d). The variation of stress in TGO at different thermal loading stages is almost the same as that of leading and trailing edges but their values are different. It is worth noting that as the thermal loading changes from heating up into steady stages, the magnitude of stress in the middle of the pressure side slightly decreases, while the opposite phenomenon occurs in the middle of the suction side and the value of stress increases from 2.75 to 3.75 GPa. This difference is attributed to the fact that the temperature at the pressure side is relatively higher than that at the suction side during the steady stage. According to the stress evolution with thermal loading at four typical positions, it is found that the maximum tensile stress with a value of 3.75 GPa occurs in the middle of the suction side during the steady stage, which may lead to the initiation of cracks in a turbine blade when the aircraft engine is in steady flight. The maximum residual compressive stress with a value of -3.5 GPa occurs at the leading edge at the end of cooling, which may lead to crack initiation and propagation due to interfacial instability, eventually causes the coating spallation.
Fig. 9. Stress evolution along X direction of the local coordinate system in TGO with the thermal loading history at the four typical locations: (a) leading edge; (b) trailing edge; (c) suction side and (d) pressure side. In the local coordinate system, X and Y directions are parallel and perpendicular to the interface of TBCs, respectively.
It should be noted that there are some limitations in this model comparing to real turbine blades under the working condition: (1) the centrifugal forces of the blades as well as forces caused by springy vibrations of the blades are not considered; (2) the effects of cooling film holes are not included; and (3) the damage of TBC, such as cracking of the TBC, is not taken into account. Due to the above limitations, the magnitude of temperature and thermal-stress fields is more or less different from that of real turbine blades under the working condition. Therefore, these will be important topics in modeling a three-dimensional turbine blade with TBCs in a future study.
5. Conclusions
A two-dimensional numerical model of a turbine blade with TBCs has been developed to investigate the temperature distribution and thermal-stress field by a fluid-solid coupling method. The temperature distribution is obtained by using the conjugate heat transfer analysis method, in which the compressible turbulent flow as well as heat transfer in the fluid domain is solved by CFD method and the heat conduction in the solid domain is solved by FEM. Then, the obtained temperature distribution is defined as predefined variable to calculate the thermal-stress field by FEM. The main conclusions include:
(1)A non-uniform distribution of temperature appears in different positions of the turbine blade surface. The temperatures at leading and trailing edge regions are relatively higher than those of other regions. The maximum temperature with a value of 1030 ° C is located at the leading edge.
(2)The non-uniform temperature distribution of a turbine blade has a significant effect on the thermal-stress field. During the steady stage, the stress levels of TGO at those regions exposed to higher temperature, such as the leading and trailing edges, are lower than those at other regions (suction and pressure sides) because of the stress relaxation in high temperature. Whereas, the residual stress values in the vicinity of trailing and leading edges have an abrupt increase at the end of cooling, which is attributed to the non-elastic strain at these regions.
(3)The stress evolution is dependent on the thermal loading stages. The maximum stress along X direction of the local coordinate system in TGO with a value of 3.75 GPa occurs in the middle of the suction side during the steady stage. For the cooling stage, the maximum compressive stress of TGO with a value of -3.5 GPa occurs at the leading edge. Based on the thermal-stress distribution, it can be predicted that the dangerous regions may be located at the suction side for the highest stress level during the steady stage, while the leading edge may be more prone to failure at the cooling stage.
AcknowledgementsAcknowledgments
This work was supported by the National Natural Science Foundation of China (Grant Nos. 51172192, 11272275 and 11002122), the Natural Science Foundation of Hunan Province (Grant No. 11JJ4003) and the Doctoral Scientific Research Foundation of Xiangtan University (Grant Nos. KZ08022, KZ03013 and KF20140303).
The authors have declared that no competing interests exist.
M. Ranjbar-Far, J. Absi, G. Mariaux, F. Dubois, Mater. Des. 31(2010) 772-781. [Cited within:2]
[38]
M. Ahrens, R. Vaßen, D. Stöver, Surf. Coat. Technol. 161(2002) 26-35. [Cited within:1]
[39]
W. Zhu, M. Cai, L. Yang, J. W. Guo, Y. C. Zhou, C. Lu, Surf. Coat. Technol. 276(2015)160-167. [Cited within:1]
[40]
M. Ranjbar-Far, J. Absi, S. Shahidi, G. Mariaux, Mater. Des. 32(2011)728-735. [Cited within:1]
[41]
T. S. Hille, T. J. Nijdam, A. S. J. Suiker, S. Turteltaub, W. G. Sloof, Acta Mater. 57(2009)2624-2630. [Cited within:1]
[42]
M. Ranjbar-Far, J. Absi, G. Mariaux, D. S. Smith, Mater. Des. 32(2011) 4961-4969. [Cited within:1]
[43]
M. Ranjbar-Far, J. Absi, G. Mariaux, J. Therm. Spray Technol. 21(2012) 1234-1244. [Cited within:1]
[44]
E. P. Busso, H. E. Evans, Z. Q. Qian, M. P. Taylor, Acta Mater. 58(2010) 1242-1251. [Cited within:1]
[45]
E. P. Busso, Z. Q. Qian, M. P. Taylor, H. E. Evans, Acta Mater. 57(2009) 2349-2361. [Cited within:1]
[46]
X. Wang, P. Xiao, Acta Mater. 52(2004) 2591-2603. [Cited within:2]
[47]
Y. C. Zhou, T. Hashida, Int. J. Fatigue24 (2002) 407-417. [Cited within:1]
[48]
J. Rösler, M. Bäker, K. Aufzug, Acta Mater. 52(2004) 4809-4817. [Cited within:3]
[49]
B. W. Veal, A. P. Paulikas, P. Y. Hou, Nat. Mater. 5(2006) 349-351. [Cited within:1]
[50]
J. Ding, F. X. Li, K. J. Kang, Surf. Coat. Technol. 204(2009) 157-164. [Cited within:1]
[51]
M. T. Hernand ez, A. M. Karlsson, M. Bartsch, Surf. Coat. Technol. 203(2009)3549-3558. [Cited within:1]
[52]
H. Ottens, Review of aeronautical fatigue investigation in The Netherland s during the period March 1997-March 1999, Nationaal Lucht-en Ruimtevaartlaboratorium NLR, 1999. [Cited within:1]
[53]
G. Lee, A. Atkinson, A. Selçuk, Surf. Coat. Technol. 201(2006) 3931-3936. [Cited within:2]
[54]
A. Selcuk, A. Atkinson, Acta Mater. 51(2003) 535-549. [Cited within:1]
1
2002
0.0
0.0
... IntroductionThermal barrier coatings (TBCs) as a kind of temperature-resistance material have been widely applied in super high temperature components in aircraft engines[1, 2, 3, 4] ...
1
0.0
0.0
... IntroductionThermal barrier coatings (TBCs) as a kind of temperature-resistance material have been widely applied in super high temperature components in aircraft engines[1, 2, 3, 4] ...
1
0.0
0.0
... IntroductionThermal barrier coatings (TBCs) as a kind of temperature-resistance material have been widely applied in super high temperature components in aircraft engines[1, 2, 3, 4] ...
1
0.0
0.0
... IntroductionThermal barrier coatings (TBCs) as a kind of temperature-resistance material have been widely applied in super high temperature components in aircraft engines[1, 2, 3, 4] ...
2
0.0
0.0
... C can be realized through thermal isolation in TBCs with an inner cooling system[5, 6] ...
... as[5] studied the influence of the growth of TGO at high temperature on the stress distribution by using anisotropic swelling of the elements in the TGO layer ...
1
0.0
0.0
... C can be realized through thermal isolation in TBCs with an inner cooling system[5, 6] ...
1
0.0
0.0
... Geometric structure of TBCs is very complex, including three layers: top ceramic coating (TC), bond coating (BC) and superalloy substrate[7, 8, 9, 10] ...
1
0.0
0.0
... Geometric structure of TBCs is very complex, including three layers: top ceramic coating (TC), bond coating (BC) and superalloy substrate[7, 8, 9, 10] ...
1
2011
0.0
0.0
... Geometric structure of TBCs is very complex, including three layers: top ceramic coating (TC), bond coating (BC) and superalloy substrate[7, 8, 9, 10] ...
1
0.0
0.0
... Geometric structure of TBCs is very complex, including three layers: top ceramic coating (TC), bond coating (BC) and superalloy substrate[7, 8, 9, 10] ...
1
0.0
0.0
... In addition, a fourth layer, named as thermally grown oxide (TGO), is formed between TC and BC due to diffusion and reaction of oxygen and metal aluminum, the growth of which will result in stress concentration in a turbine blade[11, 12, 13] ...
2
0.0
0.0
... In addition, a fourth layer, named as thermally grown oxide (TGO), is formed between TC and BC due to diffusion and reaction of oxygen and metal aluminum, the growth of which will result in stress concentration in a turbine blade[11, 12, 13] ...
... Doubtlessly, the high temperatures and stress concentrations play a critical role in crack initiation and propagation in TBCs[12, 19, 20], which directly leads to the failure of turbine blades ...
1
2006
0.0
0.0
... In addition, a fourth layer, named as thermally grown oxide (TGO), is formed between TC and BC due to diffusion and reaction of oxygen and metal aluminum, the growth of which will result in stress concentration in a turbine blade[11, 12, 13] ...
1
0.0
0.0
... Furthermore, TBCs are subjected to mechanical loads, thermal stresses, sintering and thermal shock during a long time exposure in service[14, 15, 16, 17, 18] ...
1
0.0
0.0
... Furthermore, TBCs are subjected to mechanical loads, thermal stresses, sintering and thermal shock during a long time exposure in service[14, 15, 16, 17, 18] ...
1
0.0
0.0
... Furthermore, TBCs are subjected to mechanical loads, thermal stresses, sintering and thermal shock during a long time exposure in service[14, 15, 16, 17, 18] ...
1
0.0
0.0
... Furthermore, TBCs are subjected to mechanical loads, thermal stresses, sintering and thermal shock during a long time exposure in service[14, 15, 16, 17, 18] ...
1
0.0
0.0
... Furthermore, TBCs are subjected to mechanical loads, thermal stresses, sintering and thermal shock during a long time exposure in service[14, 15, 16, 17, 18] ...
1
2005
0.0
0.0
... Doubtlessly, the high temperatures and stress concentrations play a critical role in crack initiation and propagation in TBCs[12, 19, 20], which directly leads to the failure of turbine blades ...
1
2015
0.0
0.0
... Doubtlessly, the high temperatures and stress concentrations play a critical role in crack initiation and propagation in TBCs[12, 19, 20], which directly leads to the failure of turbine blades ...
1
0.0
0.0
... Generally, analytical solutions are only available for some simplified models, in which TBCs usually have a simple shape[21, 22] ...
1
0.0
0.0
... Generally, analytical solutions are only available for some simplified models, in which TBCs usually have a simple shape[21, 22] ...
2
2015
0.0
0.0
... Temperature distribution with conjugate heat transfer analysis was discussed, where the compressible turbulent flow Navier-Stokes equations are solved simultaneously in the flow-field and the solid material of the structure[23, 24, 25, 26, 27, 28, 29, 30, 31, 32, 33, 34] ...
... [23] introduced a methodology involving transient thermal analysis and viscoplastic damage to estimate the remaining part life of turbine components ...
1
0.0
0.0
... Temperature distribution with conjugate heat transfer analysis was discussed, where the compressible turbulent flow Navier-Stokes equations are solved simultaneously in the flow-field and the solid material of the structure[23, 24, 25, 26, 27, 28, 29, 30, 31, 32, 33, 34] ...
1
2015
0.0
0.0
... Temperature distribution with conjugate heat transfer analysis was discussed, where the compressible turbulent flow Navier-Stokes equations are solved simultaneously in the flow-field and the solid material of the structure[23, 24, 25, 26, 27, 28, 29, 30, 31, 32, 33, 34] ...
2
0.0
0.0
... Temperature distribution with conjugate heat transfer analysis was discussed, where the compressible turbulent flow Navier-Stokes equations are solved simultaneously in the flow-field and the solid material of the structure[23, 24, 25, 26, 27, 28, 29, 30, 31, 32, 33, 34] ...
... Sadowski and Golewski[26, 27, 35] studied the influence of TBCs and quantity of cooling channels on temperature distribution in turbine blades and the damage process as well as progressive fracturing of the most efforted cross sections of the blade by using the submodeling and XFEM technique ...
2
0.0
0.0
... Temperature distribution with conjugate heat transfer analysis was discussed, where the compressible turbulent flow Navier-Stokes equations are solved simultaneously in the flow-field and the solid material of the structure[23, 24, 25, 26, 27, 28, 29, 30, 31, 32, 33, 34] ...
... 5) [28, 31, 32, 34] ...
1
0.0
0.0
... Temperature distribution with conjugate heat transfer analysis was discussed, where the compressible turbulent flow Navier-Stokes equations are solved simultaneously in the flow-field and the solid material of the structure[23, 24, 25, 26, 27, 28, 29, 30, 31, 32, 33, 34] ...
1
0.0
0.0
... Temperature distribution with conjugate heat transfer analysis was discussed, where the compressible turbulent flow Navier-Stokes equations are solved simultaneously in the flow-field and the solid material of the structure[23, 24, 25, 26, 27, 28, 29, 30, 31, 32, 33, 34] ...
2
2014
0.0
0.0
... Temperature distribution with conjugate heat transfer analysis was discussed, where the compressible turbulent flow Navier-Stokes equations are solved simultaneously in the flow-field and the solid material of the structure[23, 24, 25, 26, 27, 28, 29, 30, 31, 32, 33, 34] ...
... 5) [28, 31, 32, 34] ...
2
0.0
0.0
... Temperature distribution with conjugate heat transfer analysis was discussed, where the compressible turbulent flow Navier-Stokes equations are solved simultaneously in the flow-field and the solid material of the structure[23, 24, 25, 26, 27, 28, 29, 30, 31, 32, 33, 34] ...
... 5) [28, 31, 32, 34] ...
1
0.0
0.0
... Temperature distribution with conjugate heat transfer analysis was discussed, where the compressible turbulent flow Navier-Stokes equations are solved simultaneously in the flow-field and the solid material of the structure[23, 24, 25, 26, 27, 28, 29, 30, 31, 32, 33, 34] ...
2
0.0
0.0
... Temperature distribution with conjugate heat transfer analysis was discussed, where the compressible turbulent flow Navier-Stokes equations are solved simultaneously in the flow-field and the solid material of the structure[23, 24, 25, 26, 27, 28, 29, 30, 31, 32, 33, 34] ...
... 5) [28, 31, 32, 34] ...
1
0.0
0.0
... Sadowski and Golewski[26, 27, 35] studied the influence of TBCs and quantity of cooling channels on temperature distribution in turbine blades and the damage process as well as progressive fracturing of the most efforted cross sections of the blade by using the submodeling and XFEM technique ...
1
0.0
0.0
... For example, the generation and development of residual stress under cyclic loading were discussed[36], and the effect of interface asperity on the stress formation was investigated[37, 38, 39] ...
2
0.0
0.0
... For example, the generation and development of residual stress under cyclic loading were discussed[36], and the effect of interface asperity on the stress formation was investigated[37, 38, 39] ...
... And the morphological instability of TGO is a fundamental source of failure in TBCs[37, 45] ...
1
0.0
0.0
... For example, the generation and development of residual stress under cyclic loading were discussed[36], and the effect of interface asperity on the stress formation was investigated[37, 38, 39] ...
1
0.0
0.0
... For example, the generation and development of residual stress under cyclic loading were discussed[36], and the effect of interface asperity on the stress formation was investigated[37, 38, 39] ...
1
0.0
0.0
... [40] and Bia#cod#x00142 ...
1
0.0
0.0
... technique[41, 42, 43] ...
1
0.0
0.0
... technique[41, 42, 43] ...
1
0.0
0.0
... technique[41, 42, 43] ...
1
0.0
0.0
... m[44] ...
1
0.0
0.0
... And the morphological instability of TGO is a fundamental source of failure in TBCs[37, 45] ...
2
0.0
0.0
... m)[46] ...
... It is worth noting that, to limit stress to the experimental level[46, 49], TGO is allowed to undergo the stress relaxation at high temperature, which is realized by introducing the yield strength of TGO at the peak temperature[48] ...
1
2002
0.0
0.0
... In the model mentioned above, each layer of a turbine blade with TBCs is considered as an isotropic and homogeneous material, and these material properties are listed in Table 1 and Table 2[47, 48], which are temperature-dependent ...
3
0.0
0.0
... In the model mentioned above, each layer of a turbine blade with TBCs is considered as an isotropic and homogeneous material, and these material properties are listed in Table 1 and Table 2[47, 48], which are temperature-dependent ...
... It is worth noting that, to limit stress to the experimental level[46, 49], TGO is allowed to undergo the stress relaxation at high temperature, which is realized by introducing the yield strength of TGO at the peak temperature[48] ...
... At a lower temperature, TGO is like an elastic medium[48] ...
1
0.0
0.0
... It is worth noting that, to limit stress to the experimental level[46, 49], TGO is allowed to undergo the stress relaxation at high temperature, which is realized by introducing the yield strength of TGO at the peak temperature[48] ...
1
0.0
0.0
... The effect of creep is important when the system is subjected to thermal loading cycles at high temperature[50, 51] ...
1
0.0
0.0
... The effect of creep is important when the system is subjected to thermal loading cycles at high temperature[50, 51] ...
1
1999
0.0
0.0
... This is consistent with the available results obtained by Ottens[52] ...
2
0.0
0.0
... 5 GPa, which is consistent with the experimental data [53, 54] ...
... [53] have systematically investigated the residual stress in TGO, which is in the range of -2 ...
1
0.0
0.0
... 5 GPa, which is consistent with the experimental data [53, 54] ...
Numerical Simulation of Temperature Distribution and Thermal-Stress Field in a Turbine Blade with Multilayer-Structure TBCs by a Fluid-Solid Coupling Method
[W.Z. Tang1,2, L. Yang1,2,*, W. Zhu1,3, Y.C. Zhou1,2,*, J.W. Guo4, C. Lu5]


 , W. Zhu