


Corrosion Resistance of Graphene-Reinforced Waterborne Epoxy Coatings
[Shuan Liu, Lin Gu , Haichao Zhao, Jianmin Chen, Haibin Yu]
, Haichao Zhao, Jianmin Chen, Haibin Yu]
|
|


Graphene (G) was dispersed uniformly in water and used as an inhibitor in waterborne epoxy coatings. The effect of dispersed G on anticorrosion performance of epoxy coatings was evaluated. The composite coatings displayed outstanding barrier properties against H2O molecule compared to the neat epoxy coating. Open circuit potential (OCP), Tafel and electrochemical impedance spectroscopy (EIS) analysis confirmed that the corrosion rate exhibited by composite coatings with 0.5 wt% G was an order of magnitude lower than that of neat epoxy coating. Salt spray test results revealed superior corrosion resistance offered by the composite coating.
Waterborne coating has gained increasing attention for metal protection due to the strict regulations in the use of volatile organic compound (VOC). However, its anticorrosion performance is farther inferior to solvent coating because the hydrophilic groups were retained in the coating during the film formation process, decreasing the shielding ability of vapor diffusion and moisture-resistant ability[1, 2, 3]. Thus, the addition of corrosion inhibitors or fillers is necessary to improve the corrosion resistance of the waterborne coating[4, 5].
In the past decade, graphene (G), a novel two-dimensional material with single layer having a thickness of around 0.335 nm and a diameter ranging from several microns to several hundred microns, has attracted increasing attention from academic and industrial fields due to its unique nanostructure, excellent physical properties, large specific surface areas, super hydrophobic property and good compatibility with polymer matrix[6, 7, 8]. It has been reported that G exhibited extraordinary corrosion resistance and self-lubricant characteristics due to its unique flexible graphitic layers, super-hydrophobic characteristics, extremely high strength, and easy shear capability on its densely packed and atomically smooth surface[9, 10]. Sun et al.[11]fabricated G coating as a solid-phase microextraction fiber bonded onto stainless steel wire, and found that this fiber exhibited high thermal and chemical stability. Shen et al.[12] proved that the wear resistance and tribological performance of epoxy coating was remarkably strengthened by adding only a small amount of G. Wang et al.[13] provided a “ green” strategy for fabricating the G-reinforced polyurethane coatings by sol-gel method, and found that a 86% improvement of Young's modulus and a 71% increase in tensile strength of polyurethane was reached by adding 2.0 wt% G. Many experimental studies further proved that G film could be used as an efficient anticorrosive coating on the surface of metal matrix by chemical vapor deposition (CVD)[14, 15], and the G films could work as a barrier to corrosive media such as O2 and H2O molecules. Unfortunately, in the long run, the anticorrosion properties of the G film were decayed, due to the large number of defects of the G film grown by CVD method[16, 17].
Another way for fabrication of G-based coatings is incorporating G nanosheets into polymer matrix to form composite coatings, which was found to benefit from the barrier and super-hydrophobic properties of G. However, G nanosheets easily aggregate together due to their strong van der Waals forces and high specific surface areas, which makes it difficult to achieve homogenous dispersion of G in polymer matrix[18]. Many works on chemical modification approach have been reported to improve dispersion of G in composite coatings[19, 20, 21]. For example, Chang et al. reported on the preparation of polyimide grafted G via a thermal imidization reaction. The well-dispersed G/polyimide coatings provided advanced corrosion protection of cold-rolled steel as compared to neat polyimide coating[19]. Compared to chemical modification, simply dispersing G into polymer matrix is particularly advantageous due to less damage to G, high efficiency and ease of preparation. In the present work, we fabricated composite coatings with waterborne epoxy coating as the organic matrix and uniform dispersed G as anticorrosive barrier. To avoid the agglomeration of G, G was dispersed by sodium polyacrylate in aqueous solution, and a few anti-sediment agents (fumed silica) were also added into the G dispersed solution. The corrosion resistance of the G modified waterborne epoxy coating was evaluated by electrochemical measurements and salt spray tests. Superior anticorrosion properties of the composite coatings were obtained by adding 0.5% G. We aimed to provide an essential insight on improving the corrosion resistance of waterborne epoxy coating with enhanced G dispersion.
Graphene slurry (length: 5-20 µ m; layer thickness: 2-5 nm; layer number: 3-10; purity: 99.5%; water mass fraction: 95.5 wt%) was provided by Ningbo Morsh Technology. Co., Ltd and used without further purification. Double-distilled water was used throughout the experiments. Two-component waterborne epoxy coatings were purchased from Northwest Yongxin Plant & Coatings Co., Ltd. All other reagents were purchased from Aladdin and used as received.
G slurry was ultrasonic dispersed in water (1.0 g L-1) at a power of 100 W, and then sodium polyacrylate was added to disperse graphene. The pH value of dispersion solution was adjusted to 8-9 by NH4OH solution. A few anti-sediment agents (fumed silica) were also added, then centrifuged at 10 000 rpm for 25 min to further remove aggregates. Scanning electron microscopy (SEM) with an acceleration voltage of 30 kV and atomic force microscopy (AFM) were used to observe the dispersed G. An infrared spectrometer (IR) was used to evaluate the dispersion performance of G, which was measured as pellets with KBr.
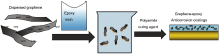
The obtained G dispersion solution was mixed with two-component waterborne epoxy coatings (the solid content is 56 wt%), and the mixture was stirred magnetically for 10 min. The Q235 carbon steel with the nominal chemical composition (wt%) of C 0.16, Mn 0.53, Si 0.30, S 0.055, P 0.045 and Fe balance was used as substrate. It was cold-mounted in epoxy resin to give a surface area of 1 mm × 1 cm exposed to the media. A copper wire was connected to the backside of each specimen with a silver paste. Prior to coating, the specimens were abraded with emery paper from 150 to 1000 grit, respectively, degreased ultrasonically in acetone, and then dried at room temperature. The neat epoxy coating (E44) and E44 containing different contents of G (0.5 wt% G-E44 and 1.0 wt% G-E44) were coated on Q235 steel at the thickness of 50 µ m, dried at 70 ° C for 12 h. Fig. 1 exhibits the preparation process of G-based epoxy anticorrosion coatings. When the G content was 0.5%, three-dimensional random distribution of G existed in the epoxy coating, which gave a tortuous path of electrolyte to penetrate through the coating. When the G content was 1.0%, G distributed randomly in the coatings, and a few aggregates existed in the coatings, which may decrease the anticorrosion performance of waterborne E44 coatings.
 | Fig. 1. Preparation process of G-based waterborne E44 coatings. |
Electrochemistry workstation (CHI660-E) was employed with the low current interface attachment. All electrochemical measurements were carried out in a conventional three-electrode cell with a saturated calomel electrode (SCE) as reference and a platinum counter electrode. The working electrode was the coated Q235 steel specimen. All the tests were performed at room temperature (298 K). The volume of the cell was 500 mL and the electrolyte was 3.5% NaCl solution. All the potentials in this research were reported in the SCE scale. The samples were immersed in 3.5% NaCl solution to attain a stable open circuit potential (OCP) before starting the EIS and polarization scan. The polarization curves were recorded from -250 mV to +250 mV versus OCP at a scan rate of 0.166 mV/s. For EIS test, the amplitude of the sinusoidal voltage signal was 20-50 mV according to the corresponding coating resistance measured, and the frequency ranged from 100 000 to 0.01 Hz. EIS data were fitted by ZSimpWin 3.21 software with equivalent circuit. To determine the reproducibility of the data, three parallel samples were performed for electrochemical impedance spectroscopy (EIS) measurements and polarization curves, and the representative results were selected.
Salt spray test was carried out in salt spray cabinet (Q-FOG CCT-1100) according to the international standard ASTM B117-09.
The IR spectra of G slurry, sodium polyacrylate, and sodium polyacrylate-G were measured to study the dispersion performance of G (see Fig. 2). For IR spectra of G slurry, the peak observed at 1600 cm-1 is due to the C-C vibrations from the graphitic domains. The relatively broad peak at 3450-3550 cm-1 is due to the adsorbed water in the G slurry. For IR spectra of sodium polyacrylate-G, the absorption peaks in the range of 1627-1711 cm-1 are assigned to carbonyl groups, and the shift can be attributed to a strong interaction between sodium polyacrylate and G[22]. The peaks in the 2800-2900 cm-1 region are assigned to the C-H stretch vibration of sodium polyacrylate backbone.
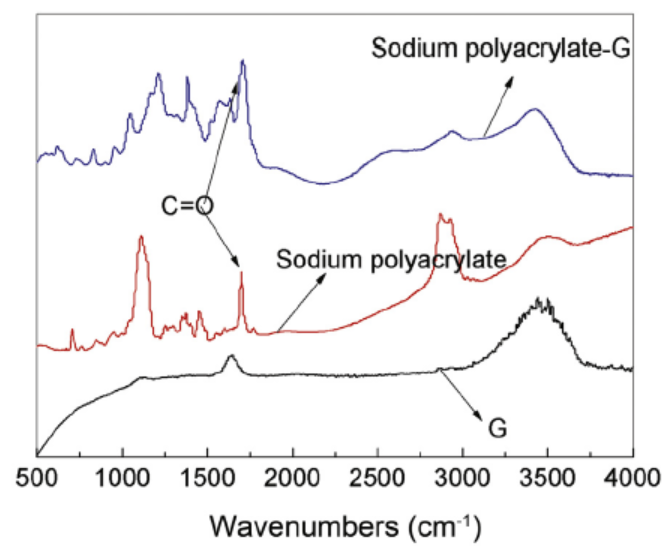 | Fig. 2. IR spectra of G slurry, sodium polyacrylate, and sodium polyacrylate-G. |
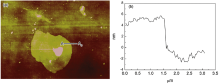
Fig. 3 shows SEM images of dispersed G in aqueous solution under different morphologies, which reveal the sheet structure of G being dispersed by sodium polyacrylate. It is observed that G is dispersed uniformly at length of ~5 µ m and no obvious aggregates exist (Fig. 3(b)). Fig. 4 depicts the AFM image of dispersed G deposited on Si-coated substrate. On the topography image, shown in Fig. 4(a), we can see the G layer slightly brighter than the Si-coated substrate. From the line scan shown in Fig. 4(b), it is very easy to estimate the thickness of G layer (about 3-6 nm).
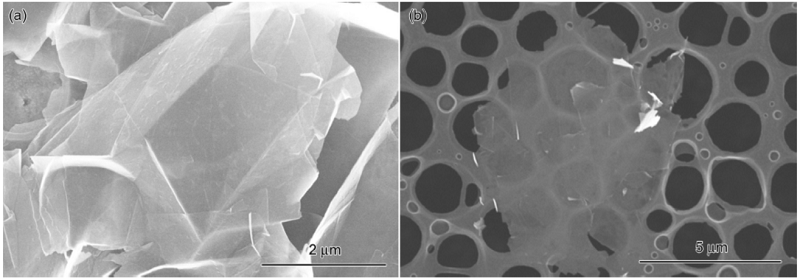 | Fig. 3. SEM images of dispersed G at low magnification (a) and high magnification (b). |
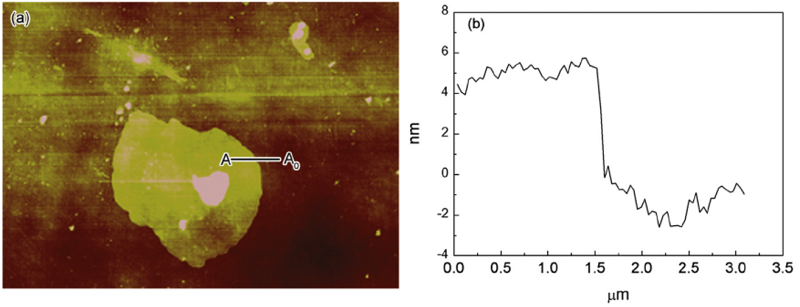 | Fig. 4. AFM images (a) of a thin G film deposited on an Si-coated substrate and height profile (b) along the black line (from A to A0). |
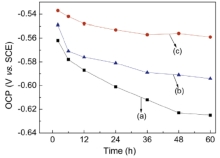
OCP was recorded every 12 h for 10 min for neat epoxy coating (E44), 0.5%G-E44 and 1.0%G-E44 in order to get a stable potential before carrying out the EIS and polarization curve measurement. Fig. 5 presents the time dependencies of OCP for these three coatings after different exposure time in 3.5% NaCl solution. All the OCP values decrease with time during the first 48 h and then remain stable. After 48 h, the OCP values of E44, 0.5%G-E44 and 1.0%G-E44 are approximately -0.63 V, -0.56 V and -0.59 V, respectively. Moreover, the OCP of 0.5%G-E44 is 70 mV, which is more positive than neat E44. Although OCP represents the corrosion susceptibility of the coating, a shift in OCP to more positive values suggests that G may increase the corrosion resistance of neat epoxy coating.
 | Fig. 5. OCP curves for G-epoxy coating systems immersed in 3.5% NaCl solution after different times: (a) E44; (b) 0.5%G-E44; (c) 1.0%G-E44. |
Corrosion rates of graphene-waterborne epoxy coating coated on Q235 steel were determined using Tafel analysis in 3.5% NaCl solution at 298 K. The anodic and cathodic polarization curves for the corrosion of E44, 0.5%G-E44 and 1.0%G-E44 after 48 h are shown in Fig. 5. The values of corrosion current density icorr, corrosion potential Ecorr, anodic and cathodic Tafel slopes (β a and β c) determined from Tafel zone (± 80 mV with respect to the Ecorr), and polarization resistance Rp for the composite coatings in 3.5% NaCl solution are given in Table 1<sup>[23].
| Table 1. Corrosion parameters of bare Q235 steel and composite coatings immersed in 3.5% NaCl solution after 48 h |
From the polarization curves in Fig. 6 and corrosion parameters in Table 1, a shift in the Ecorr toward more positive values for the 0.5%G-E44 (-0.566 V) and 1.0%G-E44 (-0.608 V) are apparent after exposure for 48 h compared to E44 (-0.637 V). The calculated corrosion current density (55.1 nA cm-2) for 0.5%G-E44 is much lower than those for 1.0%G-E44 (93.4 nA cm-2) and E44 (121 nA cm-2), which reduced half compared to that of neat E44 after exposure for 48 h in 3.5% NaCl solution. Also, the Rp of 0.5%G-E44 is higher than that of the E44 and 0.5%G-E44. Besides, the β a values of 0.5%G-E44 (0.312 V dec-1) is enhanced greatly compared to that of neat E44 (0.134 V dec-1), suggesting that the anodic reaction is inhibited by adding G.
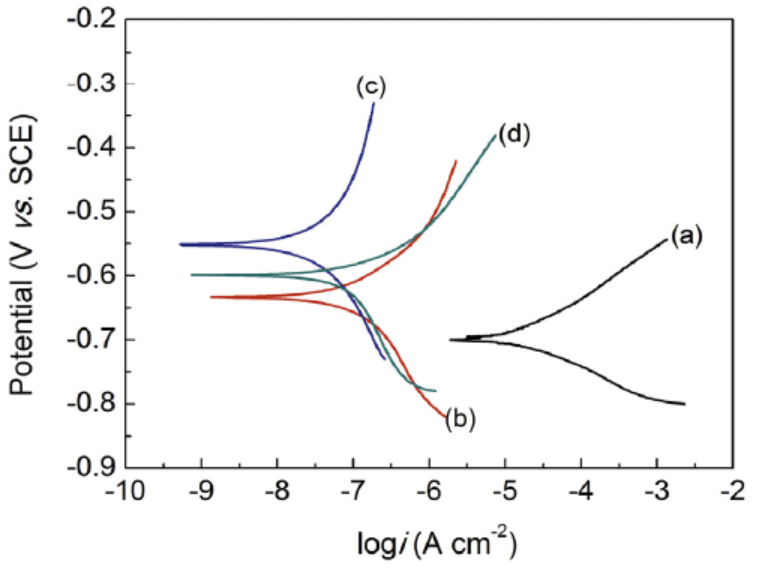 | Fig. 6. Potentiodynamic polarization curves for (a) bare steel, (b) E44 coated, (c) 0.5G-E44 coated and (d) 1.0%G-E44 coated electrode immersed in 3.5% NaCl solution after 48 h. |
The protection efficiency was calculated using the following Eq. (1)[24]:
It is noted that the PEF% of 0.5G-E44 (99.7%) is the highest.
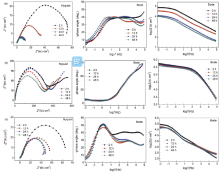
The results of polarization curves show that the Q235 steel coated with 0.5%G-E44 has better corrosion resistance than that coated with neat E44 coating. The Nyquist and Bode plots (Fig. 7) was further employed to evaluate the degradation processes of various samples, as the EIS is one of the most intensive and nondestructive testing techniques for investigation and prediction of the organic coating in aqueous solution[25, 26]. The EIS at open circuit potential obtained for various immersion time shows that the composite coatings are characterized by two capacitive loops. And the phase angle plot shows two time constants at the very beginning of the immersion of 2 h. The high frequency domain of the EIS can be used to evaluate the evolution of the protective barrier properties of the epoxy coating. When water molecule and other corrosive media penetrate into the coating with the increase of immersion time, the appearance of a new time constant in the middle-low frequency domain usually indicates a response from the pitting corrosion of the metallic substrate[27, 28].
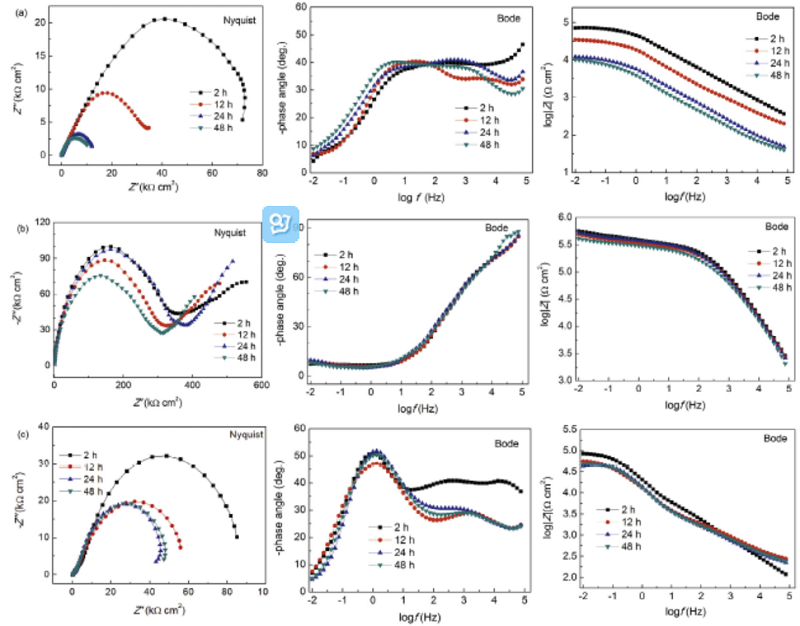 | Fig. 7. Nyquist and Bode plots of G-epoxy coating systems immersed in simulated seawater after different times: (a) E44; (b) 0.5%G-E44; (c) 1.0%G-E44. |
For the neat E44 (Fig. 7(a)), the Bode plots are characterized by two time constants after 2 h. In the middle-low frequency domain, the impedance modulus decreases dramatically after 24 h and then progressively diminishes with the increase of immersion time, suggesting that some hydrophilic groups or water molecules remained in the waterborne epoxy coatings, and the water isolating properties of neat E44 are poor. For 0.5%G-E44 (Fig. 7(b)), the radiuses of two capacitive loops are larger than neat E44 and remain relatively constant during the whole immersion times, because the well dispersed G can fill the structural and pinhole porosity of neat E44 and then inhibit the water penetration, revealing its good protection performance based on metallic substrate[29]. For 1.0%G-E44 (Fig. 7(c)), during the first 12 h of immersion, the impedance modulus decreases rapidly and then remains unchanged for longer immersion time; this phenomenon may be caused by the aggregation of excessive G in E44 coating and the film forming property of epoxy resin is affected.
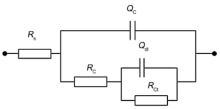
A more detailed quantitative analysis of the protective properties of G-epoxy coating systems can be achieved by fitting the EIS data with appropriate equivalent circuit. Fig. 8 shows the equivalent circuit model and the fitted corrosion parameters are presented in Table 2. In Fig. 8, Rs is the solution resistance, and Rc and Qc represent the coating resistance and coating capacitance, respectively. Rct and Qdl represent the charge-transfer resistance and double-layer capacitance, respectively[23].
 | Fig. 8. Equivalent circuit used to fit the EIS data. |
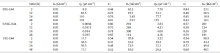
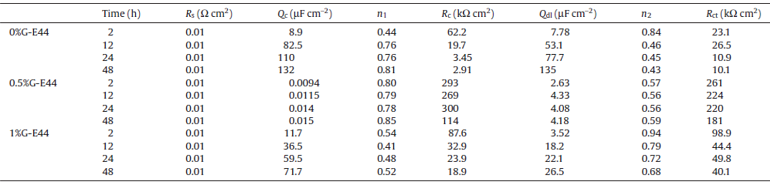
| Table 2. Electrochemical corrosion parameters of composite coatings fitted from the equivalent circuit after different immersion time |
Normally, the coating capacitance mainly depends on the amount of water uptake[29]. For these three coatings, an increase of the coating capacitance is observed during the whole immersion times. Meanwhile, the coating resistance of the three coatings decreases gradually as time elapsed. Obviously, when graphene was added into the E44, the coating capacitance of 0.5%G-E44 (0.015 µ F cm-2) is much lower than that of the E44 (132 µ F cm-2) and 1.0%G-E44 (71.7 µ F cm-2) after 48 h; also, the coating resistance of 0.5%G-E44 (114 kΩ cm2) is much higher than that of the E44 (2.91 kΩ cm2) and 1.0%G-E44 (23.9 kΩ cm2) after 48 h, which may be attributed to the good barrier and hydrophobic property of G.
Water uptake of the coating was also measured by the EIS and was calculated based on the changes of the coating capacitance due to the variation of the dielectric constant. The water diffusion coefficient D can be calculated by means of the simplified Fick's second law of diffusion (see reaction 2) [30].
equation(2)lgQc-lgQ0lgQ∞ -lgQ0=2LDπ twhere Q0, Qc and Q∞ are the coating capacitances at the beginning of the immersion time T0, the time Tc and the time in saturated water absorption state T∞ , respectively. D is the diffusion coefficient, L is the coating thickness. The D can be calculated from the lgQc-t1/2 curves, giving the diffusion coefficients for these three coating (E44, 0.5%G-E44 and 1.0%G-E44) of 5.56 × 10⁻⁹cm2 s-1, 1.61 × 10⁻¹¹ cm2 s-1 and 1.24 × 10⁻⁹ cm2 s-1, respectively. These results indicate that when 0.5%G is added into the neat E44, the water isolating property of waterborne coating is greatly improved; however, the excessive G addition to neat E44(1.0%G-E44) leads to the decrease of the water isolating properties, as the G powders have less aggregation and disperse evenly when the content of G is 0.5%.
When the corrosive media gradually penetrate through the coating, the corrosion process of the coating/metal system is determined by the charge-transfer resistance Rct. The Rct of the E44 and 1.0%G-E44 decrease with time rapidly, revealing its poor anticorrosion performance. However, the Rct of the coating was much higher when the content of G was 0.5%, suggesting that this coating (0.5%G-E44) was highly water-resistant and exhibited better protectiveness. These results were in a good agreement with the above polarization curves.
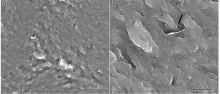
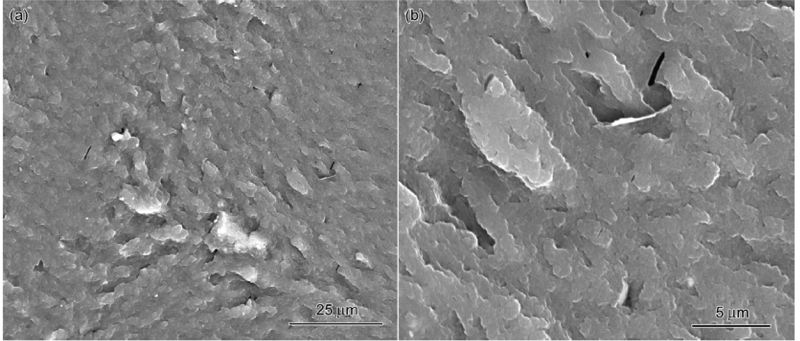
In order to observe the dispersion property of G in waterborne epoxy coating, the fracture surfaces were observed. Fig. 9 shows the SEM images of fractured surface of the 0.5%G-E44 coating under low resolution and high resolution after curing[31]. It can be seen that G is about 10 µ m in diameter and disperse uniformly in the epoxy matrix. The G has less aggregation and dispersed evenly, revealing the G can be expected to play an important role in increasing the tensile strength and compactness of the epoxy coating.
 | Fig. 9. SEM images of fractured surface of the 0.5%G-E44 coating under low resolution and high resolution. The pt powder was deposited prior to the SEM specimen. |
Fig. 10 depicts photographs of E44 and 0.5%G-E44 coating after different exposure times (0 day, 15 days and 30 days) in neutral salt spray chamber, respectively. Both of the E44 and 0.5%G-E44 coating compactly absorbed on the metal substrate and no corrosion was observed before salt spray tests. The upper row images reveal the presence of corrosion activity of the neat E44 after 15 days and 30 days of exposure. The yellow rust and coating blistering are observed near the scratches and the top of the samples. That is most caused by the poorest protection of the cut-edges of the sample. However, the 0.5%G-E44 coating did not blister and there is no evidence of apparent localized corrosion attack after 30-day exposure time (lower row images). The salt spray test results indicate the good anticorrosion performance of 0.5%G-E44 coating.
 | Fig. 10. Photographs of E44 (the upper row) and 0.5%G-E44 (the lower row) coatings immersed in salt spray chamber after different times. |
Graphene (G) was dispersed uniformly in water in the present sodium polyacrylate and used as anticorrosive barrier in waterborne epoxy coating. Compared with neat E44, G can enhance the anticorrosion performance of waterborne epoxy coating. The PEF% of 0.5G-E44 coating on Q235 steel is 99.7%. The well-dispersed G can block the coating pores and decrease the electrolyte diffusion toward the substrate, and the water diffusion coefficients of E44, 0.5G-E44 and 1.0G-E44 are 5.56 × 10⁻⁹ cm2 s-1, 1.61 × 10⁻¹¹ cm2 s-1 and 1.24 × 10⁻⁹ cm2 s-1, respectively. G improves the salt spray resistance of waterborne epoxy coating. It is expected that this G-reinforced composite coating can open a new avenue especially for marine anticorrosion.
This project was supported by the National Natural Science Foundation of China (No. 41506098), the China Postdoctoral Science Foundation (No. 2015M580528), and the Open Fund Project of Key Laboratory of Marine Materials and Related Technologies (No. LMMT-KFKT-2014-008) in the Chinese Academy of Sciences.
The authors have declared that no competing interests exist.
| [1] |
|
| [2] |
|
| [3] |
|
| [4] |
|
| [5] |
|
| [6] |
|
| [7] |
|
| [8] |
|
| [9] |
|
| [10] |
|
| [11] |
|
| [12] |
|
| [13] |
|
| [14] |
|
| [15] |
|
| [16] |
|
| [17] |
|
| [18] |
|
| [19] |
|
| [20] |
|
| [21] |
|
| [22] |
|
| [23] |
|
| [24] |
|
| [25] |
|
| [26] |
|
| [27] |
|
| [28] |
|
| [29] |
|
| [30] |
|
| [31] |
|