
Assessment of Elasticity, Plasticity and Resistance to Machining-induced Damage of Porous Pre-sintered Zirconia Using Nanoindentation Techniques
[Abdur-Rasheed Alao, Ling Yin ]
]
]
|
|


Porous pre-sintered zirconia is subject to white machining during which its elasticity, plasticity and resistance to machining-induced damage determine its machinability and final quality. This study used nanoindentation techniques and the Sakai's series elastic and plastic deformation model to extract the resistance to plastic deformation from the plane strain modulus and the contact hardness for pre-sintered zirconia. The modulus and the resistance to plasticity were used to calculate the relative amount of elasticity and plasticity. The fracture energy and the normalized indentation absorbed energy were used to deconvolute the resistance to machining-induced cracking based on the Sakai-Nowak model. All properties were extracted at a 10 mN peak load and loading rates of 0.1-2 mN/s to determine the loading rate effects on these properties. We found that the resistance to plasticity and the resistance to machining-induced cracking were independent of the loading rate (ANOVA, p > 0.05). The elastic and plastic displacements depended on the loading rate through power laws. This loading rate-dependent deformation behaviour was explained by the maximum shear stress generated underneath the indenter and the indentation energy. The plastic deformation components and the indentation absorbed energy at all loading rates were higher than the elastic deformation components and the elastic strain energy, respectively. Finally, we established the linkage among the pore structure, indentation behaviour and machinability of pre-sintered zirconia.
Porous pre-sintered yttria-tetragonal zirconia poly-crystals (Y-TZP) are widely processed using white abrasive machining to make zirconia products in dentistry, medicine and engineering, such as surgical prosthetics, dental implants, abutments, crowns and bridges, sensors and environmental filters[1, 2, 3, 4, 5, 6, 7, 8, 9]. This is because its low hardness makes it easier to machine in its porous state with low costs[10, 11, 12, 13, 14]. However, due to its low mechanical strength, pre-sintered zirconia is susceptible to brittle fracture, which is inevitably induced in abrasive machining processes[15]. These machining-induced cracks in pre-sintered zirconia cannot be healed in the following sintering processes[2, 16]. They are strength-degrading when their lengths exceed machining-induced surface compressive layer thicknesses[17, 18, 19], shortening lifespans of zirconia products[1, 16, 20, 21, 22, 23, 24, 25, 26]. Therefore, understanding of the elastic/plastic deformation, the resistance to plasticity and the resistance to machining-induced cracking of pre-sintered zirconia is a crucial prerequisite for evaluating and predicting its machinability. The mechanical behaviour of pre-sintered zirconia during abrasive machining can be simulated in indentation studies due to the micro-mechanical similarity of the indentation-induced and machining-induced deformations and fractures[15, 27].
Instrumented indentation is often used to characterize the contact hardness, Hc, and the plane strain modulus, E′ , for materials [28, 29]. The contact hardness is a hybrid parameter encompassing both elastic and plastic behaviours of a material [30, 31, 32]. The resistance to plastic deformation, HT, which can be obtained using the Sakai model[32], measures the material plasticity for prediction of the material machinability [33, 34, 35, 36, 37]. The Sakai model assumes “ springs in series” contributions for elastic and plastic deformations from a single indentation response. It enables the resistance to plasticity, HT, to be deconvoluted from the contact hardness, Hc, and the plane strain modulus, E′ . The model was used to characterize the resistances to plasticity for homogeneous engineering materials and mineralized biological tissues [38]. It allows a single indentation response to be partitioned into elastic and plastic deformation components[32]. This partitioning provides insights into the dominating material deformation behaviour. If the dominant deformation is elastic, the material is more prone to brittle fracture; if the dominant deformation is plastic, the material is more resistant to fracture. The occurrence of an elastic deflection of a material during diamond abrasive machining plays a significant role in controlling the surface quality[39]. Thus, understanding the elastic behaviour of the material is helpful for prediction of residual stresses induced during the elastic recovery or traversing cutting tools. In fact, machining-induced residual tensile stresses, which are often locked on the material surface, can cause quality problems[39]. Further, the occurrence of plastic deformation in machining can also facilitate the material removal in the ductile region to minimize machining-induced microcracks. For pre-sintered zirconia, the contact hardness, Hc, Young's modulus, E, and the mechanisms of compaction and kink band formation in nanoindentation were reported[10]. However, little is known about its resistance to plasticity, HT, and the respective contributions of the elasticity and plasticity to the total deformation during nanoindentation and how these contributions affect its machinability.
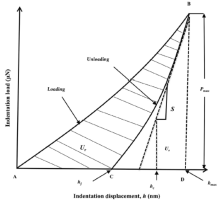
Indentation energies are useful parameters in analysing the mechanical behaviour of materials[40, 41]. The characteristic energy-absorbing or energy-releasing events occurring beneath an indenter are the total energy, Ut, the indentation absorbed energy, Ur, and the elastic strain energy, Ue (Fig. 1). The total energy, Ut, spent in indenting a material to the peak load is the total area under the loading p-h curve, i.e., the area ABDA in Fig. 1. The elastic strain energy recovered, Ue, is the area of the unloading portion of the p-h curve, (i.e., the area CBDC in Fig. 1), representing the elastic energy associated with residual stresses caused by the indenter withdrawal. The indentation absorbed energy, Ur, i.e., the area ABCA in Fig. 1, represents the energy dissipated during indentation due to plastic deformation, cracking and crushing processes. Thus, by normalizing Ue and Ur relative to Ut, the contributions of the elastic strain energy and the indentation absorbed energy to the material deformation can be determined, respectively. The normalized indentation elastic strain energy, Ue/Ut, was linked to the material's deformation recovery capability and the initial unloading stiffness[42]. The normalized indentation absorbed energy, Ur/Ut, was directly related to the hardness-to-elastic modulus ratio (Hc/E) of materials, providing an alternative method for the measurement of mechanical properties of materials [41]. Further, the Ur/Ut ratio was also linked to the ductility[32, 41], machinability[15] and wear resistance of materials[43, 44]. For pre-sintered zirconia, nanoindentation energy and associated properties have not been studied.
 | Fig. 1. Schematic illustration of an indentation load-displacement curve, in which Ur is the indentation absorbed energy, Ue is the elastic strain energy, Pmax is the peak load, hmax is the maximum depth, hc is the contact depth, hf is the final depth, and S is the initial unloading stiffness. |
Another important issue for pre-sintered zirconia is about its resistance to machining-induced cracking, M, which can be simulated by nanoindentation techniques. Sakai and Nowak [45] reported the resistances to machining-induced cracking in nanoindentation for several sintered ceramics using indentation techniques. Alao and Yin[46] have used the Sakai-Nowak model[45] to extract the resistance to machining-induced cracking for sintered zirconia. However, such a characterization method has not been used for pre-sintered materials. This is essential because pre-sintered states are generally considered to be machinable but their resistances to machining-induced cracking, which can be used to predict the machining quality, remain unknown.
Therefore, this study aimed to characterize the resistance to plasticity, HT, the elastic/plastic deformation components, he and hp, the normalized indentation energies, Ue/Ut, and Ur/Ut, and the resistance to machining-induced cracking, M, for pre-sintered zirconia using nanoindentation techniques. Sakai's series elastoplastic model[32] was used to extract the resistance to plasticity, HT, from the plane strain modulus, E′ , and the contact hardness, Hc. The elastic, he, and plastic, hp, deformation components were extracted from the plane strain modulus, E′ , and the resistance to plasticity, HT, respectively. The resistance to machining-induced damage, M, was calculated based on the Sakai-Nowak model [45] from the fracture energy and the normalized indentation absorbed energy, Ur/Ut. These properties were evaluated as a function of loading rate ranging from 0.1 mN/s to 2 mN/s at a 10 mN peak load. These properties were used to predict the machinability for the material.
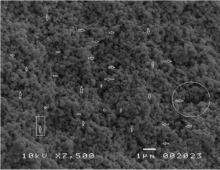
Pre-sintered zirconia consisting of 97% tetragonal and 3% monoclinic zirconia phases[47] was selected in this study, which is commonly used in dental CAD/CAM milling systems for crowns and bridges (IPS e.max ZirCAD, Ivoclar Vivadent). This material contains approximately 87-95 wt% ZrO2, 4-6 wt% Y2O3, 1-5 wt% HfO2 and 0.1-1 wt% Al2O3[10, 14]. Fig. 2 is a fractured specimen microstructure by scanning electron microscopy (Jeol JSM5410LV, Japan). It shows zirconia crystals with grain sizes of approximately 300 nm and either isolated or interconnected pores between zirconia grains that are indicated by arrows. The material density is 3.21 g/cm3, porosity is 47.3-49.3 vol%, and biaxial strength is 50-90 MPa[14]. Poisson's ratio is 0.235 provided by Ivoclar Vivadent.
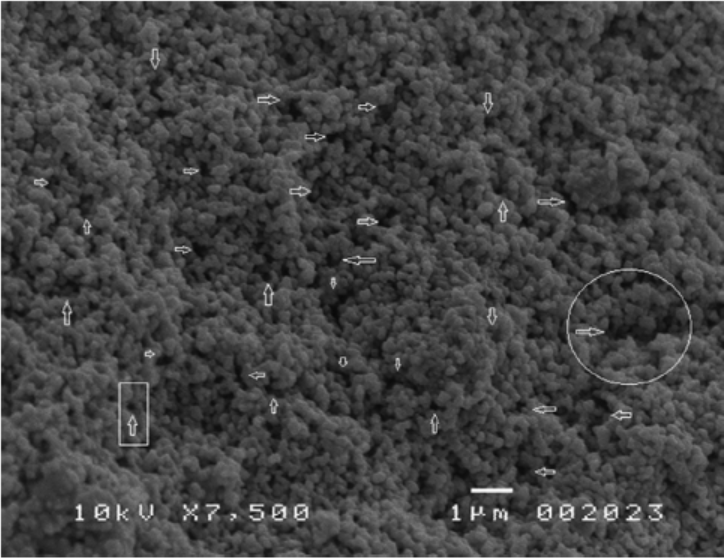 | Fig. 2. SEM micrograph of the fractured surface of pre-sintered zirconia showing the heterogeneous microstructure containing grains and pores (arrows). Typical isolated and interconnected pores are indicated by a rectangle and a circle, respectively. |
Indentation samples were made with a thickness of 2 mm and metallographically ground and polished using successively finer diamond paste to obtain mirror surfaces[10]. The root-mean-squared surface roughness, Rq, of the polished surfaces was approximately 72.3 nm[10] taken over the scanned area of 50 µ m × 50 µ m by atomic force microscopy (AFM, NT-MDT NTEGRA, Hysitron, USA).
Nanoindentation tests described previously by Alao and Yin[10]were conducted with a Hysitron Triboscope (Hysitron, USA). Briefly, a Berkovich diamond indenter of approximately 150 nm tip radius was used. Prior to the nanoindentation tests, the system was calibrated using a fused silica standard. Nanoindentation tests were conducted in a load-control mode at 10 mN peak load and 0.1, 0.5, 1 and 2 mN/s loading rates, corresponding to 100, 20, 10 and 5 s loading and unloading time, respectively. During indentation, load-displacement curves were automatically recorded for analysis[10]. For the Berkovich indenter used, the indentation response for pre-sintered zirconia may show either elastic-plastic or viscous-elastic-plastic deformation mode[48]. However, the viscous behaviour could be eliminated through a rapid unloading rate or holding the material at a peak load[49]. Hence, incorporating the peak-load-holding segment into our experiments would necessitate extracting the viscous or creep property[50, 51, 52]for the material using models such as Oyen-Cook's[52]. Therefore, no holding time at a peak load was used in this study. In addition, thermal drift corrections were made to enable the nanoindenter to obtain the maximum drift rate of 0.05 nm/s[10]. The maximum drifts for the loading-unloading sequences corresponded to 5, 1, 0.5 and 0.25 nm for 0.1, 0.5, 1 and 2 mN/s loading rates, respectively[10].
2.3.1. Resistance to plasticity
The extraction of the resistance to plastic deformation, HT, using the Sakai model[32] in nanoindentation techniques has been well-detailed by Alao and Yin[46]. Briefly, the total contact displacement, ht, at the peak load, Pmax, was assumed to result from both the elastic and plastic deformations. Consequently, this behaviour was modelled as a sum of purely elastic and plastic components in series with the elastic, he, and plastic, hp, displacements[32]:
ht=he+hp (1)
For the purely elastic component, the constitutive load-displacement equation can be described as[32]:
Pe=α 2E’ he2(2)
where Pe is the load in the elastic component, α 2 is a geometric constant which is 4.4 for a Berkovich indenter applied in this study[38], E′ is the plane strain modulus, which is expressed as [29]:
In Eq. (3), E and v are Young's modulus and Poisson's ratio of the material, and Ei and vi are Young's modulus and Poisson's ratio of the indenter. For a Berkovich diamond indenter, vi = 0.07 and Ei= 1141 GPa[29].
Similarly, the constitutive load-displacement equation for the plastic element can be expressed as[32]:
Pp=α 1HThp2 (4)
where Pp is the load in the plastic component, α 1 is a non-dimensional constant depending on the geometry of the indenter, which is 24.5 for the Berkovich indenter[32], and HT is the resistance to plastic deformation. At the peak load, both the elastic load and the plastic load are equal to the peak load (i.e., Pe = Pp = Pmax). Substituting he from Eq. (2) and hp from Eq. (4) in Eq. (1), then Eq. (1) becomes [32, 38]:
The hybrid contact hardness, Hc, in nanoindentation tests is expressed as[29]:
where hcis the contact depth. Replacing hc in Eq. (6) with htin Eq. (5), the hybrid contact hardness, Hc, becomes [32, 38]:
From Eq. (7), the resistance to plastic deformation, HT, can then be expressed as:
At each loading rate, the resistance to plasticity, HT, was calculated using Eq. (8) with the previously reported values of the contact hardness, Hc, and plane strain modulus, E [10].
2.3.2. Elastic and plastic displacements
The respective elastic displacement, he, and the plastic displacement, hp, can be obtained as follows from Eqs. (2) and (4) by using Pe = Pp = Pmax:
Elastic and plastic displacements, he and hp, were calculated from Eqs. (9) and (10). The elastic and plastic deformation components were calculated from he/(he + hp) and hp/(he + hp), respectively.
2.3.3. Indentation energies
In Fig. 1, the loading portion of the load-displacement curve is often described by Meyer's law[32, 40]:
P=k1hn (11)
where P is the instantaneous load, k1 is the loading curve constant, n is the loading exponent and h is the instantaneous depth. The total energy, Ut, is obtained by integrating Eq. (11) from zero depth to the maximum depth, hmax:
The unloading curve is described by the following expression[29]:
P=k2 (h-hf)m (13)
where k2 is the unloading curve constant, m is the unloading exponent and hf is the final depth. The elastic strain energy, Ue, is obtained by integrating Eq. (13) from the final depth to the maximum depth.
Then, the indentation absorbed energy, Ur, is expressed by the difference between the total energy and the elastic strain energy.
Ur=Ut-Ue (15)
The normalized indentation elastic strain energy, Ue/Ut, was determined using Eqs. (12) and (14). The normalized indentation absorbed energy, Ur/Ut, was determined using Eqs. (12) and (15).
2.3.4. Resistance to machining-induced cracking
According to the Sakai-Nowak model[45], the potential strain energy for machining-induced cracking is provided by the elastic strain energy, Ue. The total energy consumed during surface cracking is provided by the fracture energy, Rc, and the resultant fracture surface area for the mechanically induced i-th damage or crack,
where KIc is the fracture toughness and E’ is the plane strain modulus. Assuming that all the potential strain energy is converted to the total surface energy, it then follows:
Substituting D = Ur/Ut into Eq. (17), the following equation is obtained:
The resistance to machining-induced cracking, M, is defined as the inverse degree of damage for a unit applied work [45]:
M reduces naturally to the fracture energy if D = 0 and becomes infinite if D = 1.
The resistance to machining-induced cracking, M, was calculated using Eq. (19) in which the fracture toughness, KIc, is required. The KIc value was determined by the fracture toughness-relative density plot for porous zirconia using a standard single-edge notched beam method[53]. The relative density of the pre-sintered zirconia is 0.53 based on its density 3.21 g/cm3 against the fully dense zirconia density (6.08 g/cm3)[54]. This relative density value corresponded to the fracture toughness of approximately 1 MPa m1/2[53].
2.3.5. Statistical analysis
Six repeated nanoindentations were conducted to determine the mean values and standard deviations of the properties at each loading rate. Single-factor analysis of variance (ANOVA) was applied at a 5% confidence interval to examine significant effects of loading rate on properties.
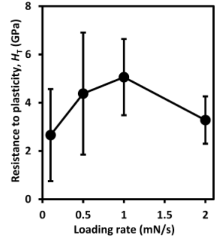
Fig. 3. shows the resistance to plasticity, HT, versus the loading rate. It increased with the loading rate at 0.1 to 1 mN/s and decreased when the loading rate changed from 1 to 2 mN/s. Its values at the loading rates of 0.1, 0.5, 1 and 2 mN/s are 2.66 ± 1.91, 4.38 ± 2.53, 5.06 ± 1.58, and 3.28 ± 0.98 GPa, respectively. The coefficients of variation (i.e. the ratios of the standard deviations to the mean values) range from 30% to 72%. However, the loading rate effect on the resistance to plasticity was insignificant (p > 0.05).
 | Fig. 3 Resistance to plasticity, HT, versus loading rate. Each data point is the mean value from six repeated indentations; the error bars correspond to ± 1 standard deviation for the six repeats. |
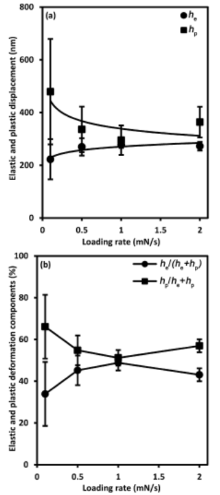
Fig. 4(a) shows the elastic, he, and the plastic, hp, displacements versus the loading rate. The elastic displacement increased with the loading rate, whereas the plastic displacement decreased with the loading rate. Meanwhile, all plastic displacements are higher than elastic displacements at all loading rates. The power law fittings (solid lines) show the respective dependences of both elastic and plastic displacements on the loading rate with the following expressions:
 | Fig. 4. (a) Elastic and plastic displacements, he and hp, versus loading rate. Solid lines are power law fits to the measured data, (b) elastic and plastic deformation components, he/(he + hp) and hp/(he + hp) versus loading rate. Each data point is the mean value from six repeated indentations; the error bars correspond to ± 1 standard deviation for the six repeats. |
The coefficients of determination (R2) for Eqs. (20) and (21) are 82.4% and 55.5%, respectively.
Fig. 4(b) shows the elastic and plastic deformation components in terms of he/(he+ hp) and hp/(he + hp), respectively. The elastic deformation components increased as the loading rate was increased from 0.1 to 1 mN/s and decreased when the loading rate was changed from 1 to 2 mN/s. The plastic deformation components decreased as the loading rate was increased from 0.1 to 1 mN/s and increased further as the loading rate was changed to 2 mN/s. At all loading rates, the plastic deformation components were higher than the elastic deformation components indicating the dominant plastic deformation response for pre-sintered zirconia.
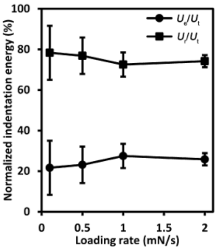
Fig. 5 shows the normalized elastic strain energy, Ue/Ut, and the normalized indentation absorbed energy, Ur/Ut, versus the loading rate. The normalized elastic strain energy increased with the loading rate up to 1 mN/s and remained relatively constant afterwards while the normalized indentation absorbed energy exhibited a reciprocal phenomenon. Thus, 1 mN/s loading rate can be considered as the critical loading rate at which the indentation energies were insensitive to the loading rate for the studied material. This observation can be further confirmed by Fig. 4(b) where both elastic and plastic deformation components coincided at 1 mN/s. In addition, standard deviations of both Ue/Ut and Ur/Ut reduced when the loading rate increased. ANOVA analyses showed that loading rate did not significantly influence the normalized indentation energies (p > 0.05).
 | Fig. 5. Normalized elastic strain indentation energy, Ue/Ut, and normalized indentation absorbed energy, Ur/Ut, versus loading rate. Each data point is the mean value of six repeated indentations; the error bars correspond to ± 1 standard deviation for the six repeats. |
Fig. 6. shows the resistance to machining-induced cracking, M, versus the loading rate. It increased with the loading rate at 0.1 to 0.5 mN/s, then decreased with the loading rate ranging 0.5-1 mN/s and remained relatively constant with the loading rate from 1 to 2 mN/s. Its values at the loading rates of 0.1, 0.5, 1 and 2 mN/s are 117.24 ± 60.15, 155.61 ± 52.01, 129.20 ± 31.58, and 128.90 ± 24.10 J/m2, respectively. Accordingly, the coefficients of variation range 18%-51%. However, the loading rate influence on the resistance to machining-induced cracking was found insignificant (p > 0.05).
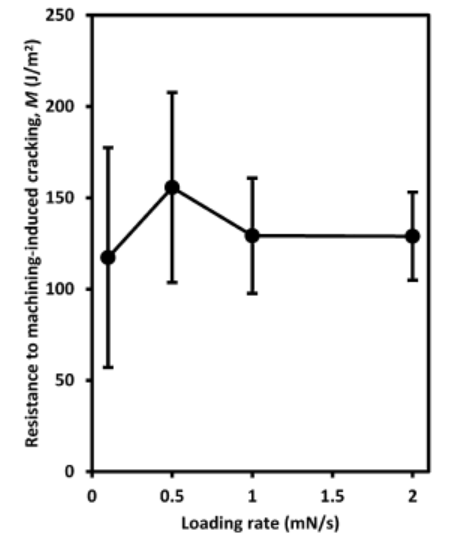 | Fig. 6 Resistance to machining-induced crack, M, versus loading rate. Each data point is the mean value of six repeated indentations; the error bars correspond to ± 1 standard deviation for the six repeats. |
This study analysed the nano-mechanical behaviour of pre-sintered zirconia associated with its machinability using nanoindentation, which can be useful in predicting its performance during white abrasive machining, such as diamond milling, grinding and polishing.
The independent relation between the resistance to plasticity and the loading rate (Fig. 3) reveals high coefficients of variation of 30%-72%, which needs to be further analysed. The reason for the large dispersion in the resistance to plasticity values can be attributed to the heterogeneous microstructure of pre-sintered zirconia containing about 48% porosity. Consequently, indentations made on different locations with the same loading conditions resulted in variations, considering the statistical distribution of the pores in the surface of the material (Fig. 2). For sintered ceramics, the coefficient of variation was established ranging from 15% to 25%[55]. For porous ceramics, large error bars were reported. For instance, the contact mean pressure of alumina containing 19% porosity[56] revealed 50%-85% coefficients of variation at the low penetration depth/load (5 mN) in nanoindentation. The Vickers hardness of NiO-ZrO2 with 20% porosity[57] also demonstrated above 50% coefficients of variation. Therefore, the large data variation is inevitably expected to occur in pre-sintered zirconia containing a higher porosity of 48%.
The overlap of the resistance to plasticity values at different loading rates in Fig. 3 accounts for its statistical insignificant loading rate independence (p > 0.05). This is because within the loading rates applied, there was no significant difference between the indentation sizes or there were not enough impact stresses developed at the high loading rate, which could have affected the hardness value [58]. The contact hardness of the pre-sintered zirconia applied for the computation of the resistance to plasticity also revealed the loading-rate independence[10]. Thus, the loading-rate independent resistance to plasticity is also consistent with previous work where the loading rate minimally influenced the measured microhardness of some materials[58]. Nakamura et al.[59] suggested the average values from multiple indentations at various locations for the determination of mechanical properties for porous ceramics. Thus, the resistance to plasticity for pre-sintered zirconia from 24 indentations is 3.82 ± 1.92 GPa. This value approximately agrees with the load-independent indentation-induced resistance to plasticity (3.5 GPa) for porous zirconia coatings determined at high loads from 100 mN to 10 N[60]. This confirms the validity of the use of Sakai's model[32] in extracting the resistance to plasticity at the nano scale for this material. Oyen[38] extracted the resistances to plasticity for engineering materials such as fused silica and aluminium, and mineralized tissues including bones, dentin and enamel. Aluminium and fused silica represent ductile and brittle materials, respectively. The resistance to plasticity for pre-sintered zirconia is greater than that of aluminium (0.33 GPa) by 3.49 GPa, and less than that of fused silica (350 GPa) by 346.18 GPa. The small difference in the resistance to plasticity between pre-sintered zirconia and ductile aluminium in comparison with the big difference between pre-sintered zirconia and brittle fused silica confirms that pre-sintered zirconia exhibits quasi-plastic property.
Deformation partitioning provides insights into the respective contribution of the elastic and plastic deformations to the total material deformation and reveals the dominant deformation mechanism. Fig. 4(b) shows that plastic deformation was dominant at all loading rates, reconfirming that pre-sintered zirconia is quasi-plastic. However, Fig. 4(a) shows that this material did not have the single-valued elastic and plastic deformation components at all loading rates. Therefore, it is difficult to compare the elastic and plastic deformation components of pre-sintered zirconia with the published data[38] because the latter was determined at a constant loading rate.
In nanoindentation of elastoplastic materials using sharp indenters, like the Berkovich indenter, the loading cycle consists of elastic and plastic deformation portions[48]. At the elastic-plastic transition point (i.e., the yielding point), the initially sharp Berkovich tip may inevitably blunt and the geometry of the indenter can be approximated as spherical[61]. With this fortuitous geometry, it is possible to predict the elastic portion using the following Hertzian law[62, 63, 64]:
where P is the load, R is the radius of the indenter tip, Er is the reduced modulus and h is the instantaneous indentation depth. Eq. (22) is based on isotropic continuum elasticity and the first point at which the loading curve deviates from it marks the yielding point. At the yield point, which is generally regarded as the first pop-in on the loading cycle for fully dense materials, the indenter travels without a measured increase in the applied load, causing the maximum shear stress, τ max, to occur[65]. Thus, this maximum shear stress can be estimated by the following relation[65]:
where Pc is the critical load to initiate plasticity. While the first pop-in load on the loading cycle corresponds to the Pc for dense materials, it may not be true for porous ceramics. The first pop-in on the loading curve of the porous ceramics may be due to the influences of porosity, roughness, or cracks[60]. Consequently, the load at the first pop-in on the loading curve of porous ceramics may not represent the yielding critical load. Therefore, in this work, the critical load, Pc, for pre-sintered zirconia was determined using the total elastic contact displacement, he, calculated from Eq. (9). Then the Pc should correspond to the load predicted by the Hertzian law (Eq. (22)) at that displacement as presented below:
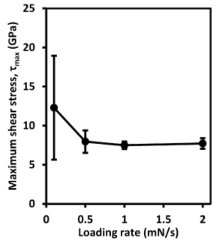
The dependence of the elastic and plastic displacements on the loading rate in Fig. 4(a) can be explained in terms of the maximum shear stress developed using Eq. (23) and the indentation energies. Fig. 7 shows the maximum shear stress, τ max, versus the loading rate. At the lowest loading rate of 0.1 mN/s, the maximum shear stress was highest, approximately twice the value at 0.5 mN/s loading rate. The maximum shear stress was loading rate-independent above 0.5 mN/s. The high shear stress at the lowest loading rate of 0.1 mN/s caused a quick transition from the elastic deformation to the plastic deformation. The quick elastic-plastic transition led to the low elastic strain energy and the high plastic energy (Fig. 5). The indentation energy is the product of the force (which in Sakai's model[32] is the same for both the elastic and the plastic deformation components in series) and the displacement. Thus, the low elastic strain energy produced the low elastic displacement while the high plastic energy led to enhanced plastic displacement. As the loading rate increased, the compressive stress between the indenter tip and the material increased due to the increase in strain rate. This high compressive stress lowered the maximum shear stress to cause yielding. Therefore, the elastic strain energy improved slightly while the plastic energy reduced correspondingly. The higher elastic strain energy led to the larger elastic displacement while the reduced plastic energy lowered the plastic displacement at higher loading rates.
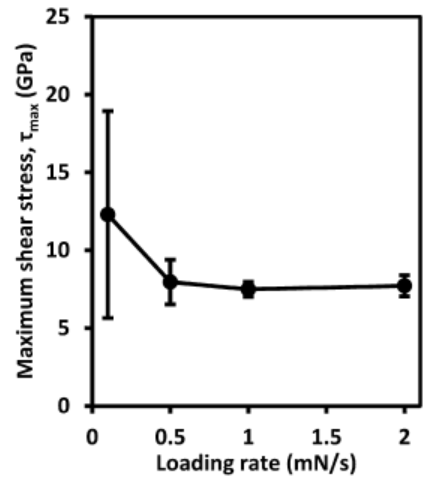 | Fig. 7. Maximum shear stress, τ max, versus loading rate. Each data point is the mean value of six repeated indentations; the error bars correspond to ± 1 standard deviation for the six repeats. |
The statistical insignificance of the normalized indentation elastic strain, Ue/Ut, and indentation absorbed, Ur/Ut, energies, (Fig. 5) implies that they are material characteristic parameters. Thus the loading rate independent normalized indentation absorbed energy for pre-sintered zirconia was 0.75 ± 0.08, which is very close to that of copper (≈ 0.9)[45], a well-known ductile material but higher than that of sintered zirconia (0.58 ± 016)[46]. This means that pre-sintered zirconia will exhibit lower resistance to plastic deformation than sintered zirconia during abrasive and erosive contacts. This observation agrees with previous studies where porous hydroxyapatite exhibited more ductility than sintered hydroxyapatite[66], and highly porous alumina[67] and silicon nitride[68] displayed higher ductility than their sintered ones. However, the higher normalized indentation absorbed energy of pre-sintered zirconia indicates that it is less resistant to wear than the sintered zirconia due to the frictional effect that may be caused by the higher plasticity[43, 44].
It is noted that both nanoindentation and nanoscratch tests have been applied to analyse the fundamental deformation and fracture processes that occur during machining[69, 70, 71, 72].Although nanoindentation is quasi-static, the relative sliding speed between the tool tip and the workpiece in nanoscratching is much smaller than the speeds used in machining[69, 70, 72]. Hence, neither nanoscratching nor nanoindentation can simulate all aspects of the material removal process[70]. However, as machining is similar to an indentation process, indentation mechanics can predict machining performance with reasonably good accuracy[15] and the indentation approach was used to investigate brittle-ductile transitions in ceramics and has provided useful results for tool-workpiece interactions in machining[27, 70]. Another advantage of indentation over nanoscratching is that nanoindentation can provide the energy absorbed during nanoindentation, which can be used for the prediction of the specific cutting energy in machining[15]. For these reasons, a nanoindentation approach rather than a nanoscratch approach is superior in determining the ceramic machinability.
An important application of the dependence of the elastic displacement on the loading rate can be hypothesized for the prediction of an improved machinability with a high deformation rate for the material studied. The mechanical responses of pre-sintered zirconia to sharp pyramidal indentations at different loading rates can be likened to its abrasive machining behaviour using sharp diamond abrasives at different deformation rates. In machining, many abrasives are involved in the cutting process with each abrasive impacting its own normal force on the workpiece and this normal force per abrasive can be very low[73]. This normal load per cutting abrasive in the machining process is similar to the peak load in nanoindentation tests and is responsible for the elastic/plastic deflections and deformations of the workpiece[74]. It has been analysed that the contact lengths, Lc, between abrasives and workpiece materials play a significant role in the machining performance, including surface roughness, cutting forces and cutting efficiency. An expression has been developed relating the contact length, Lc, to the elastic deflections, δ , of the workpiece and the abrasive wheel caused by the normal grinding force and depth of cut, ae, and the effective wheel diameter, de[75]:
Lc2=de (ae+4δ ) (25)
As shown in Eq. (25), an increase in the elastic displacement of either the workpiece or the abrasive could enhance the elastic deflection, δ , which in turn would increase the contact length, Lc, in abrasive machining. In this study, the elastic displacement increased with the loading rate (Fig. 4(a)). Therefore, it is anticipated that the contact length would also increase proportionately with the work-material deformation rate at a constant depth of cut and grinding wheel diameter. The benefits associated with the increase in contact lengths during abrasive machining include reductions in maximum grinding temperatures, surface roughness and fracture wear of diamond tools[39]. Thus, machining pre-sintered zirconia at high deformation rates is predicted to improve its machinability. This assertion complements the previous conclusion of Alao and Yin[10], in which the application of high deformation rates was suggested to avoid brittle fracture during machining. However, the practical realization of high-quality abrasive machining of pre-sintered zirconia remains a topic for future studies.
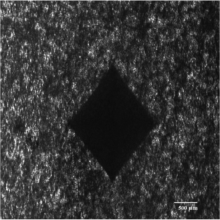
The loading-rate independent resistance to machining-induced cracking in Fig. 6 with variation coefficients (18% to 51%) reflects a characteristic material property for machining. As explained above, the large variation coefficient is attributed to the statistical distribution of the pores on the material surface (Fig. 2). Furthermore, to ascertain the correctness of the resistance to machining-induced cracking in Fig. 6, a deeper analysis is required to substantiate the authenticity of the used fracture toughness value for the material. Before using the 1 MPa m1/2 value[53], we attempted to measure the toughness using Vickers (Zwick/Roell, ZHVµ -S Indentec, UK) indentation fracture method but radial/median cracks were not formed at the indented corners even with the highest load, 19.6 N, on the system (Fig. 8). This indicates the unsuitability of the indentation fracture method for the fracture toughness measurement for this material. In addition, a porosity-fracture toughness relationship was developed to predict the fracture toughness for porous ceramics[76]:
KIc=(2γ oEo)1/2 (1-P)c+0.5 (26)
where KIc is the fracture toughness of the porous ceramic, γ o and Eo are the specific fracture energy and Young's modulus of the fully dense material, and P is the porosity. The c is an exponent arising from similar elastic modulus-porosity empirical relationships based on the concept of minimum solid area [76]:
E=Eoexp(-aP) (27)
E=Eo (1-P)b (28)
where E is Young's modulus of the porous ceramics, Eo is Young's modulus of the fully dense material; a and b are empirical exponents. Eo, a and b are determined from experimental results by curve fitting procedure. Accordingly, the c in Eq. (26) can be related to either a or b in Eqs. (27) and (28)[76]. For porous zirconia, these modulus-porosity relationships were reported as[77]:
E=216exp(-3.69P) (29)
E=210.6(1-P)2.96 (30)
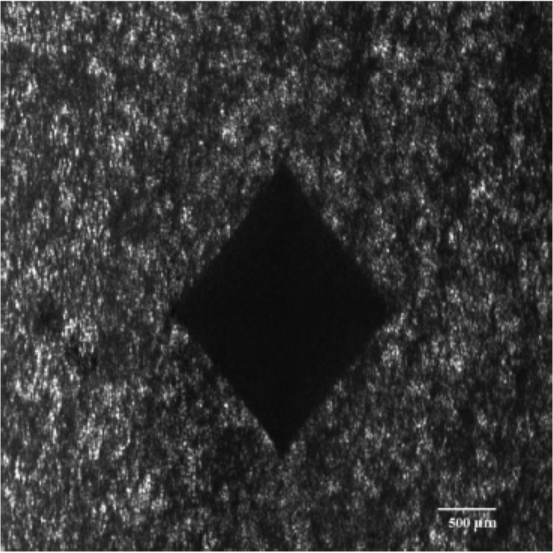 | Fig. 8. Optical micrograph of a Vickers indentation pattern of pre-sintered zirconia at 19.6 N indentation load. |
Thus, a = -3.69 and b = 2.96. Determination of the correct exponent to be used as c in Eq. (26) between a and b requires knowing Young's modulus, E, of the pre-sintered zirconia. Alao and Yin [10] reported E for this material in the range of 24.39-34.25 GPa. So, by taking P as 0.483, E in Eq. (29) becomes 36.34 GPa, which is outside the reported value but it is 29.88 GPa in Eq. (30), which is within the reported range. Therefore, the c was taken as 2.96. Substituting c = 2.96, γ o = 168.65 J/m2[46] and Eo = 168.19 GPa[54] in Eq. (26), the predicted fracture toughness is 0.8 MPa m1/2, which is very close to the measured value by Deng et al.[53]. This agreement confirms the validity of the used fracture toughness for the material. Therefore, the predicted resistance to machining-induced cracking for pre-sintered zirconia from 24 indentations was 132.74 ± 15 J/m2. Alao and Yin[46] has previously reported the M value of 1333.88 ± 440.76 J/m2 for the material using a higher fracture toughness (3.17 MPa m1/2) taken from Mitov et al.[78], which may have been overestimated for pre-sintered zirconia. Due to the large range of the fracture toughness for pre-sintered zirconia determined by different methodology, there may be an upper-lower limit for its resistance to machining-induced cracking. Nevertheless, the predicted resistance to machining-induced cracking of pre-sintered zirconia (132.74 ± 15 J/m2) is still higher than those for sintered ceramics such as glass, SiC, MgO and Al2O3[45] but less than sintered zirconia (445.44 ± 106.32 J/m2)[46].
The low resistance to machining-induced cracking of pre-sintered zirconia can be ascribed to its low fracture energy in spite of its high indentation absorbed energy. Rice[79] clearly pointed out that single (isolated) or multiple (interconnected) pores in polycrystalline ceramics might form equatorial cracks approximately one-half grain deep into the matrix and thus become sharp cracks that could propagate across the grains. Evidence of isolated and interconnected pores is shown in Fig. 2 for this material. Therefore, the low fracture energy and toughness are attributed to the porosity in the material. In addition, the low resistance to machining-induced cracking of this material indicates that during machining, under a small applied normal force, the sintered necks between grains may easily break and the grains fill the pores leading to the grain/particle coalescence. This coalescence within a localized volume beneath the indenter may lead to the material being compacted or kinked as observed by Alao and Yin[10]. This assertion is in line with the intragranular microfracture theory provided for the plasticity of porous silicon nitride[80]. In addition, the grain/particle coalescence may also explain why the indentation absorbed energy was higher than the elastic strain energy at any loading rate because as the densification increased, more energy would be consumed (Fig. 5). Finally, the same argument can be extended to the Vickers imprint (Fig. 8) in which compaction occurred due to the grain/particle coalescence underneath the indenter without the brittle micro-crack propagation along the indenter's corners.
We have characterized elastic and plastic deformations and the resistance to machining-induced cracking for pre-sintered zirconia to predict its machinability using nanoindentation tests. Both the resistance to plasticity and the resistance to machining-induced cracking were independent of the loading rates. The resistance to plasticity was 3.82 ± 1.92 GPa, ranking pre-sintered zirconia more quasi-plastic. The resistance to machining-induced cracking for pre-sintered zirconia was 132.74 ± 15 J/m2. This low resistance to machining-induced cracking suggests easy breakage of sintered necks and subsequent intrusion of the material into the pores leading to compaction or kinking and absorption of more energy in the process. The elastic displacement increased with the loading rate due to lower shear stresses developed and the higher elastic strain energy at the higher loading rate. The plastic displacement decreased with the loading rate due to higher shear stresses and the lower indentation absorbed energy at the higher loading rate. At all loading rates, the plastic displacements/deformation components dominated over the elastic displacements/deformation components. The indentation absorbed energy was also higher than the elastic strain energy. This reconfirmed the quasi-plastic feature of the material. The higher indentation absorbed energy and the increased elastic displacements at higher loading rates indicate improved machinability for the material at high deformation rates.
The authors thank Dr. Shane Askew of the Advanced Analytical Center at James Cook University (JCU) for experimental assistance; Mr. Phillip Mcguire of Northern Petrographics Pty Ltd for sample preparation. A.R. Alao acknowledges the JCU PhD (JCU IPRS) scholarship. The work was supported by the JCU Collaboration Grants Scheme awarded to L. Yin.
The authors have declared that no competing interests exist.
| [1] |
|
| [2] |
|
| [3] |
|
| [4] |
|
| [5] |
|
| [6] |
|
| [7] |
|
| [8] |
|
| [9] |
|
| [10] |
|
| [11] |
|
| [12] |
|
| [13] |
|
| [14] |
|
| [15] |
|
| [16] |
|
| [17] |
|
| [18] |
|
| [19] |
|
| [20] |
|
| [21] |
|
| [22] |
|
| [23] |
|
| [24] |
|
| [25] |
|
| [26] |
|
| [27] |
|
| [28] |
|
| [29] |
|
| [30] |
|
| [31] |
|
| [32] |
|
| [33] |
|
| [34] |
|
| [35] |
|
| [36] |
|
| [37] |
|
| [38] |
|
| [39] |
|
| [40] |
|
| [41] |
|
| [42] |
|
| [43] |
|
| [44] |
|
| [45] |
|
| [46] |
|
| [47] |
|
| [48] |
|
| [49] |
|
| [50] |
|
| [51] |
|
| [52] |
|
| [53] |
|
| [54] |
|
| [55] |
|
| [56] |
|
| [57] |
|
| [58] |
|
| [59] |
|
| [60] |
|
| [61] |
|
| [62] |
|
| [63] |
|
| [64] |
|
| [65] |
|
| [66] |
|
| [67] |
|
| [68] |
|
| [69] |
|
| [70] |
|
| [71] |
|
| [72] |
|
| [73] |
|
| [74] |
|
| [75] |
|
| [76] |
|
| [77] |
|
| [78] |
|
| [79] |
|
| [80] |
|