


Microstructures and Mechanical Properties of Vacuum Brazed Ti3Al/TiAl Joints Using Two Ti-based Filler Metals
Cite this Article
H.S. Ren, H.P. Xiong, B. Chen, S.J. Pang, B.Q. Chen, L. Ye. Microstructures and Mechanical Properties of Vacuum Brazed Ti3Al/TiAl Joints Using Two Ti-based Filler Metals . Journal of Materials Science & Technology, 2016, 32(4): 372-380 
Permissions
Copyright reserved, Editorial board of Journal of Materials Science & Technology
Microstructures and Mechanical Properties of Vacuum Brazed Ti3Al/TiAl Joints Using Two Ti-based Filler Metals
Abstract
Vacuum brazing of Ti3Al-based alloy to TiAl was firstly carried out by Ti—15Cu—15Ni (wt%) filler metal. A continuous Ti3Al band, Ti2Ni and Ti2Cu/Cu3Ti phases formed and the joint showed a shear strength of 53.8-112.4 MPa at room temperature. For the improvement of the joint strength, a new Ti—Zr—Cu—Ni—Fe filler alloy was designed, and its wettability on Ti3Al and TiAl substrate was studied with the sessile drop method. After holding for 20 min at 1010 °C the Ti—Zr—Cu—Ni—Fe filler showed a low contact angle of 20° and 21° on Ti3Al and TiAl substrate, respectively. The joint brazed with this novel filler mainly consisted of Ti-rich area, Ti3Al reaction layer and residual filler metal. With the increase of the brazing temperature, the amount of residual filler metal decreased and the Ti3Al reaction layer thickened. The Ti3Al/TiAl joint brazed with Ti—Zr—Cu—Ni—Fe filler exhibited a lower hardness than that brazed with Ti—Cu—Ni filler. The corresponding joints brazed at 950 °C for 5 min presented the shear strength of 257.6 ± 33.6 MPa at room temperature and 304.8 ± 9.9 MPa at 600 °C.
Keyword:
Brazing; Titanium aluminides; Microstructure; Shear strength
1. Introduction
Titanium aluminides are one of the most promising intermetallic compounds and a lot of efforts have been made to develop their applications in the past decades[1]. In particular, Ti3Al-based alloy is a potential structural material for aerospace applications due to its relatively low density, high specific strength, excellent creep behavior and good oxidation stability at high temperature[2 , 3]. To realize its practical application, developing joining technologies of Ti3Al to itself or other materials such as TiAl intermetallics has become an important issue.
Fusion welding, diffusion bonding and brazing have been used to join Ti3Al-based alloys. For instance, Wu et al.[4] studied the joining of Ti3Al using laser beam welding technology and the joint strength at room temperature was equivalent to that of the base material. The dissimilar joining of Ti22Al-25Nb (at.%) to Ti— 6.5Al— 3.5Mo— 1.5Zr— 0.3Si (wt.%) alloys was conducted using electron beam welding technique[5], and the joint strength was even higher than that of base material. Zou et al.[6] investigated transient liquid phase diffusion bonding of Ti— 22Al— 25Nb (at.%) alloy with Ti— 15Cu— 15Ni (wt.%) filler and concluded that slow cooling technology could modify the microstructure and improve the joints strength. Moreover, Cadden et al.[7] investigated the brazing of Ti— 13.4Al— 21.2Nb (at.%) alloy using Ti— Ni system fillers. Commercial laminated Ti— 15Cu— 25Ni (wt.%) foil produced joints with high nickel segregation and caused the formation of high amount of centerline alpha-two phase that contributed to poor tensile behavior. In Shiue et al.[8], the dissimilar joining between Ti3Al and Ti— 6Al— 4V alloy was carried out and the presence of continuous Ti2Ni phase deteriorated the joint strength. However, these studies mainly focused on the joining of Ti3Al to itself or Ti-based alloys.
In general, the service temperature of the Ti3Al-based alloys is about 650 ° C, whereas TiAl intermetallics may offer a higher service temperature of 760-850 ° C. Besides, the plasticity of Ti3Al-based alloys is much better than that of TiAl intermetallics[9]. Hence, in the case of high-temperature engineering application, the dissimilar joining of Ti3Al to TiAl should be more attractive than Ti3Al— Ti alloy combination[10]. Nevertheless, the study on the joining of Ti3Al to TiAl has been scarcely reported. Moreover, the joints brazed with Al-, Ag- or Au-based filler metals have poor thermal resistance and cannot be used above 500 ° C[11]. Therefore, in this study, vacuum brazing of Ti3Al to TiAl was conducted using the traditional Ti— 15Cu— 15Ni (wt.%) filler metal. However, due to the formation of brittle Ti2Ni/Ti2Cu intermetallic compounds, the joint presented a low strength. Thus, a novel Ti— Zr— Ni— Fe system filler alloy was proposed. Compared with Ti— 15Cu— 15Ni (wt.%), the total concentration of Cu and Ni in the novel filler significantly decreased. Element Zr was chosen as the melting point depressant. A small quantity of Fe was added which expected to improve the filler strength. The microstructural evolution, micro-hardness and shear strength of Ti3Al/TiAl joints brazed with the two filler metals were investigated.
2. Experimental
In this present study, the Ti3Al-based alloy used was Ti— 24Al— 15Nb— 1Mo (at.%) alloy composed of α 2-Ti3Al, O-Ti2AlNb and β /B2 phases. The nominal composition of TiAl intermetallics was Ti— 48Al— 2Cr— 2Nb (at.%) with a fully lamellar microstructure. The traditional Ti— 15Cu— 15Ni (wt.%) filler metal was chosen to braze Ti3Al to TiAl. Moreover, a new Ti— Zr— Ni— Fe filler alloy was also designed for the Ti3Al/TiAl joining, in which the content of element Zr was 20-28 wt.%, and the total amount of alloying elements Cu, Ni and Fe was 16-24 wt.%, less than that of Cu and Ni in the Ti— 15Cu— 15Ni (wt.%) filler metal. The liquidus temperatures of the two filler metals were measured by differential thermal analysis (DTA).
| Table 1 EDS analysis results for the spots in Fig. 1 (at.%) |
The two filler alloys were fabricated into brazing foils by a rapid solidification technique, with a thickness of about 50 µ m, and double foil layers were laminated in the subsequent brazing experiment. The wettability of the Ti— Zr— Ni— Fe filler alloy on Ti3Al and TiAl substrate was studied with the sessile drop method. The size of the polished Ti3Al and TiAl substrate was 20 mm × 20 mm × 3 mm. The vacuum chamber of the furnace was first evacuated to 1.5 × 10⁻³ Pa at room temperature. Subsequently, the vacuum system was turned off, and high-purity (99.999%) argon was put into the chamber with a pressure of 0.1 MPa. Then the chamber was evacuated to 1.5 × 10⁻³ Pa again, the vacuum system was once again turned off, and argon was put into the chamber for a second time. The Ti— Zr— NiFe filler sample was heated to 1010 ° C from ambient temperature at a heating rate of 8-10 ° C/min, and held at this temperature for 20 min. During the heating process, the morphologies of the molten droplet were recorded dynamically by taking sideways photos. Then the contact angles on the Ti3Al and TiAl substrate were calculated based on those droplet images using computer method based on the Laplace equations. The accuracy of the contact angle measurements should be within ± 1° .
The Ti3Al and TiAl samples for brazing experiment were sectioned to dimensions of 10 mm × 3 mm × 3 mm and 20 mm × 10 mm × 3 mm, respectively. The overlapping area of the joint was 3 mm × 10 mm. Prior to brazing, surfaces to be joined were ground by SiC papers, and then the joined samples were ultrasonically cleaned in acetone. Firstly, Ti3Al/TiAl brazing experiment was carried out using Ti— Ni filler metal, two brazing temperatures of 960 ° C and 980 ° C were chosen, the brazing time was 5-10 min. Concerning the Ti— Zr— Ni— Fe filler, brazing temperature varied from 880 to 980 ° C, with a constant brazing time of 5 min.
| Table 2 EDS analysis results for the spots in Fig. 5 (at.%) |
The mechanical characterization was performed by micro-hardness and shear strength. Micro-hardness test of various areas across the Ti3Al/TiAl joints was performed using a Vickers hardness tester (450-SVD) with a load of 50 g and load time of 15 s. At least 3 indentations were performed for each microzone. According to the test standard of GB/T7413-2005, the shear strength of the brazed joint was measured using an electronic universal materials testing machine (INSTRON5887) at room temperature, 500, 600 and 650 ° C, respectively. The reported average strength was calculated from at least three joints under the same brazing condition. The joint microstructure and the cross sections of the joints subjected to the shear test were examined using scanning electron microscope (SEM) equipped with an energy dispersive spectrometer (EDS). Furthermore, the fracture surface was also analyzed using an X-ray diffraction (XRD) spectrometer.
3. Results and Discussion
3.1. Vacuum brazing of Ti3Al to TiAl with Ti-Cu-Ni filler metal
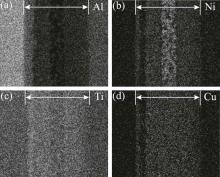
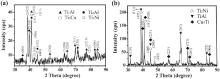
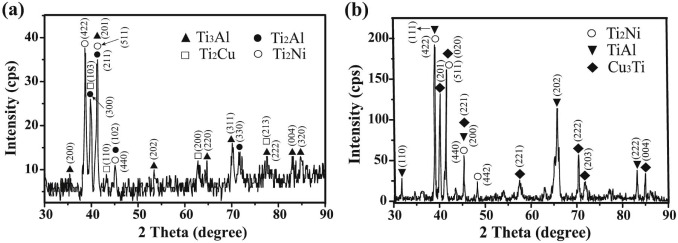
According to differential thermal analysis (DTA) result, the liquidus temperature of Ti— Ni filler metal was 934.1 ° C. Fig. 1 displays the backscattered electron images of Ti3Al/TiAl joint brazed with this filler alloy at 960 ° C and 980 ° C. Fig. 2 presents element area distribution maps of elements Al, Ti, Cu and Ni within the joint brazed at 960 ° C for 10 min (Fig. 1(a)). As can be seen in Fig. 1(a), a lamellar structure (microzone “ 1” ) with a thickness of about 4.5 µ m, composed of alternate black and grey strips, is visibly adjacent to TiAl substrate. Fig. 2(a) indicates that microzone “ 1” contains high Al. Based on the EDS analysis results listed in Table 1, the reaction product in microzone “ 1” is deduced to be Ti2Al dissolved with Cu and Ni. And the XRD pattern in Fig. 3 further verifies the presence of the Ti2Al phase.
 | Fig. 1. Backscattered electron images of brazed Ti3Al/TiAl joints using Ti— Ni filler metal: (a) 960 ° C/10 min; (b) 980 ° C/10 min; (c) 980 ° C/5 min. |
On the basis of previous studies[12, 13], Ti2Al was hexagonal with lattice parameters a = 0.29 nm and c = 1.39 nm, and during the phase transformation, Ti2Al was an intermediate phase between α 2-Ti3Al and γ -TiAl phases. Besides, Xiong et al.[14] demonstrated a chemical reaction of Ti + TiAl = Ti2Al occurring during hot-press sintering at 1473 K. In fact, in the present experiment, during brazing, Ti atoms diffused from the molten filler alloy into the solid-state TiAl substrate and on the contrary to Al atoms due to the concentration gradient. Therefore, the Ti2Al phase might appear during the following diffusion reaction: Ti + TiAl = Ti2Al.
For microzone “ 2” in Fig. 1(a), a black reaction band, with a thickness of about 7 µ m, formed adjacent to TiAl substrate. The EDS analysis results (Table 1) illustrate that this reaction band mainly consists of Ti (75.18 at.%) and Al (22.83 at.%). From the Ti— Al binary phase diagram[15], the Ti content in Ti3Al phase ranges from 60 to 76 at.%. Thus, this reaction band can be identified as Ti3Al phase, but it should have been dissolved with low concentration of Cu and Ni.
In addition, a plenty of white blocks (microzone “ 4” ) are visible in the center of the three brazed seams in Fig. 1. The EDS analysis results (Table 1) indicate that they are enriched with Ni and depleted with Al also shown in Fig. 2(a, b). And the content of Ti in microzone “ 4” (Fig. 2(c)) is lower than the neighbored microzones “ 3” and “ 5” . On the contrary, the content of Cu in microzones “ 3” , “ 4” and “ 5” are similar (Fig. 2(d)). Besides, it is noticeable that the total amount of Cu and Ni (Ti— 9.9Cu— 27.9Ni (wt.%), microzone “ 4” ) in the white blocks is higher than that of the original Ti— 15Cu— 15Ni (wt.%) filler metal due to the segregation during isothermal solidification[16]. With regard to the Ti— Ni filler metal, the addition of Cu and Ni could decrease its melting point[17 , 18]. Therefore, the white blocks are the last solidified area throughout the joint interface. Based on the EDS and XRD (Fig. 3) results, the white blocks should be composed of Ti2Ni and Ti2Cu/Cu3Ti phases. According to the chemical composition and pseudo Ti— (Ni, Cu) binary phase diagram[16], as temperature decreased, a reaction of L→ Ti2Ni + Ti2Cu could possibly occur within the white blocks due to the high concentration of Cu and Ni.
 | Fig. 2. Element area distribution maps of Al (a), Ni (b), Ti (c) and Cu (d) in Fig. 1(a). |
Besides, according to Ti— Cu and Ti— Ni binary alloy phase diagrams[19], the maximum solubilities of Cu and Ni in the α -Ti are as low as 1.6 at.% and 0.2 at.%, respectively. And eutectoid reaction of β -Ti→ α -Ti + Ti2Cu and β -Ti→ α -Ti + Ti2Ni could occur at 790 ° C and 765 ° C, respectively. Hence, based on Table 1, Ti2Ni and Ti2Cu may form within microzones “ 3” and “ 5” through an eutectic reaction of β -Ti(Cu, Ni)→ α -Ti + Ti2Ni + Ti2Cu. In microzone “ 6” , 7.09 at.% Nb is detected due to its adjacency to Ti3Al substrate and the phase can be identified as Ti-rich phase. In general, the phase sequence within the Ti3Al/TiAl joint brazed with Ti— Ni from TiAl side to Ti3Al side can be described as follows: TiAl substrate/Ti2Al/Ti3Al/Ti-rich phase/Ti2Ni + Ti2Cu + Cu3Ti/Ti-rich phase/Ti3Al substrate.
 | Fig. 3. XRD patterns of the fracture surfaces after shear test at room temperature for specimen brazed using Ti— Ni filler metal at 960 ° C for 10 min: (a) Ti3Al side; (b) TiAl side. |
Similar to Fig. 1(a), a continuous α 2-Ti3Al band (microzone “ 8” ) is also found in Fig. 1(b) and (c). Some previous studies demonstrated that a continuous Ti3Al band always formed when Ti— 15Cu— 15Ni (wt.%) filler was used in the TiAl joining[20, 21, 22, 23]. For instance, Lee et al.[20 , 21] reported the formation of a continuous α 2-Ti3Al band in brazed seams when Ti— 15Cu— 15Ni (wt.%) filler was used to join Ti50Al50 and Ti— 48Al— 2Nb— 2Cr (at.%) alloys, respectively. Wallis et al.[22] confirmed the presence of a continuous α 2-Ti3Al band within TiAl joints brazed with Ti— 15Cu— 15Ni (wt%) alloy. Besides, a continuous Ti3Al reaction band was also identified in infrared brazed Ti50Al50 and Ti— 6Al— 4V joints adjacent to Ti50Al50 using Ti— Ni system filler alloys and the variation of brazing time or temperature had minor effect on the thickness of the Ti3Al band[23]. Due to the limited solubility of Cu and Ni in the α 2-Ti3Al ordered structure, once the continuous α 2-Ti3Al band formed, the further atomic inter-diffusion between TiAl substrate and the filler metal would be obstructed[21]. However, a certain amount of Cu and Ni (Table 1) is detected within microzones “ 1” and “ 7” , revealing that there is no continuous α 2-Ti3Al band to form when the TiAl substrate dissolves into the molten filler metal. The formation of α 2-Ti3Al phase probably results from the ordering transformation of Al-rich α -Ti during cooling cycle due to the limited solubility of Al in the α -Ti at low temperature[20 , 23].
3.2. Vacuum brazing of Ti3Al to TiAl with Ti— Zr— Ni— Fe filler metal
According to the DTA results, the liquidus temperature of the Ti— Zr— Ni— Fe filler metal is 857.7 ° C. Fig. 4 shows the wetting kinetics of this filler on Ti3Al and TiAl substrate. It is found that once the Ti— Zr— Ni— Fe alloy melts on the surfaces of Ti3Al and TiAl substrate, it displays a contact angle of 76° and 82° , respectively, indicating wetting with the substrates (Fig. 4(a)). With the increase of temperature, the contact angle decreases sharply, and when the Ti— Zr— Ni alloy sample is heated to 950 ° C, its contact angle on Ti3Al and TiAl substrate decreases to 22° and 32° , respectively. Subsequently, the contact angle decreases slowly and reaches 20° and 23° at 1010 ° C on Ti3Al and TiAl substrate, respectively.
Fig. 4(b) illustrates the influence of holding time on the wettability at 1010 ° C. The contact angle on Ti3Al substrate no longer changes with the prolonging of the holding time. In contrast, the contact angle on TiAl substrate further decreases and reaches the equilibrium value of 21° after being held for 840 s. Obviously, the Ti— Zr— Ni— Fe alloy shows a good wettability on both Ti3Al and TiAl substrates.
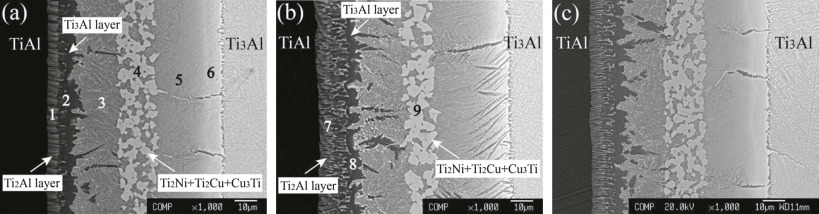
Fig. 5 presents the backscattered electron images of brazed Ti3Al/TiAl joints using the Ti— Zr— Ni— Fe filler under various brazing parameters. As can be seen in Fig. 5(a), many white blocks marked as “ 2” are visible within the brazed seam. According to the EDS results listed in Table 2, their composition is very close to that of the original filler metal and thus can be identified as residual Ti— Zr— Ni— Fe filler metal. Particularly, a continuous crack (indicated by the arrow in Fig. 5(a)) is observed within the white blocks adjacent to the TiAl substrate.
In addition, a reaction layer labeled as “ 1” formed between the residual filler metal and the TiAl substrate. The EDS results indicate that the layer is mainly composed of Ti and Al, with percentages of 66.11% and 22.27%, respectively. Therefore, it should be Ti3Al phase dissolved with Zr, Cu, Ni and Fe. Moreover, with the increase of brazing temperature, the Ti3Al reaction layer gradually exhibits a lamellar characteristic similar to microzone “ 1” in Fig. 1(a) and its thickness increases (Fig. 5(a)). For example, at the brazing temperature of 910 ° C, the Ti3Al layer is only 3.1 µ m (Fig. 5(b)), but its thickness is increased to 7.9 µ m for 980 ° C (Fig. 5(d)). As it is known, the diffusion between the base material and the solidified brazed seam always happens during the brazing process. Furthermore, the Ti3Al reaction layer exhibits a lamellar structure similar to the microstructure in the TiAl substrate. Thus, it is speculated that the Ti3Al reaction layer results from the solid state diffusion. Undoubtedly, the diffusion velocity of atoms becomes faster when the brazing temperature increased. As a result, the Ti3Al reaction layer thickens.
As shown in Fig. 5, with the increase of brazing temperature, the amount of the residual filler metal decreases. The continuous residual filler metal adjacent to TiAl substrate changes into small blocks. The element area map in Fig. 6(a) shows that the content of element Ti in the residual filler metal (microzone “ 7” in Fig. 5(c)) is lower than other areas in this joint. Besides, based on EDS results in Table 2, Al in the residual filler metal is much higher than that in Fig. 5(a) and the content of Al in microzone “ 7” is close to that in microzones “ 6” , “ 8” and “ 6” , as inferred by Fig. 6(b). This signifies that more TiAl substrate dissolves and Al atoms diffuse into the joint under higher brazing temperature. In addition, on the basis of the XRD pattern (Fig. 7), the phase constitution of microzone “ 7” should be Ti3Al, Ni10Zr7, Cu10Zr7 and Fe2Zr. It should be noticed that in the residual filler metal (microzone “ 7” in Fig. 5(c)) the distribution map of element Zr is in good agreement with that of Cu, Ni and Fe (Fig. 6(c-f)). In fact, according to the dissolution enthalpies listed in Table 3[24], the combining capacity of elements Cu, Ni and Fe with Zr is stronger than that with Ti. To some extent, this could explain why the formation of Ni10Zr7, Cu10Zr7 and Fe2Zr compounds is intensive, whereas Cu— Ti or Ni— Ti compounds are absent within the joint in Fig. 5(c). In general, the Ti3Al/TiAl joint brazed with Ti— Zr— Ni— Fe filler mainly consists of Ti-rich area, Ti3Al reaction layer and residual filler metal.
It should be noted that Ti2Al phase is formed adjacent to TiAl substrate in the joints brazed with Ti— Ni filler, however, absent in the case of Ti— Zr— Ni— Fe filler. In fact, according to Ti— Cu and TiNi binary alloy phase diagrams[19], it is easy for elements Cu and Ni to react with Ti, producing Ti— Cu and Ti— Ni intermetallic compounds. Due to the higher amount of Cu and Ni in Ti— Ni filler, the activity of element Ti in Ti— Zr— Ni— Fe filler should be stronger. As a consequence, during the brazing process, more Ti atoms would diffuse from Ti— Zr— Ni— Fe filler into the TiAl substrate, directly forming Ti3Al reaction layer through the diffusion reaction: 2Ti + TiAl = Ti3Al. On the contrary, fewer Ti atoms diffuse from Ti— Ni filler into TiAl substrate and the formation of Ti3Al band limited the diffusion of Ti. Therefore, γ -TiAl transforms into the intermediate phase of Ti2Al[12].
3.3. Micro-hardness of the joints brazed with the two kinds of filler alloys
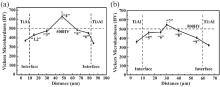
Vickers micro-hardness profiles across the dissimilar Ti3Al/TiAl joints are shown in Fig. 8. As can be seen, the hardness values within the brazed seams are higher than those of the joined base materials. In the Ti3Al/TiAl joint brazed with Ti— Ni filler alloy at 960 ° C for 10 min (Fig. 8(a)), the maximum hardness (633.1 HV) appears within the white blocks (labeled “ 4” in Fig. 1(a)), which consist of Ti2Ni and Ti2Cu/Cu3Ti phases. Similarly, in laser welded Ti— 6Al— 4V/Nitinol joint, brittle intermetallics of Ti2Ni and Ti2Cu are detected by XRD and result in hardness peak within the joint[25]. Previous studies proved that the hardness of Ti2Ni was 700 HV[26] and that of Ti2Cu was 530 HV[27]. Therefore, in this study, the white blocks present the highest hardness. Microzones “ 3” and “ 5” in Fig. 1(a) are probably composed of Ti-rich phase, Ti2Ni and Ti2Cu, exhibiting a same hardness level of about 500 HV. Despite the formation of Ti2Ni and Ti2Cu intermetallic compounds, the presence of the plastic Ti-rich phase makes their hardness value significantly lower than that of the white blocks in microzone “ 4” . Moreover, the spots “ 1, 2” in Fig. 8(a) indicate that the hardness value (431.1 HV) in microzones “ 1” (Ti2Al phase) and “ 2” (Ti3Al phase) is higher than that of the TiAl substrate (372.3 HV). Owing to the dissolution of Cu and Ni, microzone “ 6” (452.8 HV) is harder than the Ti3Al substrate (341.6 HV).
With regard to the Ti3Al/TiAl joint brazed with the novel Ti— Zr— Ni— Fe filler alloy at 950 ° C for 5 min (Fig. 5(c)), the hardness profile (Fig. 8(b)) displays a variation trend similar to that in Fig. 8(a). Its maximum hardness (545.3 HV) occurs within the residual filler metal composed of Ti3Al, Ni10Zr7, Cu10Zr7 and Fe2Zr. The hardness values of Ti3Al and Cu10Zr7 are 454 HV[28] and 475 HV[29], respectively, evidently lower than those of Ti2Ni (700 HV) and Ti2Cu (530 HV). According to Meny and Champigny[30], the Ni10Zr7 phase (600 HV) was softer than Ti2Ni phase. Even the Fe2Zr presented a high hardness (9.5 GPa≈ 968.7 HV) obtained by nanoindentation tests[31], its amount in the residual filler metal should be rather low (labeled as “ 7” in Fig. 5(c)) due to the low concentration of Fe. Accordingly, the maximum hardness in Fig. 8(b) is much lower than that in Fig. 8(a). Besides, the hardness in microzone “ 8” (Fig. 5(c)) is comparable to that in microzone “ 5” in Fig. 1(a). The Ti3Al reaction layer in Fig. 5(c) shows a hardness value of 458.9 HV close to that of α 2-Ti3Al phase (454 HV) in Schloffer et al.[28]. In addition, microzone “ 9” (Fig. 5(c)) presents a hardness value of 402.4 HV, higher than that of Ti3Al substrate but lower than that of microzone “ 6” (452.8 HV) in Fig. 1(a). Generally, the Ti3Al/TiAl joint brazed with the novel Ti— Zr— Ni— Fe filler metal shows a lower hardness than that brazed with Ti— Ni filler.
3.4. Shear strength of the joints brazed with the two kinds of filler alloys
Table 4 illustrates the average shear strength of Ti3Al/TiAl joints brazed with Ti— Ni and Ti— Zr— Ni— Fe filler metals at room temperature (RT). The joints brazed at 960 ° C and 980 ° C using Ti— Ni filler show low shear strengths. With regard to the Ti— Zr— Ni— Fe filler metal, the shear strength increased firstly and then decreased as the brazing temperature increased. The shear strength of 257.6 ± 33.6 MPa achieved maximum for the joints brazed at 950 ° C for 5 min (Table 4). In addition, the shear strength of Ti3Al/TiAl joints was also measured at high temperature, as shown in Fig. 9. The joints exhibit a higher strength at high temperature than that at room temperature (RT). At room temperature, thermal expansion coefficient of the Ti3Al substrate is about 9.1 × 10⁻⁶ ° C-1 and that for the TiAl substrate is about 10.8 × 10⁻⁶ ° C-1[32]. Hence, residual thermal stresses will yield to some extent within the dissimilar Ti3Al/TiAl joint. With the increase of test temperature, the residual stresses were released to a certain extent and the joint strength improved. Particularly, the shear strength at 600 ° C reached 304.8 ± 29.9 MPa (Fig. 9). However, when the test temperature further increased to 650 ° C, the joint strength slightly decreased to 284.7 ± 9.9 MPa.
| Table 3 Dissolution enthalpies of elements Cu, Ni and Fe in melts of Ti and Zr (kJ/mol)[24] |
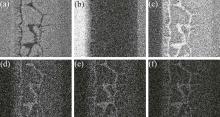
Fig. 10(a) and (b) shows the cross-sections of Ti3Al side after shear tests at room temperature of the joints using Ti— Ni filler. Cracks propagated along the Ti2Al phase or the interface between Ti2Al phase and Ti3Al band in Fig. 10(a) and the joint in Fig. 10(b) fractured at white blocks (Ti2Ni + Ti2Cu/Cu3Ti). The XRD results (Fig. 3(a) and (b)) for the two sides of the fractured joint together indicate that cracks propagate through the white blocks, Ti2Al phase and Ti3Al band. Similarly, within the Ti50Al50/Ti— 6Al— 4V joints brazed with Ti— Ni system filler alloys[23], a Ti3Al band also formed and cracks initiated from it due to its inherent brittleness. Besides, in the TiAl joint brazed with an amorphous Ti— 26.7Zr— 14.7Cu— 13.8Ni— 3.1Co (wt.%) ribbon, cracks propagated along Ti2Ni + Ti2Cu intermetallic compounds and the increase in the thickness of the brittle Ti2Ni + Ti2Cu layer results in a decrease of the bonding strength[33]. In this study, the micro-hardness measurement results indicate that the white blocks (Ti2Ni + Ti2Cu) lead to a high hardness and large brittleness of the joints. In other words, it is the formation of Ti2Al phase, continuous Ti3Al band and Ti2Ni + Ti2Cu/Cu3Ti intermetallic compounds that cause the low shear strength of the joints brazed with Ti— Ni filler.
Fig. 10(c-f) displays the cross-sections of Ti3Al side after shear tests at room temperature of the Ti3Al/TiAl joints using Ti— Zr— Ni— Fe filler at various brazing temperatures. For the joint brazed at 880 ° C, crack propagated along the continuous residual filler metal adjacent to the TiAl substrate. Undoubtedly, it was caused by the continuous crack as shown in Fig. 5(a), which deteriorated the bonding strength. As shown in Fig. 8(a), the residual filler metal exhibits the highest hardness within the joint, implying a strong brittleness tendency. Besides, the hard residual filler metal in a continuously distributed fashion (Fig. 5(a)) is difficult to keep coordinated deformation with other areas. Considering the difference in thermal expansion coefficient among the Ti3Al reaction layer, residual filler metal and Ti-rich phase, it is deduced that the continuous crack formed due to stress concentration during cooling cycle. When the brazing temperature rose to 910 ° C, the crack propagation path changed into the center of the brazed seam and the strength at room temperature increased by about 38.6% compared with the joint brazed at 880 ° C. The decrease of the residual filler metal is beneficial to the joint strength. The joint brazed at 950 ° C fractured across the small white blocks and cracks also formed within the residual filler metal. In addition, when the brazing temperature rose to 980 ° C, the thickness of the Ti3Al reaction layer increased accordingly. In this case, due to the fact that the Ti3Al reaction layer was detrimental to the joint strength, the fracture location changed back into this layer as illustrated in Fig. 10(f).
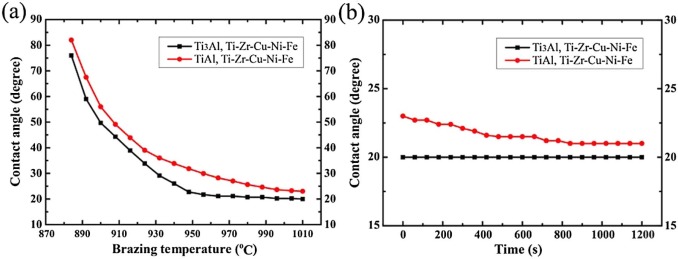 | Fig. 4. Wetting kinetics of the Ti— Zr— Ni— Fe filler on Ti3Al and TiAl base metals: (a) change of contact angle with temperature; (b) change of contact angle with holding time at 1010 ° C. |
Comparing the joint in Fig. 5(c) with that in Fig. 1(a), it can be found that the maximum hardness in Fig. 5(c) is much lower than that in Fig. 1(a), and the phases of Ti2Ni and Ti2Cu with a higher hardness are replaced by Ni10Zr7 and Cu10Zr7. Moreover, in Fig. 1(a), the hard Ti3Al phase and white phase are continuous and easy to result in stress concentration. In contrast, the microstructure distribution in Fig. 5(c) is more homogeneous. Residual filler metal is scattered and surrounded by Ti-rich phase. These offer evidence for the increased ductility of the joint brazed with the Ti— Zr— Ni— Fe alloy. That is, the Ti— Zr— Ni— Fe filler remarkably raises not only the Ti3Al/TiAl joint strength but also the joint ductility.
 880 ° C/5 min; (b) 910 ° C/5 min; (c) 950 ° C/5 min; (d) 980 ° C/5 min.</p>")  | Fig. 5. Backscattered electron images of Ti3Al/TiAl joints brazed with TiZr Cu Cu Ni Ni Fe filler metal: (a) 880 ° C/5 min; (b) 910 ° C/5 min; (c) 950 ° C/5 min; (d) 980 ° C/5 min. Fe filler metal: (a) 880 ° C/5 min; (b) 910 ° C/5 min; (c) 950 ° C/5 min; (d) 980 ° C/5 min. |
 | Fig. 6. Element area distribution maps of Ti (a), Al (b), Zr (c), Cu (d), Ni (e) and Fe (f) in Fig. 5(c). |
 | Fig. 7. XRD patterns of the fracture surfaces after shear test at room temperature for specimen brazed using Ti— Zr— Ni— Fe filler metal at 950 ° C for 5 min: (a) Ti3Al side; (b) TiAl side. |
 | Fig. 8. Vickers micro-hardness profile across the Ti3Al/TiAl joints: (a) shown in Fig. 1(a); (b) shown in Fig. 5(c). |
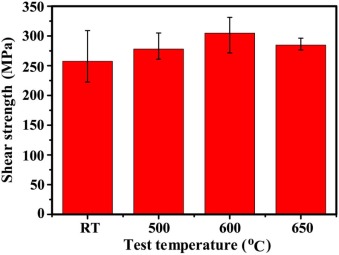 | Fig. 9. Shear strength of the joint brazed with Ti— Zr— Ni— Fe filler metal at 950 ° C for 5 min. |
 | Fig. 10. Cross sections of Ti3Al/TiAl joints after shear tests at room temperature, Ti3Al side: (a) Ti— Ni, 960 ° C/10 min; (b) Ti— Ni, 980 ° C/10 min; (c) Ti— Zr— Ni— Fe, 880 ° C/5 min; (d) Ti— Zr— Ni— Fe, 910 ° C/5 min; (e) Ti— Zr— Ni— Fe, 950 ° C/5 min; (f) Ti— Zr— Ni— Fe, 980 ° C/5 min. |
Although the shear strength of 257.6 ± 33.6 MPa at room temperature and 304.8 ± 29.9 MPa at 600 ° C have been acquired using the newly developed Ti— Zr— Ni— Fe filler alloy, further studies searching for new filler metals are still needed for achieving a stronger joining of Ti3Al-based alloy to other materials[34, 35, 36, 37 , 38]. Besides, diffusion bonding technology applying a pressure during the joining process should be another approach to improve the joining property.
| Table 4 Average shear strength of vacuum brazed Ti3Al/TiAl joints at room temperature |
4. Conclusions
Microstructure and shear strength of the vacuum brazed Ti3Al/TiAl joint using Ti— 15Cu— 15Ni (wt.%) and newly designed Ti— Zr— Ni— Fe filler metals were evaluated in this study. Primary conclusions are summarized as follows:
(1)The joints brazed with Ti— 15Cu— 15Ni (wt.%) alloy showed a shear strength of 53.8-112.4 MPa at room temperature. A continuous Ti3Al band, Ti2Ni and Ti2Cu/Cu3Ti phases formed in the joint and deteriorated the joint strength. Intermetallic compounds Ti2Ni and Ti2Cu presented the highest hardness within the joint.
(2)The liquidus temperature of the new Ti— Zr— Ni— Fe filler metal was 857.7 ° C. The wettability of this filler alloys on Ti3Al and TiAl substrate was good, that is, after the holding time of 20 min at 1010 ° C, it showed a low contact angle of 20° and 21° on Ti3Al and TiAl substrate, respectively.
(3)The joint brazed with Ti— Zr— Ni— Fe filler mainly consisted of Ti-rich area, Ti3Al reaction layer and residual filler metal. Phases Ni10Zr7 and Cu10Zr7 were confirmed and they presented a lower micro-hardness than Ti2Ni or Ti2Cu. The amount of residual filler metal decreased and the Ti3Al reaction layer thickened with the increase of brazing temperature. The excessive growth of the Ti3Al reaction layer was detrimental to the bonding strength. The joint brazed at 950 ° C for 5 min with Ti— Zr— Ni— Fe filler presented a shear strength of 257.6 MPa at room temperature and 278-304.8 MPa at high temperature.
This work was sponsored by the National Natural Science Foundation of China under Grant No. 51405456. The authors also express their appreciations to the Aeronautical Science Foundation of China under Grant Nos. 03H21009 and 99H21013.
The authors have declared that no competing interests exist.
Reference
| [1] |
|
| [2] |
|
| [3] |
|
| [4] |
|
| [5] |
|
| [6] |
|
| [7] |
|
| [8] |
|
| [9] |
|
| [10] |
|
| [11] |
|
| [12] |
|
| [13] |
|
| [14] |
|
| [15] |
|
| [16] |
|
| [17] |
|
| [18] |
|
| [19] |
|
| [20] |
|
| [22] |
|
| [23] |
|
| [24] |
|
| [25] |
|
| [26] |
|
| [27] |
|
| [28] |
|
| [29] |
|
| [30] |
|
| [31] |
|
| [32] |
|
| [33] |
|
| [34] |
|
| [35] |
|
| [36] |
|
| [37] |
|
| [38] |
|