
Influence of Conductivity on Corrosion Behavior of 304 Stainless Steel in High Temperature Aqueous Environment
Cite this Article
Jiazhen Wang, Jianqiu Wang, En-Hou Han. Influence of Conductivity on Corrosion Behavior of 304 Stainless Steel in High Temperature Aqueous Environment. Journal of Materials Science & Technology, 2016, 32(4): 333-340 
Permissions
Copyright reserved, Editorial board of Journal of Materials Science & Technology
Influence of Conductivity on Corrosion Behavior of 304 Stainless Steel in High Temperature Aqueous Environment
Abstract
The influence of conductivity on corrosion behavior of 304 stainless steel (SS) in high temperature water was investigated by using in-situ potentiodynamic polarization curves, electrochemical impedance spectra (EIS) at 300 °C, and ex-situ scanning electron microscopy (SEM), X-ray diffraction (XRD), and X-ray photoelectron spectroscopy (XPS). The structures of oxide films formed on 304 SS change with different conductivities at 300 °C. With the increase in conductivity, the passive current density increases while the resistances of oxide films decrease. But the resistances do not decrease lineally with the increase in conductivity. A modified double-layer model for oxide structure was proposed to explain the influence mechanism of conductivity on the oxide films on 304 SS in high temperature water. Improving the10B enrichment level can reduce the conductivity of primary water and increase the corrosion resistance of 304 SS.
Keyword:
Stainless steel; Polarization; Electrochemical impedance spectra; High temperature corrosion
1. Introduction
In all pressurized water reactors (PWRs), boric acid is used as a chemical shim to control excess reactivity in the fuel assemblies during a fuel cycle[1 , 2]. Although natural boric acid is normally used, only the 10B isotope has a high capacity for thermal neutron capture by the following reaction[3 , 4]:

The injection of B in the typical ingredients of primary PWR coolant is 900-1800 ppm (by weight) as burnable neutron absorbers to control nuclear reactions. Besides, 2-5 ppm lithium hydroxide (LiOH) is also injected to achieve a desired pH range between 6.9 and 7.4, which minimizes the corrosion of structural materials, as well as the solubility and transport of activated corrosion products[1 , 5].
In support of advanced fuel management trends, a higher 10B content is required at the beginning of the fuel cycle. About 80% of total B in nature exists in the form of 11B isotope, which is essentially useless as a neutron absorber[1], [3 , 6]. Moreover, 11B isotope increases the total concentration of required boron acid (H3BO3) to obtain a target 10B isotope content[7 , 8]. However, increasing boron concentration brings many difficulties associated with the need to increase the concentration of LiOH in primary PWR to maintain the relative stability of pH values. The increased levels of H3BO3 and LiOH concentration, along with the rise of subsequent conductivity, aggravate the boron deposition on fuel and accelerate the corrosion rates of fuel cladding and Alloy 600[1, 2, 4 , 6].
Because the corrosion of alloys in high temperature water is an electrochemical process in nature, a large number of studies have investigated the influences of temperature[9, 10, 11 , 12], pH value[11, 13 , 14], dissolved oxygen (DO)[15] and dissolved hydrogen (DH)[16] on electrochemical characters of the alloys by in-situ electrochemical measurement techniques in high temperature water. However, few studies focus on how conductivity influences the corrosion behavior of stainless steels (SS) and nickel-based alloys in high temperature water. Liu et al.[14] investigated the influence of pH on the corrosion behavior of 316L SS at 300 ° C, and found that the corrosion rate of 316L SS reduced with the increase of pH value. However, the pH and conductivity of the experimental solutions changed at the same time, and the influence of conductivity on corrosion behavior of 316L SS was not discussed.
Thus, the main purpose of the present work is to study the effect of conductivity on corrosion behavior of 304 SS in high temperature aqueous environments by means of in-situ potentiodynamic polarization, electrochemical impedance spectra (EIS), ex-situ scanning electron microscopy (SEM), X-ray diffraction (XRD), and X-ray photoelectron spectroscopy (XPS) analysis. One duplex-layer model is proposed to understand the evolution process of oxides on 304 SS in high temperature aqueous solutions with different conductivities.
2. Experimental Procedures
2.1. Samples and solutions
The composition (wt%) of 304 SS used for this work is 18.65 Cr, 9.27 Ni, 1.88 Mn, 0.035 C, 0.66 Si and Fe balance. The material was solution annealed at 1100 ± 3 ° C for 1 h and then water quenched. The samples with a size of 10 mm × 10 mm × 1 mm were used for electrochemical experiments and were carefully ground with SiC papers up to 2000 grit. After that, all the samples were polished with 3.5 µ m diamond paste. The samples were subsequently welded to 316 SS wires shielded with heat-shrinkable polytetrafluoroethylene tubes. There are three parallel electrochemical samples in each electrochemical experiment and another two parallel samples for SEM, XRD and XPS analysis. The autoclave was connected with a re-circulation loop, and the water chemistry parameters were monitored online, including DO, DH, pH value and electrical conductivity. The DO and DH values were automatically controlled and adjusted using software LabView 8.5. The control error was lower than 1%. The autoclave and re-circulation loop were pre-oxidized in the relevant testing solution before the formal experiment. The testing electrolytes were four kinds of lithiated and borated solutions in the high-purity deionized water (conductivity: 18.25 MΩ cm). The concentrations of B and Li, the pH values, and conductivities of the solutions at 300 ° C are listed in Table 1. All the data in the table have been calculated using commercial software pHSC4 from Duke Power Company. The testing solution was first deaerated by continuously bubbling with N2 gas (99.99%) until the DO was less than 0.01 ppm, and then inflated with H2 gas (99.999%) until the DH reached 2.3 ppm. The samples were immersed in 300 ± 1 ° C and 10 MPa high temperature water in a 2 L Ni-lined stainless steel autoclave for 72 h.
| Table 1 Contents of different solutions and the corresponding pH values and conductivities at 300 ° C |
2.2. Electrochemical measurements
A Gamry Reference 600 Potentiostat and corresponding software were used for all electrochemical measurements. The three-electrode system including working, counter and external Ag/AgCl reference electrodes were used. The counter electrode was a platinum foil with a size of 20 mm × 20 mm, and the concentration of KCl in the Ag/AgCl reference electrode was 0.1 mol/L. Prior to the heating process of autoclave, the samples were reduced potentiostatically at -1.0 V (vs SHE— standard hydrogen electrode) for 10 min to remove the surface oxides on SS and then kept in the solution at 300 ± 1 ° C for 72 h. According to the American Society for Testing and Materials F2129 Standard and Ref.[17 , 18], 72 h of pre-oxidation could allow the extent of oxide films achieved, and the open circuit potential (OCP) could reach the quasi-steady condition at the same time.
The OCPs of 304 SS in testing solutions at 300 ° C were measured at intervals. The EIS measurements were performed at OCP. The alternating current signal amplitude was ± 10 mV rms and the frequency ranged from 100 kHz to 10 mHz. The potentiodynamic polarization experiments were performed at a scanning rate of 0.5 mV/s starting from -0.1 V vs OCP. A Gamry Echem Analyst Software was used for calculating the fitting results of EIS.
All the potentials have been converted into SHE by the following equation[19]:
where ESHE is the electrode potential vs SHE, Eobs is the measured electrode potential, Tr is room temperature (25 ° C), and T is the measured experimental temperature (300 ° C).
2.3. Analysis of surface film
To observe the microstructure of corrosion product on the surface of 304 SS, an FEI XL30 field emission environmental scanning electron microscope (ESEM) was used. The phases of oxide films on 304 SS after immersion were identified using a PANalytical X'Pert Powder X-ray diffraction (XRD), with AlKα radiation. The generator voltage and tube current were 40 kV and 40 mA, respectively. The scanning range of the detector was from 10° to 90° , the step size was 0.05° , and the time per step was 0.8 s. XPS analysis was performed using a VG ESCALAB 250 X-ray photoelectron spectrometer. Composition-depth profiles were obtained with 2.0 keV Ar ions at a target current of 2.0 µ A/cm2. The sputtering rate was estimated to be about 0.1 nm/s (vs Ta2O5). To characterize the thickness of oxide film qualitatively, the equivalent oxide thickness is defined from the XPS depth profiles where the atomic percent of O reaches 10%.
3. Results
3.1. Change of OCP and potentiodynamic polarization curves
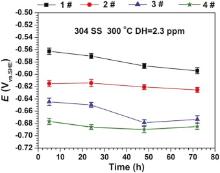
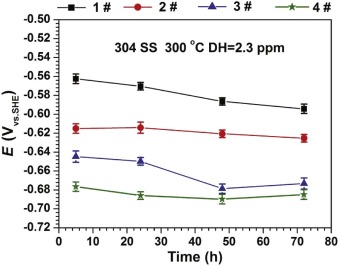
Fig. 1 shows the evolution of OCPs for 304 SS in different solutions at 300 ° C. The OCPs of 304 SS reduce with the increase of B and Li injection. The OCP values of 304 SS in 1#, 2#, 3# and 4# solutions are -0.594, -0.625, -0.673 and -0.685 V, respectively.
 | Fig. 1. Evolution of OCP for 304 SS in different solutions at 300 ° C. |
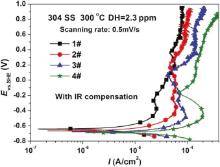
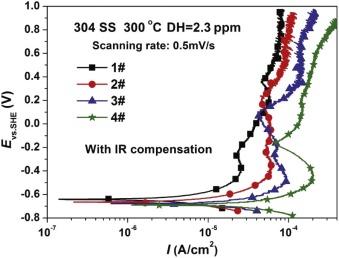
Fig. 2 shows the potentiodynamic polarization curves for 304 SS after 72 h in different concentrations of B and Li solutions at 300 ° C. All the passive potentials of 304 SS are nearly located around -0.4 V, which can be due to the transformation of Fe-Cr oxides into Ni-Fe oxides based on the E-pH diagram] [20, 21, 22 , 23]. The anodic current density, the cathodic current density and the passive current density all increase with the rise of conductivity. The passive current density of 304 SS in 1#, 2#, 3# and 4# solutions are 26, 62, 96 and 200 µ A/cm2, respectively.
 | Fig. 2. Potentiodynamic polarization curves for 304 SS in different solutions at 300 ° C. |
3.2. Electrochemical impedance spectroscopy
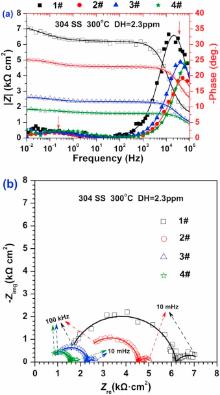
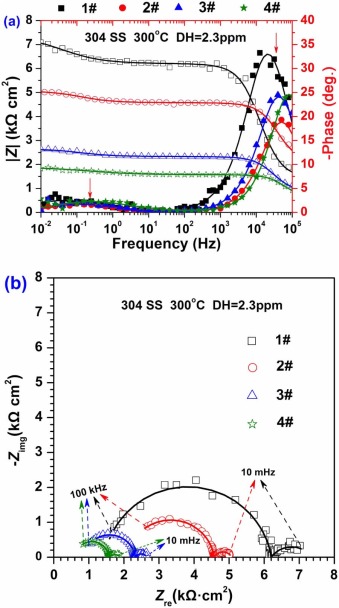
Fig. 3 shows the EIS results for the oxide films on 304 SS after 72 h exposure in different concentrations of B and Li solutions at 300 ° C. The impedance magnitude |Z| reduces with the increase of conductivity, and two time constants could be observed according to the bode diagram in Fig. 3(a). The approximate frequency ranges, where two time constants arise, are shown in Fig. 3(a) with red arrows. The Nyquist diagram in Fig. 3(b) shows a large semi-circle at high frequency region and a small semi-circle at low frequency region. With the increase of conductivity, the radiuses of both the large semi-circle and the small semi-circle decrease.
 | Fig. 3. EIS data for 304 SS in different solutions at 300 ° C: (a) bode diagram and (b) Nyquist diagram. |
3.3. Surface film observation and analysis
3.3.1. SEM results
Fig. 4 shows morphologies of oxide films on 304 SS in different concentrations of B and Li injection at 300 ° C. With the rise of conductivity, the sizes of spinel oxide particles on the outer layer gradually become larger and the number of the particles gradually increases, as shown in Fig. 4(a, b). Besides, oxide particles with a size of smaller than 200 nm start to appear on the outer layer. But most interestingly, with the continuing increase of conductivity, while the maximum size of the outer-layer oxide particles increases and the number of these particles decreases, the number of oxide particles with relatively smaller size grows obviously (Fig. 4(c)). This suggests that the increase of B and Li injection can apparently alter the morphologies of the oxide films on 304 SS.
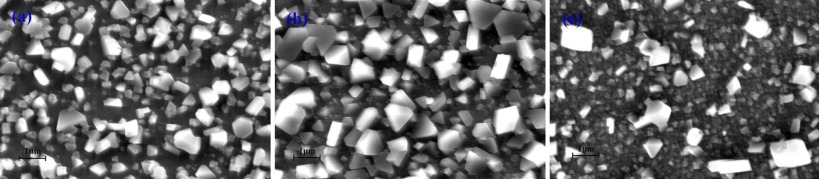 | Fig. 4. SEM photographs of oxide films on 304 SS in different solutions at 300 ° C: (a) 1#, (b) 2#, and (c) 3#. |
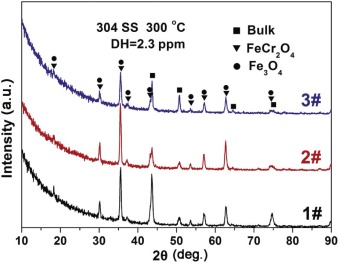
3.3.2. XRD results
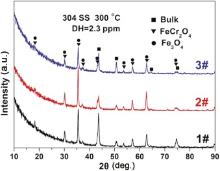
Fig. 5 shows XRD patterns of the oxide films on 304 SS in different concentrations of B and Li solutions at 300 ° C. The diffraction peaks mainly correspond to Fe3O4 (JCPDS 19-0629) and FeCr2O4 (JCPDS 34-0140), with the exception of substrate. All the positions of diffraction peaks match well with those from Fe3O4 and FeCr2O4 according to the published data[21, 24 , 25]. For SSs, Fe3O4 and FeCr2O4 were considered as the main corrosion products immersed in high temperature water[26, 27 , 28].
3.3.3. XPS results
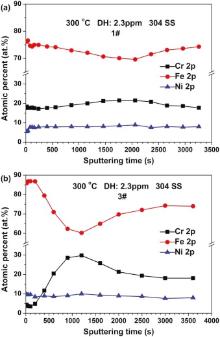
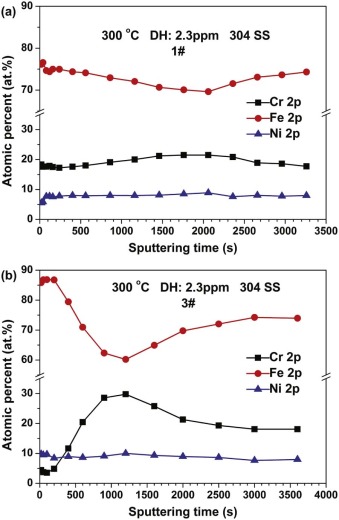
Fig. 6 shows the normalized composition depth profiles of Cr, Ni, and Fe in the oxide films on 304 SS with different injection of B and Li at 300 ° C. Considering the fact that the sputtering depth is not linear with the sputtering time for the XPS analysis[21 , 29], the original sputtering time is used to show the concentration distributions of elements in the oxide films on 304 SS. For the oxide films in 1# solution, Fe, Ni and Cr are homogeneously distributed within the whole sputtering range of the oxide films depth. And the inner layer of the oxide films is slightly Cr-rich. For the oxide films in 3# solution, the outer layer of the oxide films is obviously Fe-rich while the inner layer is Cr-rich. By comparing Fig. 6(a) with 6(b), it can be seen that the increase of conductivity can enlarge the Fe-rich extent in the outer layer and Cr-rich extent in the inner layer of the oxide films. Besides, the thickness of oxide films increases with the rise of conductivity by comparing Fig. 6(a) with 6(b).
4. Discussion
4.1. Effect of conductivity on the electrochemical behavior of 304 SS
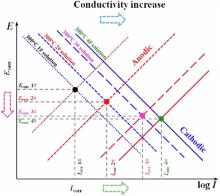
To qualitatively analyze how the B and Li injection affects the electrochemical characteristics in this study, the Evans diagram is used as shown in Fig. 7. According to Fig. 2, the cathodic current density, the anodic current density, and the passivity current density for 304 SS increase as the B and Li injection goes up. It indicates that the increase of conductivity can promote both the cathodic reaction and the anodic reaction at the same time. The reason could be that the increase of conductivity weakens the compactness of the oxide films and speeds up the diffusion process of metal atoms, which will be further discussed in Section 4.2. The increase in the current paths of the cathodic and anodic reactions can lead to the consumption of the electrical charges generated by anodic dissolution on the metal surface through oxidation-reduction reaction away from the metal surface, which increases the area of the cathodic reaction, and thus accelerate the corrosion rate[30 , 31]. Besides, the corrosion potentials of 304 SS decrease, indicating that the increase of conductivity has a more obvious effect on the anodic corrosion promotion of 304 SS as shown in Fig. 7. Thus, the increase of conductivity can remarkably reduce the corrosion resistance of 304 SS at 300 ° C.
According to Ref.[32], the relationship between Xi and Ip has been developed to explain the surface reactions between ith ions Xi (e.g. Li+, Zn2+) and the passive film. And the passive current density Ip could be expressed as Eq. (3)[33].
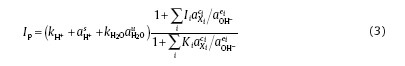
where Ii is a composite parameter, which contains the quasi equilibrium constant Ki and the forward dissolution rate constant kj; the subscript i denotes the ith active ion; s, u, ci and ei are the reaction orders as to the activity of j, respectively; aj represents the activity of some species j (e.g. H+, Xi and OH-). The other parameters can be deduced based on the dependence of Ip on the concentrations of ions (e.g. B+, Li+) in Eq. (3). According to Table 1, the four testing solutions in our experiment have the same pH value at 300 ° C, so aH+ in the solutions has the same value. Because of the absence of active ions (e.g. Cl-) in solutions, the change of parameters in the bracket of Eq. (3) can be ignored [21, 23 , 34]. Due to the less protective oxide films on 304 SS by increasing B and Li concentration, the value of Ki becomes smaller while Ii becomes larger [20, 21, 23 , 35]. Thus, the increase in B and Li concentrations increases Ip and accelerates the dissolution of oxides.
| Table 2 Fitting results for 304 SS in different solutions at 300 ° C |
For the materials in high temperature water, the slower oxygen (O) diffusion process across the oxide films leads to the lower corrosion resistance[36 , 37]. The impedance modulus |Z| at low frequency is supposed to reflect how difficult O diffuses through the oxide layer into the substrate [23]. Based on Fig. 3(a), with the increase of conductivity, the impedance modulus |Z| at low frequency tends to decrease due to the less protective oxide films. Besides, it can be inferred that the increase of conductivity promotes the O diffusion process across the barrier layer into the substrate, and thus increases the speed of the cathodic reaction speed. This is consistent with the potentiodynamic polarization shown in Fig. 2. There are two capacitive arcs obtained from the oxide films on 304 SS in Fig. 3(b). The larger arc is associated with the relatively difficult electronic transmission of barrier layer while the smaller one is assigned to the relatively easy transportation of substances at the barrier layer/solution boundary.
Interestingly, both the bode diagram and Nyquist diagram in Fig. 3 are different from those in the previous work[14, 22 , 23]. The impedance magnitudes shown in Fig. 3(a) are obviously smaller than those in the previous work for nickel-based alloys and stainless steels[12, 14, 15, 22 , 23]. The reason is that the dissolved hydrogen in high temperature water promotes the cathodic process and reduces the corrosion resistance of materials[16].
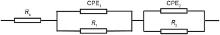
An equivalent circuit R-(QR)-(QR) is adopted as shown in Fig. 8<sup>[9, 23 , 35], where Rs is the solution resistance, R1 is the charge transfer resistance of the Faraday process, CPE1 is the constant phase element for the duplex layer, R2 is the oxide resistance, and CPE2 is the constant phase element for oxide. For the applied equivalent circuit in Fig. 8, the transfer function is given as follows:

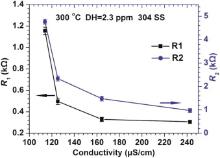
where j is the imaginary unit, ω is the angular frequency, Q denotes the CPE coefficient, n is the CPE exponent indicating the deviation of pure capacitor, and n1, n2 represent the fitting parameters at the high frequency and low frequency, respectively. The fitted values of parameters of the above equivalent circuit are listed in Table 2. Although the change of Rs is irregular with the increase of conductivity, R1 and R2 reduce with the increase of conductivity. It is interesting that R1 and R2 do not decrease linearly with the increase in conductivity as shown in Fig. 9. When the conductivity changed from 113.9 to 164.3 µ S/cm, a quick reduction of R1 and R2 occurred. However, the decreasing rates of R1 and R2 become lower at larger conductivity value (> 164.3 µ S/cm). When R1 is ignored, the value of R2 can denote the protectiveness of the oxide films in high temperature water. Based on Fig. 9, it can be inferred that a porous oxide film is formed on surface of 304 SS in the present water chemistry environment with high conductivity.
 | Fig. 5. XRD patterns of oxide films on 304 SS in different solutions at 300 ° C. |
 | Fig. 6. XPS depth profiles of the oxide films on 304 SS in different solutions at 300 ° C: (a) 1# and (b) 3#. |
4.2. Effect of conductivity on the composition of oxide film on 304 SS
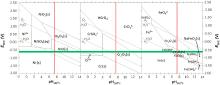
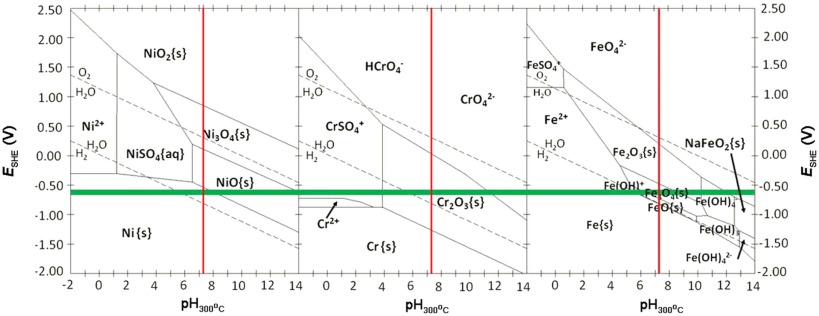
Fig. 10 shows the potential-pH diagrams for Ni, Cr, and Fe at 300 ° C, which were summarized by Staehle and Gorman[38]. According to Table 1 and Fig. 1, the calculated pH for the test solutions at 300 ° C during the electrochemical measurements is 7.29, and the measured OCP range in different solutions is between -0.596 V and -0.684 V. In Fig. 10, pH of 7.29 is shown using red vertical lines, while the measured potentials at four different solutions are located within the range of the horizontal bars. Therefore, based on the measured corrosion potentials in the primary water, the stable states of Cr, Fe, and Ni are Cr2O3, Fe3O4, and Ni, respectively. Fe3O4 can be understood as the mixture of Fe2+ and Fe3+ according to the following reaction[15]:

In high-temperature pressurized water, interactions among oxides (e.g. Cr2O3, FeO, Fe2O3, NiO) are inevitable[15], which are mainly:
The concentration of Ni (< 10 wt%) in 304 SS is limited and the stable form of Ni under the experimental conditions is elemental Ni, so NiCr2O4, NiFe2O4 and NiCrFeO4 in Reactions (7), (8) and (9) could not be formed. This is consistent with the XRD result shown in Fig. 5. Therefore, the change of conductivity does not alter the phases of oxide films on the surface of 304 SS.
'>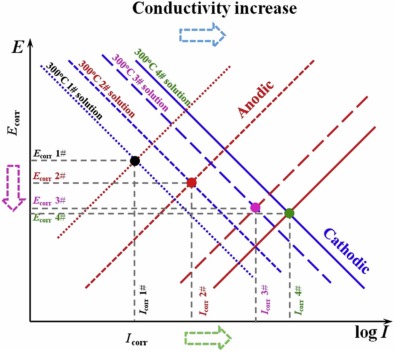 | Fig. 7. Evans' diagram used to interpret the influence of conductivity on change of OCP. |
 | Fig. 8. Equivalent circuit used in the present study. |
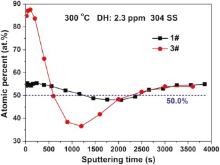
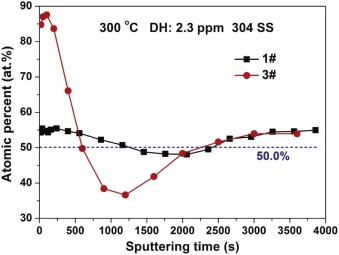
Fig. 11 shows the atomic percent of Fe oxide to total metal oxides (η Fe/(Cr + η Fe), η = 0.29) after 72 h immersion in 1# and 3# solutions at 300 ° C. The ratio of 0.29Fe/(Cr + 0.29Fe) remains about 50% (blue line) for the oxide films of 304 SS in 1# solution. This indicates that the proportions of FeCr2O4 and Fe3O4 oxides on 304 SS are about 33 to 67 in 1# solution. However, for the oxide films on 304 SS immersed in 3# solution, the 0.29Fe/(Cr + 0.29Fe) value of the outer film is much bigger than 50%, indicating that the main phase of the outer oxide films formed in 3# solution is Fe3O4. At the meantime, the 0.29Fe/(Cr + 0.29Fe) value of the inner oxide films formed in 3# solution is about 40%, which proves that the phases of the inner oxide films are FeCr2O4 and Fe3O4 (the proportions are 50 to 50). Based on Fig. 6 and Fig. 11, it can be inferred that the diffusion process of Fe toward outer oxide layer is promoted by the increasing conductivity. Besides, for the oxides of Fe, Cr, and Ni, the diffusion rates of metals in their relevant oxides are shown as follows[37]:

According to Robertson[37], the metal ions are the faster moving species and determine the oxidation rates. So the promoted diffusion rate of Fe ions due to the increase of conductivity accelerates the corrosion rate of 304 SS. This is consistent with the potentiodynamic results and EIS results. The metal ions in oxides diffuse toward oxide/solution interface, and the vacancies will be formed in the inner layer. The rapid diffusion of Fe ions in the oxide films will form a large number of vacancies in the inner layer, and then these vacancies will gather together and form pores if the vacancies cannot be supplemented by the diffusion of metal ions from the substrate. These pores reduce the compactness and protectiveness of the inner oxide layer. This also explains why resistance R2 of oxide layer in high conductivity solution is smaller than that in low conductivity solution, although an obvious Cr-rich layer is formed in the inner layer of oxide films in high conductivity solution ( Fig. 6 and Fig. 11).
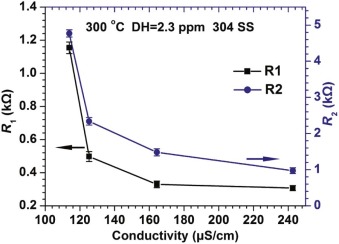 | Fig. 9. Change in R1 and R2 as a function of conductivity for the oxide films on 304 SS at 300 ° C. |
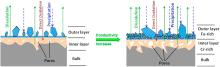
After the protective oxide films are formed on SSs, the oxidation process is virtually a slow oxidation process along with the simultaneous pseudo steady-state actions of the direct oxidation, precipitation and dissolution of oxides. Compared with the outer layer of the films in high temperature water, the inner layer is relatively compact, which is probably formed by solid-state reaction processes[39] and [40]. The oxides dissolute and grow at the same time on the surface of each oxide particle in high temperature water. The dissolved ions are precipitated as the outer particles due to their oxidation[21]. Based on Fig. 4, a schematic drawing of the double-layer oxide films on 304 SS in different conductivity solutions at 300 ° C is shown in Fig. 12. When the conductivity is relatively low, the high resistance of oxide inhibits the diffusion process of metal ions toward oxide/solution interface. Thus only oxide particles with a small size are formed through the precipitation of dissolved ions at the outer layer (Fig. 4(a)). As the conductivity increases, the protectiveness of inner oxides becomes poor and the diffusion process is promoted, and the size of precipitated oxide particles at the outer layer of oxide films becomes bigger (Fig. 4(b)). According to Fig. 11, which shows that Fe3O4 is the main phase of the outer oxide films formed in 3# solution, Fe3O4 is possibly formed by the following equilibrium equation[14]:

As the conductivity continues to increase, the increased diffusion channels due to pores in the oxide layer further promote the diffusion of metal ions (e.g. Fe2+)[41]. Therefore, it can be inferred that the tendency of Fe3O4 formation increases, leading to more nucleation sites on the surface of oxides. And more nucleation sites can make the size of oxide particles become smaller, which is also consistent with the SEM image in Fig. 4(c).
 | Fig. 11. Atomic percent of Fe oxide to total metal oxides (η Fe/(η Fe + Cr), η = 0.29) in the oxide films on 304 SS in different solutions at 300 ° C. |
The increase of conductivity has a bad effect on corrosion resistance of 304 SS and other structural materials. In order to obtain a target 10B isotope content, a proper method is to improve the 10B enrichment level and decrease the total concentrations of H3BO3 and LiOH in primary water at the same time. This method will contribute to reducing the conductivity of the primary water and increasing the corrosion resistance of 304 SS and other structural materials based on the above results.
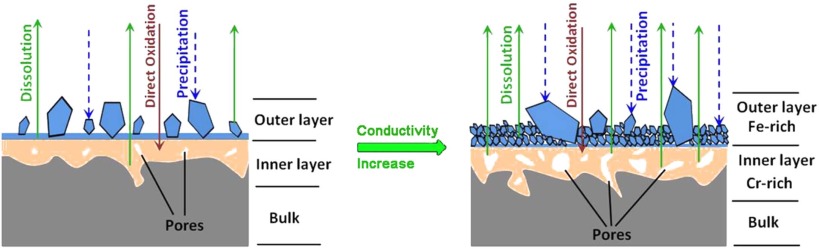 | Fig. 12. Schematic drawing of the double-layer oxide model on 304 SS in different solutions at 300 ° C. |
5. Conclusions
(1)The structures of oxide films formed on 304 SS change with different conductivities at 300 ° C. The oxide films are composed of a mixture Fe3O4 and FeCr2O4 spinel oxides. As the conductivity increases, the passive current density increases and the resistances of oxide films decrease.
(2)The resistances of oxide films do not decrease lineally with the increase of conductivity in high temperature water; when the conductivity is lower than 164.3 µ S/cm, a slight increase in conductivity causes an obvious change of the resistances of oxide films, while further increase in conductivity shows little effect on reducing the resistances of films.
(3)A modified model with double-layer oxide structure is proposed to interpret the influence mechanism of conductivity in high temperature water. The increase of conductivity directly influences the diffusion process and the oxide structure. And the protectiveness of oxide films decreases with the increase of conductivity in high temperature water.
(4)Improving the 10B enrichment level can reduce the conductivity of primary water in PWR and enhance the corrosion resistance of 304 SS.
This work was jointly supported by the National Key Science and Technology Project of China (No. 2011ZX06004-017) and the National Natural Science Foundation of China (No. 51025104).
The authors have declared that no competing interests exist.
Reference
| [1] |
|
| [2] |
|
| [3] |
|
| [4] |
|
| [5] |
|
| [6] |
|
| [7] |
|
| [8] |
|
| [9] |
|
| [10] |
|
| [11] |
|
| [12] |
|
| [13] |
|
| [14] |
|
| [15] |
|
| [16] |
|
| [17] |
|
| [18] |
|
| [19] |
|
| [20] |
|
| [21] |
|
| [22] |
|
| [23] |
|
| [24] |
|
| [25] |
|
| [26] |
|
| [27] |
|
| [28] |
|
| [29] |
|
| [30] |
|
| [31] |
|
| [32] |
|
| [33] |
|
| [34] |
|
| [35] |
|
| [36] |
|
| [37] |
|
| [38] |
|
| [39] |
|
| [40] |
|
| [41] |
|