

Detailed Evolution Mechanism of Interfacial Void Morphology in Diffusion Bonding
[Chao Zhang, Hong Li, Miaoquan Li ]
]
]
|
|


Similar diffusion bonding of 1Cr11Ni2W2MoV stainless steel was conducted at different bonding temperatures. The interface characteristics and mechanical properties of joints were examined, and the evolution of interfacial void morphology was analyzed in detail. The results showed that there were four typical interfacial void shapes generating sequentially: the large scraggly voids, penny-shaped voids, ellipse voids and rounded voids. The variation of interfacial void shape was dominated by surface diffusion, while the reduction of void volume was ascribed to the combined effects of plastic flow of materials around voids, interface diffusion and volume diffusion. Owing to the elimination of void from the bonding interface, the sound joint obtained could exhibit nearly full interfacial contact, and present excellent mechanical properties, in which the microhardness and shear strength of joint matched those of base material.
Diffusion bonding is an attractive solid-state joining technology, in which two faying surfaces are joined at elevated temperature through application of pressure[1, 2, 3, 4, 5]. The temperature is usually chosen as 0.5-0.8 Tm (Tm is the melting point of the material) and the moderate pressure should be adopted to maintain that no noticeable macroscopic deformation of joined component occurs[6, 7, 8]. If the bonding parameters were chosen properly, a joint having microstructure and mechanical properties distinguishable from those of base material would be produced[9, 10, 11]. Not only similar but also dissimilar materials can be successfully joined by diffusion bonding[12, 13, 14].
During diffusion bonding, the removal of voids from the bonding interface has been a significant subject of considerable interest and has been studied for more than several decades. Many experimental researches on void shrinkage have been carried out to identify the relationship between the void shrinkage behavior and parameters such as temperature, pressure, time and surface condition. Afshan et al.[15] indicated that increasing time resulted in better void shrinkage about diffusion bonding of free cutting steels, thereby enhancing the tensile strength of joint. Vigraman et al.[16] proposed that the void shrinkage process can be greatly promoted with increasing temperature during diffusion bonding of SAE 2205 steel and AISI 1035 steel. In addition to experimental researches, a series of theoretical models have been established for predicting the void shrinkage process during diffusion bonding. These models are usually different in the assumption of void shape, including rhombic void[17, 18], lenticular void[19], elliptic void[20], cylindrical void[21], sine wave void[22] etc. Also all these void shrinkage models in the literature assumed that the voids are uniform in size, and the probabilistic feature of void sizes is not considered in these models. Nevertheless, the actual void sizes generated during diffusion bonding exhibit marked scatter[23]. Despite many efforts that have been made to investigate void shrinkage behavior via experiments and modeling, little work has been focused on the detailed evolution of realistic interfacial void morphology.
In the current study, similar diffusion bonding of 1Cr11Ni2W2MoV stainless steel was carried out at different bonding temperatures. The interface characteristics and mechanical properties of joints were examined, and the detailed evolution of interfacial void morphology was discussed. The present results can contribute to an improved fundamental understanding of the detailed evolution of realistic interfacial void morphology and may also be used as basics for future modeling void shrinkage for diffusion bonding.
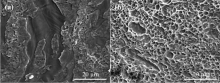
The chemical composition (wt%) of as-received 1Cr11Ni2W2MoV stainless steel is Fe-11.45Cr-1.58Ni-1.81W-0.44Mo-0.21V-0.16C, and the melting temperature of this steel is ~1500 ° C. The dimensions of the grooved specimens to be joined are shown in Fig. 1(a). Prior to diffusion bonding, the specimen surfaces were machined to a surface roughness (Ra) of ~1.6 µ m, where Ra is the arithmetic mean surface roughness measured by a C130 laser scanning confocal microscopy. The contaminated specimens were ultrasonically cleaned in ethanol for 15 min. After cleaning, two grooved specimens were assembled with their surfaces abutting each other.
 | Fig. 1. Dimensions of grooved specimens to be joined and the schematic of cutting positions of shear test specimens (a) and the dimensions of shear test specimen (b). |
A series of diffusion bonding tests were conducted in a typed ZYD-60L hot press furnace with a vacuum degree of 5.0 × 10⁻³ Pa at temperatures of 1000-1100 ° C and a fixed pressure of 15 MPa for a time of 20 min. After bonding, the pressure was released and the high pure argon was filled into the furnace to accelerate cooling to room temperature.
The cross-sections of joints were ground sequentially by 80#, 600#, 1000#, 1500# grit SiC paper, and then buff-polished with diamond pastes with a diameter of 2.5 µ m, followed by etching with a solution of 5 g FeCl3 + 50 mL HCl + 50 mL HNO3 + 100 mL H2O for 90 s. A TESCAN VEGA3LMU scanning electron microscopy (SEM) with X-ray energy dispersive spectroscopy (EDS) was used to examine the interface characteristics and the composition distribution across the bonding interface. The void size could be measured with the help of the “ Image-Pro Plus” software, and the interface bonding ratio could be calculated by the ratio of the length of interface free of void to the length of whole interface.
Mechanical properties of joints were surveyed according to microhardness and shear strength at room temperature. Eight sets of microhardness of joint and three sets of microhardness of base material were measured at a Struers Duramin-A300 tester with a load of 300 g for 15 s. The lap shear tests combined with the use of SEM to examine the fracture surfaces were adopted to evaluate the strength of joint. The cutting positions of the shear test specimens from the joined specimens are shown in Fig. 1(a), and the dimensions of shear test specimens can be seen from Fig. 1(b). The lap shear tests were conducted on an INSTRON 3382 universal machine at a crosshead speed of 1.0 mm min-1, and the fracture surfaces were examined using a TESCAN VEGA3LMU SEM in order that the extent of ductile shear fracture could be estimated.
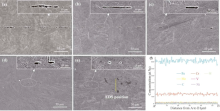
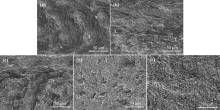
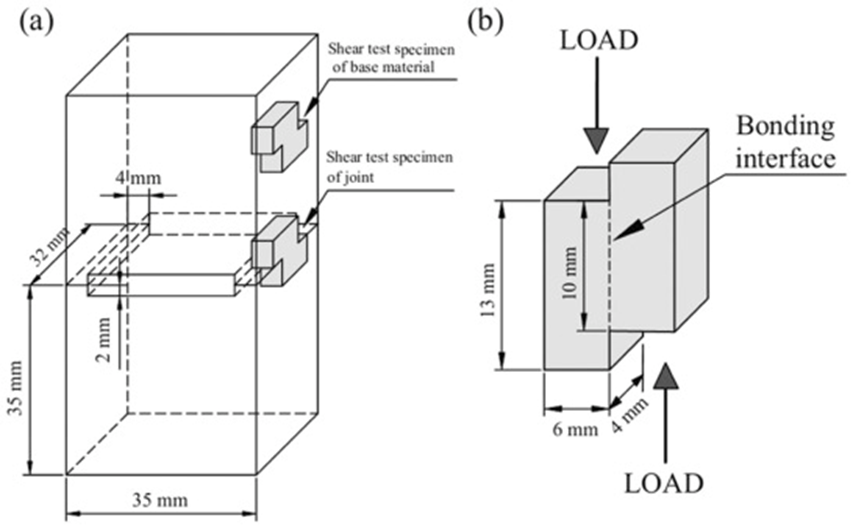
The SEM images of interface characteristics at different bonding temperatures are shown in Fig. 2, and the higher magnification images reveal the interfacial void morphology. As seen from Fig. 2(a), the long interfacial voids with scraggly edges separated by metallurgically joined areas are clearly visible at a temperature of 1000 ° C. As the temperature increases to 1020 ° C, it is obvious by comparing Fig. 2(a) and (b) that the void size decreases, and the edges of interfacial voids tend to be smooth. To further increase temperature to 1050 ° C, the long voids disappear completely and the joined areas increase significantly, as shown in Fig. 2(c). When joined at a temperature of 1080 ° C, there are occasional isolated ellipse voids in the bonding interface, as shown in Fig. 2(d). As the temperature increases up to 1100 ° C, the interfacial voids, which are round in shape and small in volume, can be seldom found from Fig. 2(e), and the EDS is used to study any compositional variations in the bonding interface compared with those of base material. The EDS profiles across the bonding interface show that the composition distributions of Fe, Cr, W, Mo, V, C and Ni are virtually constant, and no oxides and carbides exist in the bonding interface. Not only qualitative but also quantitative assessment of interfacial voids can be obtained in this study. The effect of bonding temperature on the interface bonding ratio is shown in Fig. 3. It is apparent that the interface bonding ratio increases rapidly from ~48% to 99% as the temperature increases from 1000 ° C to 1100 ° C. It is traditionally believed that it is difficult to produce a joint with 100% interface bonding ratio. Thus, the highest interface bonding ratio approaching ~100% confirms that a sound joint with few defects have been obtained.
 | Fig. 2. SEM images of the interface characteristics at different bonding temperatures: (a) 1000 ° C, (b) 1020 ° C, (c) 1050 ° C, (d) 1080 ° C, (e) 1100 ° C; (f) EDS profiles across the bonding interface. |
 | Fig. 3. Interface bonding ratio at different bonding temperatures. |
During diffusion bonding, the void shrinkage as an important process for achieving high quality joints is generally ascribed to several physical mechanisms[17, 24]: (1) plastic flow of materials around voids, including plastic deformation and creep deformation; (2) atomic diffusion, including surface diffusion, interface diffusion and volume diffusion. An increase in temperature will reduce the material yield strength, enhancing the plastic flow of materials, thereby forcing more mass from adjacent regions into voids. Simultaneously, void shrinkage is further accelerated by increased atomic diffusion. The diffusion coefficient D (m2/s) is a material property and is the most useful parameter for characterizing the capability of atomic diffusion, which is, generally, described as follows[25]:
D=D0exp(-Q/RT)(1)
where D0 (m2/s) is the diffusion constant, Q (J/mol) is the activation energy for the atomic diffusion, R (J/(mol K)) is the gas constant, and T (K) is the temperature. It is apparent from Eq. (1) that the diffusion coefficient is a strong function of temperature, and an increase in temperature enhances the capability of atomic diffusion and will, in turn, accelerate void shrinkage.
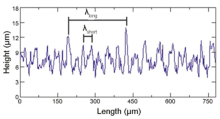
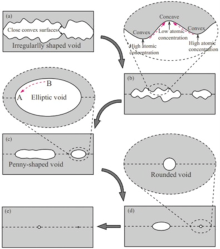
Based on the well-defined interfacial voids presented above, the evolution mechanism of interfacial voids can be analyzed in detail. The actual specimen surface is rather irregular as a result of the machining process. It can be seen from Fig. 4 that the oscillogram of the surface roughness shows a bimodal distribution of asperities, which means that short wavelength asperities are superimposed on long wavelength asperities. After assembling two surfaces abutting each other, only a few long wavelength asperities contact to form large scraggly voids, and many convex and concave surfaces are superimposed on the void surface, as schematically shown in Fig. 5(a). As the bonding pressure is applied to the joined specimen, the deformation of contacted asperities will decrease the void height, resulting in the contact of some close convex surfaces on the opposite sides within one void, and this could subsequently divide the large void into two or more voids, as schematically shown in Fig. 5(b). However, as the joined areas increase to a certain stage, the plastic flow of materials cannot make the residual distant convex surfaces on the opposite sides within one void contact with each other. In this case, the surface diffusion would operate to smooth out the irregularly shaped voids. The details are that the atoms beneath a curved surface have their chemical potentials altered by the curvature of the surface, and this difference in chemical potential will drive the diffusional flux of atoms to reduce the free energy of the system. The convex surface has a higher atomic concentration than the concave surface, resulting in a difference in the chemical potential between convex surface and concave surface. Thus, the difference in the chemical potential will drive the diffusional flux of atoms from convex to concave region. This atomic diffusion process will flatten convex and concave surfaces, and then transform the original scraggly voids to smooth voids. Mullins et al.[26] stated that the surface diffusion has a distance limit in a definite time. Therefore, the short scraggly void would be easily transformed into an elliptic void under the action of surface diffusion, while the long scraggly void would be transformed into a penny-shaped void, as schematically shown in Fig. 5(c). Surface diffusion only alters the void shape, but not the void volume[27]. The reduction of void volume is chiefly attributed to the combined effects of plastic flow of materials around voids, interface diffusion and volume diffusion. As the bonding process proceeds, the volume of penny-shaped void decreases rapidly. Then, the penny-shaped void will also be transformed into an elliptic void, as schematically shown in Fig. 5(d). When the void becomes an ellipse void, the curvature of void top (point B) is greater than that of void neck (point A). This difference in curvature will drive the diffusional flux of atoms from point B to point A, resulting in the formation of rounded void with uniform curvature, as schematically shown in Fig. 5(e). The formation of rounded voids is generally considered to be a complete finish of the evolution of interfacial void morphology, because it has the most stable morphology and the lowest system free energy relative to any other morphology.
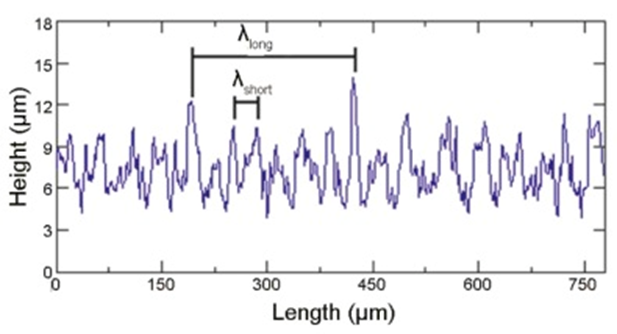 | Fig. 4. Oscillogram of the surface roughness for 1Cr11Ni2W2MoV stainless steel specimens. |
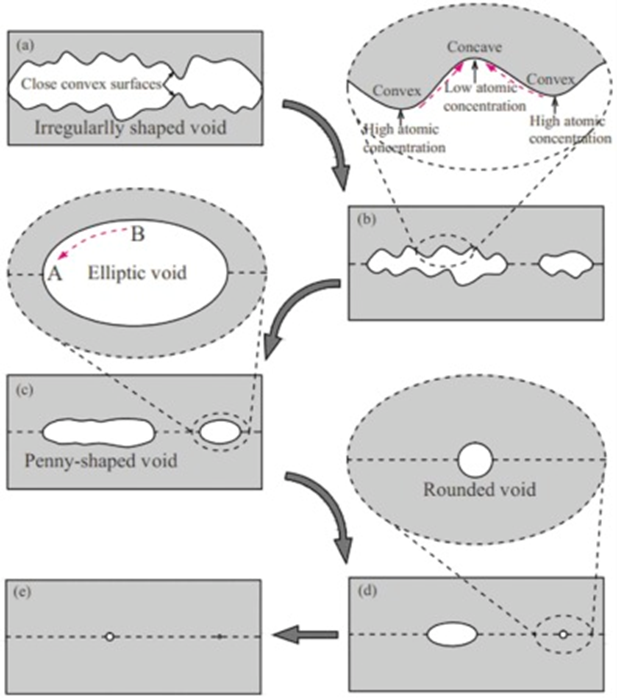 | Fig. 5. Schematic evolution process of interfacial voids. |
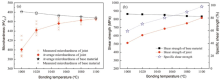
The effect of bonding temperature on the microhardness of joint and base material is shown in Fig. 6(a). It is apparent that the average microhardness of joint increases from ~400 HV0.3 to 466 HV0.3 and the scatter of the measured microhardness of joint decreases with increasing temperature from 1000 ° C to 1100 ° C. The obvious scatter of the measured microhardness of joint at low temperature should chiefly be attributed to the arbitrary variations in void distribution and void size resulted from the original irregular surfaces. When joined at 1100 ° C, a sound joint with average microhardness close to that of base material can be obtained and the scatter of the microhardness of joint cannot be found.
Furthermore, the lap shear test as the most convenient and frequently mechanical testing method was adopted to evaluate the strength of joint. In general, the absolute strength of joint could not be used to evaluate the extent of bonding because as-joined specimens having different thermal histories would have different shear strengths. The specific shear strength (μ μ ) is, thus, used to assess the shear strength of joint, and is defined as follows:
μ =τ db/τ b× 100%(2)
where τ db (MPa) is the shear strength of joint, and τ b (MPa) is the shear strength of base material at the same bonding condition.
The specific shear strength obtained at various bonding temperatures is given in Fig. 6(b), together with the shear strength of joint and base material. It can be found that the joint exhibited a general increase in the specific shear strength with increasing temperature up to the point at which the shear strength of joint can match that of base material. Islam and Ridley[28] studied the diffusion bonding of microduplex stainless steel, and pointed out that a joint with specific shear strength of µ > 95% can be regarded as a sound joint. This indicates that a high strength joint has been obtained in the present work. In addition, it can also be seen from Fig. 6 that the mechanical properties of base material is slightly decreased as the bonding temperature increases from 1000 ° C to 1100 ° C. This decrease of mechanical properties of base material is attributed to the grain growth, but is so slight that is involved in an acceptable region.
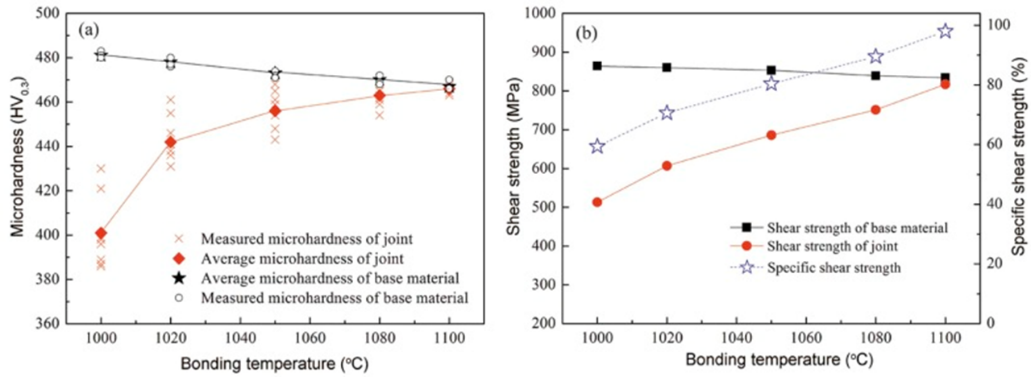 | Fig. 6. Effect of bonding temperature on microhardness (a) and shear strength (b) of both joint and base material. |
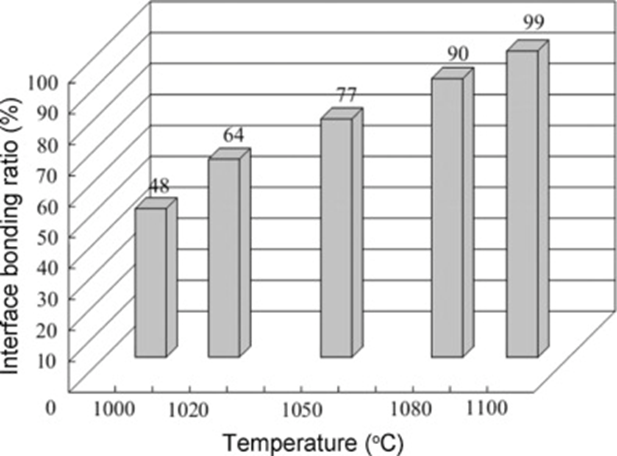
A further assessment of joint is obtained by SEM examination of the fracture surfaces of shear test specimens, as shown in Fig. 7. It is apparent that the microscopic fracture surfaces of poor joints produced at low bonding temperature is featured by a large number of dark regions with flat plane as seen at a higher magnification in Fig. 8(a), identified as un-joined regions. As the bonding temperature increases, the bright regions with ductile dimples on the microscopic fracture surfaces as seen at a higher magnification in Fig. 8(b), identified as joined regions, significantly increase. When joined at 1100 ° C, the microscopic fracture surface exhibits a fully ductile failure, as shown in Fig. 7(e). Cá ceres and Selling[29] proposed that the decrease in strength correlated with the area fraction of defects (the defects are mainly voids in this case) on the fracture surface. Thus, the dimples characteristic of ductile fracture over the entire surface implies few defects existing in the fracture surface, indicating that a high quality joint has been obtained.
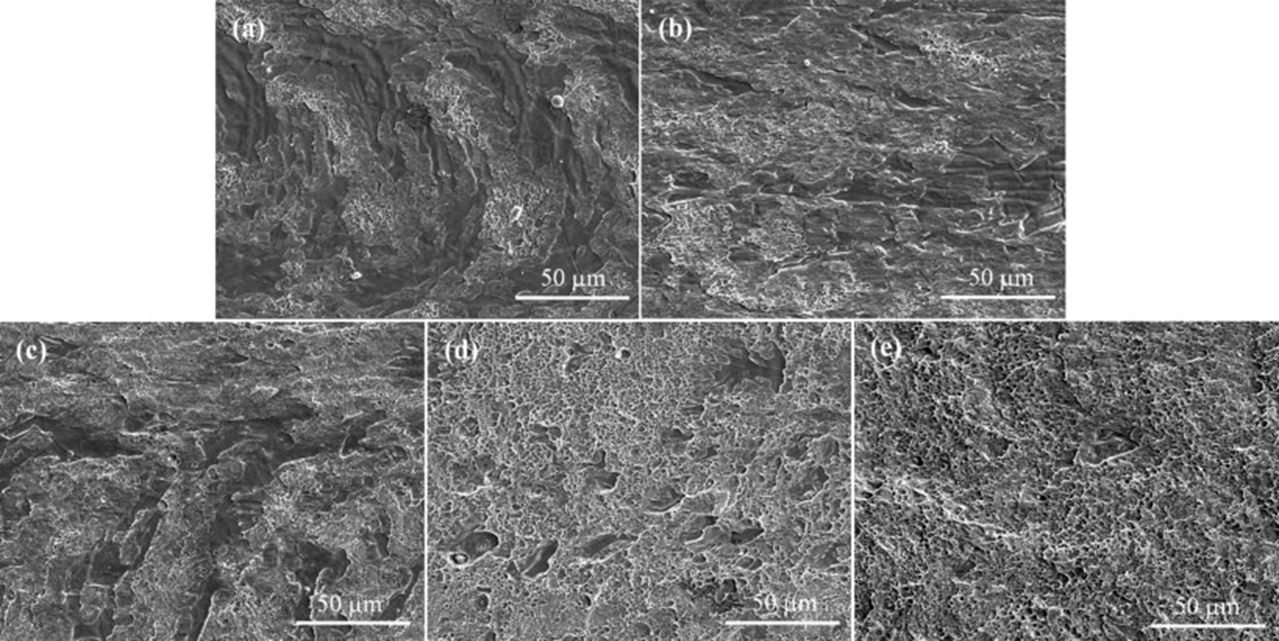 | Fig. 7. Shear fracture surfaces of joints at different bonding temperatures: (a) 1000 ° C, (b) 1020 ° C, (c) 1050 ° C, (d) 1080 ° C, (e) 1100 ° C. |
 | Fig. 8. Dark regions (a) and bright regions (b) of the shear fracture surfaces of joint at a higher magnification. |
The variation of the mechanical properties of joint is certainly attributed to the evolution of interfacial voids. The remaining voids distributed in the bonding interface have a detrimental effect on the mechanical properties of joint. Based on the detailed interfacial void morphology and mechanical properties of joints presented above, it is apparent that an increase in temperature accelerates the void shrinkage, resulting in an increase in interface bonding ratio, thereby obviously enhancing the mechanical properties of joint.
(1)As the bonding process proceeds, four typical void shapes, including the large scraggly voids, penny-shaped voids, ellipse voids and rounded voids, are observed sequentially in the bonding interface.
(2)Void shape is chiefly altered by surface diffusion, while the void volume is reduced by the combined effects of plastic flow of materials, interface diffusion and volume diffusion.
(3)Increasing temperature from 1000 ° C to 1100 ° C can enhance the plastic flow of materials around voids and the diffusion capacity of atoms, efficiently accelerating void shrinkage, thereby resulting in full interfacial contact.
(4)The obtained sound joint exhibits excellent mechanical properties, in which the microhardness and shear strength of joint match those of the base material.
This work was supported by the National Natural Science Foundation of China (No. 51505386 and No. 51275416), the China Postdoctoral Science Foundation (No. 2014M562447) and the Research Fund of the State Key Laboratory of Solidification Processing (NWPU), China (16-BZ-2015).
The authors have declared that no competing interests exist.
| [1] |
|
| [2] |
|
| [3] |
|
| [4] |
|
| [5] |
|
| [6] |
|
| [7] |
|
| [8] |
|
| [9] |
|
| [10] |
|
| [11] |
|
| [12] |
|
| [13] |
|
| [14] |
|
| [15] |
|
| [16] |
|
| [17] |
|
| [18] |
|
| [19] |
|
| [20] |
|
| [21] |
|
| [22] |
|
| [23] |
|
| [24] |
|
| [25] |
|
| [26] |
|
| [27] |
|
| [28] |
|
| [29] |
|