
Performance of Amperometric and Potentiometric Hydrogen Sensors
[Yuejun Ouyang1, 2 , Xiaojian Wang1 , Gang Yu1, *  , Zhengwei Song
1 , Xueyuan Zhang1, * ]
, Zhengwei Song]
|
|


The principle, design, construction and performance of the amperometric and potentiometric sensors for measuring the permeation rate of hydrogen through the wall of metal equipment were investigated in order to develop a new type of hydrogen sensor with high accuracy. The transiet curves of hydrogen permeation under a given charging condition were employed to evaluate the performance of two types of hydrogen sensors. The relative deviation of the hydrogen concentration detected with two types of sensors under the same condition varied from 3.0% to 13%. The accuracy, response time, reproducibility, and installation were discussed and compared. Response time of the potentiometric sensor (E-sensor) was shorter than that of the amperometric sensor (I-sensor). Both types of sensors exhibited good reproducibility. Development of I-sensor composed of a kind of proton conductor adhesives or non-fluid electrolytes which contain two functions of high electrical conductivity and a strong adhesion will be a promising prospect in order to measure hydrogen permeation at high temperature.
One of the most important safety concerns in the oil and gas industry is so-called H2S corrosion. Hydrogen is generated during the corrosion of metal container exposed to acidic process streams or during the pretreatment process such as picking and plating process, etc[1], [2] and [3]. In the presence of H2S, hydrogen generated by corrosion reactions could be easily absorbed and severely permeated into the metal leading to hydrogen damage. Since the important role of hydrogen in the catastrophic failure of metal has been recognized, it is necessary to develop on-line hydrogen permeation probes used in the industry in order to prevent premature component failures or to monitor the efficacy of anticorrosive measures[4].
Industrial hydrogen sensors are usually grouped into pressure or vacuum type[5], [6], [7], [8] and [9]and electrochemical type[10], [11], [12] and [13] according to the measurement principle. Among all the permeation sensors, electrochemical sensors have received increasing attentions in recent years due to their peculiar merits such as fast response, high sensitivity, strong output signal, and low costs, etc[14] and [15]. Amperometric sensors (I-sensors) and potentiometric sensors (E-sensors) are thought as two main types of electrochemical sensor. E-sensors have a wide dynamic range but lack of accuracy due to their logarithmic response[16], [17] and [18]. I-sensors have faster response and more accurate measurement. The alkaline solution was used[19] and [20] as electrolyte in I-sensor constructed from anodic chamber of Devanathan and Stachurski (DS) cell. Cheng et al.[21] developed an intelligent electrochemical sensor for in-situ inspection of the hydrogen induced cracking susceptibility in boiler pipe systems during the picking process, which was a button type of sensor based on a modified DS cell. Ouyang et al.[22] further improved the button sensor of two electrodes into a sealed three electrodes sensor, which were composed of palladium alloy as both of anode and cathode, a nickel wire as reference electrode, 0.2 mol dm− 3 KOH as electrolyte. A potentiostat was used to exert a constant potential to oxidize hydrogen atom diffused to the Pd alloy membrane of the sensor, which was successfully applied to monitor hydrogen due to the corrosion in propane storage tank. E-sensors are based on the measurement of the potential difference between two electrodes in an electrochemical cell. Solid-state electrolyte was commonly used in E-sensors in order to prevent electrolyte leakage[23], [24] and [25]. Lundsgaard[26] first developed an E-sensor utilizing HUO2PO4· 4H2O (HUP) as electrolyte and Pd/HUP or Pt/HUP mixture powders as electrodes. Subsequently, Lyon and Fray[27] reported a solid state hydrogen sensor using HUP electrolyte and HxWO3 reference material. This sensor was used to detect hydrogen in inert gases and in steel. Gnanasekaran et al.[28] described a sensor using CaCl2-CaH2 as electrolyte and Li-LiH as reference mixture to detect hydrogen in liquid sodium. Recently, Ando and Yamakawa[29] developed a ceramic E-sensor with solid electrolyte (5 mol% Yb2O3-SrCeO3) to detect hydrogen permeated through steel structure at elevated temperatures, but his research was only limited in the laboratory. The application of electrochemical hydrogen sensor at high temperature in industry has not been reported so far. The comparison in the response time and accuracy between two types of electrochemical sensors has not been carried out till now.
Hydrogen permeation curves in a pure iron membrane were measured with two types of sensors in order to compare their general performance specifications. Their response and accuracy were analyzed in detail in order to develop a hydrogen sensor with high-precision.
Devanathan and Stachurski (DS) proposed an electrochemically sensitive system with instantaneous recorder of hydrogen permeation rate in an electrolytic process through a metallic foil, sheet or membrane. The specimen of a metal membrane is clamped to two separate cells. Its structural model is shown in Fig. 1[30].
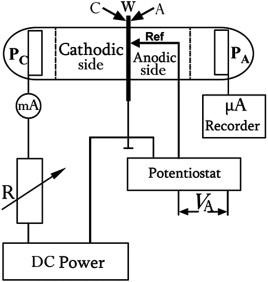 | Fig. 1 Schematic structural model of Devanathan-Stachurski double cell. C: cathodic side of working electrode; A: anodic side of working electrode; PA, PC: auxiliary electrode; r: reference electrode; W: working electrode; R: variable resistor. |
One side of the membrane acts as the cathode and the other as the anode. In Fig. 1, the left cell (input side) contains a solution with high concentration of hydrogen ions like H2SO4 solution, while in the right side cell (exit side), it is necessary to have a basic solution (usually KOH) in order to avoid corrosion on the steel surface which affects hydrogen permeation detection. Previous results have indicated that it is necessary to cover the membrane with palladium or nickel to avoid corrosion and to provide catalysis for a complete oxidation of diffused hydrogen atoms[31], [32], [33] and [34]. The mechanism of I-sensor could be expressed as follows:
Anodic reaction: H + OH− → H2O + e−
Cathodic reaction: H2O + e− → OH− + H
Cell reaction: H → 1/2H2
Hydrogen atoms penetrate through cathodic Ni or Pd foil in sensor and are recombined to H2 on the external surface of sensor and to escape to the atmosphere finally.
The distribution of hydrogen in steel profiles could be calculated by Fick's first diffusion law according to the permeation rate of hydrogen from the internal surface in the reactor steel wall to the nickel electroplated interface in the sensor.
In the steady state, the H concentration at inner wall of metal membrane, i.e, entrance side, c0 (mol cm− 3), could be calculated from the following equation:
equation(1)


The E-sensor could be described in terms of the following galvanic cell:
(− )Ni(H)|0.2 mol dm− 3 KOH|NiO2(s)(+)
Anode reaction: 2H + 2OH− = 2H2O + 2e−
Cathode reaction: NiO2(s) + 2H2O + 2e− = Ni(OH)2(s)+2OH−
The overall cell reaction may be represented as: NiO2 (s) + 2H = Ni(OH)2 (s).
The electromotive force generated when the cell anode is exposed to hydrogen atoms, may be represented by the Nernst's equation:
equation(2)
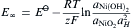

and a2NiO are both considered as 1. According to the Fick's second law and through Laplace transform, the concentration of hydrogen atoms in the inner wall of metal membrane (c0, mol cm− 3) could be expressed as:
equation(3)

The iron membranes through which hydrogen was diffused were cut from commercial α iron sheets of 0.40 mm in thickness. Because this work focused on investigating the performance of the amperometric and potentiometric sensors, so permeating hydrogen source through iron or steel specimen was not restricted. In order to shorten the experimental period, α iron was chosen as the permeation specimen. The chemical composition of the α iron was (wt%): 0.012 C, 0.60 Mn, 0.05 S, 0.05 P and balance Fe. The membrane specimens were 150 mm × 150 mm in size. In order to acquire highly catalytic activity of H oxidation, the specimen surface was pretreated and electroplated. Indeed, it is difficult to electroplate Pd coating as well in the field. In literature[36], it has been reported that nickel coating could replace Pd coating as an alternative. Using Ni coating can save costs, and thus improve economic efficiency. Another aspect to be outlined is that 1-2 μ m Ni catalytic coating is much thinner that the specimen and the steady data were obtained through detection. So we did not consider the H diffusion time through Ni coating basically. So nickel plating was chosen as the catalytic coating in the sensor in our researches.
The following pretreatment of specimens was described: mechanically grounded with carbimet (SiC) grinding paper of 1200 grit → cleaned with alkaline solution (50 g dm− 3 NaOH + 10 g dm− 3Na3PO4· 12H2O) → rust was removed with HCl solution (90 g dm− 3) → electroplated nickel (in the plating solution composed of 215 g dm− 3 NiSO4· 7H2O, 11 g dm− 3 NaCl, 33 g dm− 3 H3BO3, 25 g dm− 3Na2SO4, 35 g dm− 3 MgSO4, pH 5-5.5, Room temperature, with 15 mA cm− 2 cathodic current) → weathered. Washing with distilled water was performed between each step.
The charging and detection setup for hydrogen permeation are schematically shown in Fig. 1. Cathodic polarization of the entrance side was achieved in a galvanostatic way. The cathodic compartment was filled with 0.2 mol dm− 3 NaOH + 1% Na2S solution. Na2S (in fact as the form of H2S) was a poison agent for H atoms to combine into H2 on the cathode side and made more H atoms permeate into specimen. Although Fe reacted with S2− to form FexSy passive film, we can remove it each experiment via polishing in order to gain a good reproduction of charging hydrogen. The testing membrane was respectively charged with 0.2, 0.4, 0.6, 0.8, 1.0 mA cm− 2 cathodic current density. There was only 1 cm2 nickel coating contacted with electrolyte of the sensor. All the experiments were carried out at 298 ± 1 K and the permeation curves were measured by a computer-controlled electrochemical working station (Interface 1000 Potentiostat/Galvanostat/ZRA, American Gamry instruments, Inc.).
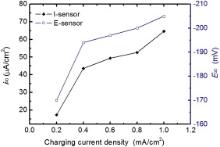
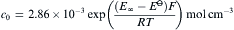
Nickel was plated on iron sheet for 5 min at 298 K with the current density of 1 A dm− 2 at the working side of the sensor according to our previous research[37]. 0.30 VNi (versus Ni electrode) was imposed as the oxidation potential of diffused hydrogen atoms. Hydrogen was charged with the cathodic current density of 0.2, 0.4, 0.6, 0.8, 1.0 mA cm− 2 at room temperature (298 K), respectively. Fig. 2 shows the dependence of the steady values (i∞ and E∞ ) measured with two types of sensors on charging current density, respectively. When the charging current density was 0.2 mA cm− 2, the response of steady current density only reached 17.3 μ A cm− 2 and the E-sensor reached a steady potential of − 170 mV. When hydrogen atoms were continuously accumulated on the cathode chamber, H permeation rate through the Fe membrane increased. It demonstrated that the measured steady current gradually increased with increasing the charging current density. The potential measured by the E-sensor was reduced because of the permeated hydrogen in the iron membrane[38] and [39]. With the rise of charging current density, permeated hydrogen atoms in the iron also increased and the steady potentials became more negative. Nevertheless, the potential decrements turned small. This change of signal could reflect the adsorption state of the hydrogen atoms on the entrance side in the charging chamber. The excessive hydrogen atoms were not adsorbed on the charging side of iron membrane, and a part of hydrogen atoms would combine into hydrogen gas, then escape from the cathodic solution. Hydrogen gas did not permeate into the iron membrane. Under the charging current density of 0.2 mA cm− 2, i∞ and E∞ were low. Both i∞ andE∞ reflected the state of hydrogen atoms adsorbed on the charging side of iron membrane in the cathodic room.
 | Fig. 2 Steady signal values from I-sensor and E-sensor at various charging currents. |
The H concentration at inner wall of metal membrane could be calculated through Eq. (1) and Eq. (3). The H concentration and measurement deviation by two sensors are shown in Table 1.
| Table 1 H concentration on entrance side of Fe membrane and measurement deviation by two sensors |
A c0, a and c0, p are the H concentrations at inner wall of metal substrate which are detected by I-sensor and E-sensor, respectively. i∞ is the permeation current density at the steady state, E∞ is the measured steady potential.B Relative deviation σ R=|c0, a− c0, p|/c0, a× 100%.
The H concentration was raised with increasing the charging current density. The H concentration c0calculated by two equations lay in the same order of magnitude. The relative deviation ranged from 3.0% to 13.6%. The H concentrations calculated with the response signals of two types of sensor were slightly different.
4.2.1. Response time of two types of sensors
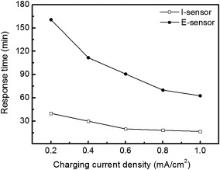
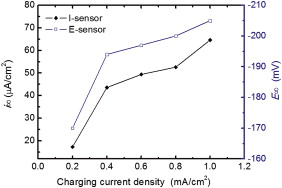
The response time is defined as the corresponding time when the response signal reaches 90% of the steady-state value[40]. Fig. 3 shows the curves of response time via two types of sensor under different charging conditions. As the charging current density was raised, the response time of the both sensors turned shorter. It slowly decreased when the charging current density was raised from 0.6 to 1.0 mA cm− 2 because cathodic chamber could provide more hydrogen atoms to penetrate the sample membrane. I-sensor exhibited a faster response rate than E-sensor as shown in Fig. 3. The difference value (D-value) of response time of the two types of sensor also decreased with the charging current density. Response time of the E-sensor is at least 1 h longer than that of the I-sensor under the same hydrogen permeation condition because the equilibrium established by E-sensor needed a longer time. For the I-sensor, hydrogen atoms could be quickly and completely ionized when they diffused to the active coatings, so the response rate of the I-sensor would be faster.
 | Fig. 3 Contrast curve of the response time under different charging currents. |
4.2.2. Reproducibility of two types of sensors
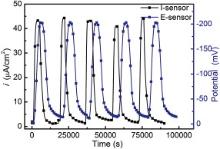
Under the same charging condition, the stability and reproducibility of the two type sensors was examined. After reaching a steady current or potential, charging was stopped in order for the sensor to recover to the original baseline. Then it was charged again and the hydrogen permeation curve was measured. After five cycles of charging on and off, the experimental results are shown in Fig. 4. It demonstrated a good stability and reproducibility of the signal. Fig. 4 also shows the long-term performance of the I-sensor and E-sensor under the same charging condition. After five cycles of charging on and off, it was seen that both of the two type sensors have good reproducibility and long-term stability.
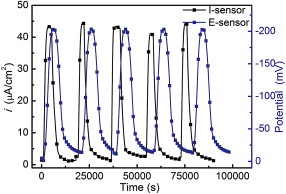 | Fig. 4 Hydrogen permeation curve after five cycles of charging on-off experiment at 298 K with I-sensor and E-sensor, respectively (charged with 0.8 mA cm− 2). |
An understanding and comparison in the performance of the two types of sensors would be important in guiding the selection and development of the most appropriate technology for a specific application of hydrogen sensor, in particular for a future hydrogen sensor used at high temperature. A summary of the general performance specifications which include cost, installation considerations, and operational requirements for each type of sensor was compared in the following parts. The current signals from I-sensor are of a high stability, high precision, so it could work in a long-term. However, the application of a potentiostat instrument makes the testing equipment or the design of the sensor more expensive. Inside the I-sensor, the open vent for discharging hydrogen gas produced from the cathode is easy to make the liquid solution in the sensor evaporate and shorten the running time of I-sensor. The application of I-sensors is also limited in some working environments without on-site larger power or a permit of electrical wires for the potentiostat instrument. E-sensors differ from I-sensors in that E-sensors can ideally run without external power supply, which only measure the potential difference or electromotive force between the sensing electrode and the reference electrode. Unlike I-sensors, the potential signal from an E-sensor is nearly independent of sensor size and geometry, which is an advantage from a view point of sensor miniaturization. However, potential signal measured by E-sensors is a logarithmic dependence of hydrogen concentration, which results in a lower accuracy at high concentrations as compared with that of the I-sensors for linear response of current. The response of the I-sensor is faster than that of the E-sensor. Moreover, the I-sensor has been successfully applied in engineering field at room temperature.
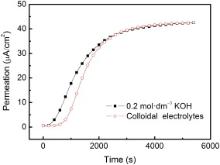
I-sensors used for field application are only composed of an anodic compartment in the DS cell. A thin layer of nickel (or palladium) was plated on the surface of the external wall of the equipment as the catalytic coating to oxidize hydrogen. Because the sensor is fixed on the equipment walls, the leakage of the liquid electrolyte in the sensor is a potential engineering problem. The accuracy of hydrogen measurement not only depends on the design of the sensors, but also on the reliable installation technique of the sensors. It is a best option to use high conductive and non-flowing electrolyte inside the sensor from a point of leakage for liquid electrolyte. Colloidal electrolyte could solve the leakage problem when temperature of the equipment is lower than 323 K. The hydrogen permeation curves with the colloidal electrolyte and the liquid KOH electrolyte in the sensor developed in our group[37], are shown inFig. 5. It exhibited the same steady permeation current with two types of electrolyte in the sensor under the charging current density of 0.4 mA cm− 2. The colloidal electrolyte sensor could effectively prevent liquid electrolyte from the leakage in the gap between the wall surface of the equipment and sensor.
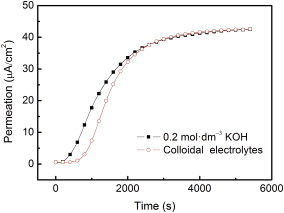 | Fig. 5 Permeation curves in different electrolytes. |
As compared with liquid electrolytes, solid polymer electrolytes have the advantages against the leakage, corrosion and volatilization. Nafion (Dupont, USA), as one of the best proton conductors, has been widely used in fuel cells[41], [42] and [43] and electrochemical sensors which responses hydrogen gas at 323-473 K[44]. The electrochemical hydrogen sensors composed of ceramic solid electrolytes (5 mol% Yb203-SrCeO3) could measure H permeation at elevated temperatures (around 723 K) [45]. It was actually a hydrogen gas sensor but not a really hydrogen permeation sensor because there is a space between the sensor and the surface of equipment wall. So the sensor was not conformed to the detection principle of the DS cell. It also had the problem of hydrogen gas leakage if sealing was poor.
The joint between the sensor and surface of the equipment wall not only needs a high electrical conductivity of solid electrolyte, but also requires a strong adhesion between them. If a kind of proton conductor adhesives which contains two functions described above is developed, it could effectively solve the installation problems of I-sensor and improve the accuracy of measurements. At normal temperature, colloidal electrolyte could be employed to solve the leakage problem of the sensor. Nevertheless, the proton conductor adhesives used at elevated temperatures could meet the above requirements, so it is a promising solid electrolyte used for the hydrogen sensor at high temperature.
(1)Both amperometric type and potentiometric type sensors could be successfully used in the measurement of hydrogen permeation. The smallest relative deviation of the measurement results was only about 3.0%.
(2)Two types of hydrogen sensors exhibited good reproducibility. The E-sensor has longer response time and lower sensitivity. The performance of I-sensor is more superior.
(3)It is more important to develop proton conductor adhesives with excellent performance which contains two functions of a high electrical conductivity of solid electrolyte and a strong adhesion. It is also a promising solid electrolyte used for the hydrogen sensor at high temperature.
The authors have declared that no competing interests exist.
| [1] |
|
| [2] |
|
| [3] |
|
| [4] |
|
| [5] |
|
| [6] |
|
| [7] |
|
| [8] |
|
| [9] |
|
| [10] |
|
| [11] |
|
| [12] |
|
| [13] |
|
| [14] |
|
| [15] |
|
| [16] |
|
| [17] |
|
| [18] |
|
| [19] |
|
| [20] |
|
| [21] |
|
| [22] |
|
| [23] |
|
| [24] |
|
| [25] |
|
| [26] |
|
| [27] |
|
| [28] |
|
| [29] |
|
| [30] |
|
| [31] |
|
| [32] |
|
| [33] |
|
| [34] |
|
| [35] |
|
| [36] |
|
| [37] |
|
| [38] |
|
| [39] |
|
| [40] |
|
| [41] |
|
| [42] |
|
| [43] |
|
| [44] |
|
| [45] |
|