


Co-Doped ZnO Nanoparticles: Structural, Morphological, Optical, Magnetic and Antibacterial Studies
[N. Mohamed Basith1, 2 , J. Judith Vijaya1, *  , L. John Kennedy
3 , M. Bououdina4, 5 , S. Jenefar6 , V. Kaviyarasan6 ]
, L. John Kennedy|
|

 , L. John Kennedy
Un-doped and Co-doped ZnO nanoparticles (NPs) with different weight ratios (0.5, 1.0, 1.5, and 2.0 wt% of Co) were synthesized by a facile and rapid microwave-assisted combustion method using urea as a fuel. The prepared NPs were characterized by X-ray diffraction (XRD), high resolution scanning electron microscopy (HR-SEM), energy dispersive X-ray analysis (EDX), diffuse reflectance spectroscopy (DRS), photoluminescence (PL) spectroscopy and vibrating sample magnetometry (VSM). XRD patterns refined by the Rietveld method indicated that Co-doped ZnO had a single pure phase with wurtzite structure suggesting that Co2+ ions would occupy Zn2+ ionic sites within the ZnO crystal lattice. Interestingly, the morphology was found to convert substantially from grains to nanoparticles with close-packed periodic array of hexagonal-like shape and then into randomly distributed spherical NPs with the variation of Co-content. The optical band gap estimated using DRS was found to be red-shifted from 3.22 eV for the un-doped ZnO NPs then decrease up to 2.88 eV with increasing Co-content. PL spectra showed a strong green emission band thus confirming the formation of pure single ZnO phase. Magnetic studies showed that Co-doped ZnO NPs exhibited room temperature ferromagnetism (RTFM) and that the saturation magnetization attained a maximum value of 2.203 × 10⁻³ emu/g for the highest Co-content. The antibacterial studies performed against a set of bacterial strains showed that the 2.0 wt% Co-doped ZnO NPs possessed a greater antibacterial effect.
Zinc oxide (ZnO) is nontoxic, biosafe, and biocompatible, and hence it has been used in biomedical fields, such as drug carriers, antibacterial agents, bioimaging probes for cancer treatment[1] and [2]. The commonly accepted mechanism of antibacterial action of a material is the production of reactive oxygen species (ROS) on the surface of ZnO nanoparticles (NPs) and in the presence of light oxidative stress in bacterial cells occur, thus leading to the death of the cells[2]. Moreover, ZnO is being a wide band gap (3.37 eV) wurtzite-phase semiconductor, which has attracted a considerable scientific attention, due to its importance for applications in the fields of piezo-electronics, opto-electronics and high power electronic devices[3]. Recent theoretical predictions showed that the transition metal (TM) doped ZnO diluted magnetic semiconductors (DMS) exhibit ferromagnetic properties at room temperature, which have led to an increase in further studies of the material. Also, the development of room temperature ferromagnetic semiconductor is considered as a key material for advancing spintronics or spin-electronics technology[4]. The advantages of such spin based electronic devices include the enabling of instant-on computer, higher data processing speed, increased integration density, and very low electrical energy consumption[5].
The main challenge for practical applications of DMS materials is the achievement of room temperature ferromagnetism (RTFM). Dietl et al. have explained the ferromagnetism in Co-doped ZnO and GaN with a very high Curie temperature by a mean field theory[6]. Sato and Katayama-Yoshida have proved that 3d transition metal atoms (such as Mn, Fe, Co, and Ni) showed ferromagnetic ordering in ZnO using the band structure calculations and density functional theory (DFT), which is based on the local density approximation (LDA)[7]. It shows the multifunctional properties like magnetic, semi-conducting and optical properties coexisting in a single material. Experimental observations of RTFM as reported in the literature have been quite incongruous. Several groups[8], [9] and [10] have observed the ferromagnetism in Co-doped ZnO, while others[11] and [12] have not in similar compositions (doping concentrations). In spite of that, Co-doped ZnO has been attracted not only for its RTFM[13], but also for its ferromagnetic transport properties.
Structural, morphological, optical and magnetic properties of nanomaterials are found to be highly dependent on the synthesis method as well as processing conditions. As it is well known, various methods have been used for the synthesis of un-doped and Co-doped ZnO NPs, such as template synthesis[14], polymeric precursor method[15] and [16], polymeric sol-gel method[17], auto-combustion method[18], sol-gel route[19], gel-combustion route[20], co-precipitation method[21], mechanosynthesis[22], and RF-magnetron sputtering technique[23]. The methods used in the above mentioned reports require much time and need high annealing temperatures, which make them expensive. On the other hand, microwave-assisted combustion method is more favourable due to the reason that the microwaves interact with the reactants at the molecular level, which provides a better control of stoichiometry, formation of various morphologies, enhanced purity and homogeneity[24] and [25]. When this electromagnetic energy (microwave) is transferred and converted into heat by rapid kinetics through the motion of the molecules during the chemical reaction[26], it results in the formation of nanoparticles in the early phase formation with different morphologies and high efficiencies within a few minutes[26] and [27]. By means of direct microwave-assisted combustion synthesis, many functional materials and compounds with novel structures and properties have been obtained[28], [29], [30], [31], [32] and [33]. But to the best of our knowledge, there is no report on the evolution of structural, morphological, optical, magnetic properties and antibacterial activity of Co-doped ZnO NPs by using urea as a fuel. Furthermore, using microwave-assisted technique, it is possible to scale-up the reaction[34].
The main aim of this study is to investigate the structural, morphological, optical, magnetic and antibacterial activity of Co-doped ZnO NPs. In the present work, Co-doped ZnO NPs were successfully synthesized by a microwave combustion method by varying the Co-content (0.5, 1.0, 1.5, and 2.0 wt%). The samples were characterized by using powder X-ray diffraction (XRD), high resolution scanning electron microscopy (HR-SEM), diffuse reflectance spectroscopy (DRS), and photoluminescence (PL) spectroscopy. Magnetic measurements were carried out by using vibrating sample magnetometry (VSM) at room temperature. Additionally, antibacterial activity measurements were performed and presented.
Un-doped and Co-doped ZnO NPs with 0.5, 1.0, 1.5, and 2.0 wt% of Co were synthesized by a microwave combustion method using the precursors, zinc nitrate hexahydrate (Zn(NO3)2· 6H2O), cobalt nitrate hexahydrate (Co(NO3)2· 6H2O) and urea (NH2CONH2) as a fuel. All the materials used were of analar grade obtained from Merck, India and used without further purification. The constituents in the desired proportions were dissolved in deionized water and stirred for 15 min to obtain a clear transparent solution. It was then poured into a silica crucible, and then placed in a domestic microwave-oven and exposed to the microwave energy in a 2.45 GHz, multimode cavity 750 W for 10 min. Initially, the solution boiled and underwent dehydration followed by decomposition with the evolution of gases. When the solution reached the point of spontaneous combustion, it was vaporized and instantly became a dry and crystalline fine oxide powder. The obtained samples were thoroughly washed with alcohol for several times to remove the ions possibly remaining in the final products and then dried in a hot air oven at 70 ° C for 2 h. The entire microwave combustion reaction of metal nitrates with urea to form Co-doped ZnO powders took place within 15 min. The complete synthesis process was completed within a few minutes, and the only external thermal energy input was needed for dehydration of the precursor solution and for igniting the combustion reaction.
96-well microtitre plates (Tissue culture grade) of mueller hinton broths (MHB) with resazurin dye were purchased from Himedia (India). Escherichia coli ATCC 25922, Pseudomonas aeruginosa ATCC 15442, Bacillus cereus ATCC 13061, Salmonella typhi MTCC 3216, Staphylococcus aureus ATCC 25923 and Candida albicans ATCC 90028, were purchased from culture collection, Pune, India. Antibacterial activity of un-doped and Co-doped ZnO NPs were performed against E. coli ATCC 25922, P. aeruginosa ATCC 15442, B. cereus ATCC 13061, S. typhi MTCC 3216, S. aureus ATCC 25923 and C. albicans ATCC 90028 using broth microdilution method according to the modification of CLSI MA7-A4[35]. Un-doped and Co-doped ZnO NPs were suspended in dimethyl sulfoxide (DMSO) to prepare a stock solution of 10 mg/mL and mueller hinton broth, and then it was used for further dilutions. Triplicate 50 μ L samples of Co-doped ZnO NPs were placed into sterile 96-well microtiter plates. The bacteria inoculum (∼5 × 10⁵ CFU/mL) was diluted to 1:200 by using MHB. The minimum inhibitory concentration (MIC) is the lowest concentration of the material, which inhibits the growth of an organism. The MIC of un-doped and Co-doped ZnO NPs were determined against the tested organisms using the serial dilution method starting with 5000 μ g/ml and diluted to 2500, 1250, 625, 312.5, 156.25, 78.12, 39.05, 19.52, 9.76 and 4.88 μ g/ml, followed by the addition of 10 μ L of resazurin indicator (0.18%). Plates were incubated at 37 ° C for 15-24 h, and the lowest concentration of Co-doped ZnO NPs that inhibited the growth (blue colour of resazurin) was recorded as the MIC. Gentamicin and vancomycin were used as the standard antibacterial agents for the positive inhibitory controls of gram-negative and gram-positive bacteria, whereas amphotericin B was used as a positive control for the fungi C. albicans.
Structural characterization of un-doped and Co-doped ZnO NPs were performed by using Rigaku Ultima IV high resolution X-ray diffractometer equipped with CuKα radiation (λ = 0.15418 nm) from 2θ = 30° to 80° . Rietveld analysis was carried out by using PDXL software. Surface morphology observations along with the chemical composition were performed by using Jeol JSM6360 high resolution scanning electron microscope equipped with energy dispersive X-ray analysis (EDX). Diffuse reflectance spectra (DRS) were recorded by using Cary100 UV-Visible spectrophotometer and the energy band gap was estimated. Room temperature photoluminescence (PL) spectra within the wavelength range of 370-600 nm were recorded under 240 nm line of Xe laser excitation by using Varian Cary Eclipse fluorescence spectrophotometer. Magnetic measurements were carried out at room temperature using a PMC MicroMag 3900 model vibrating sample magnetometer (VSM) equipped with 1 T magnet.
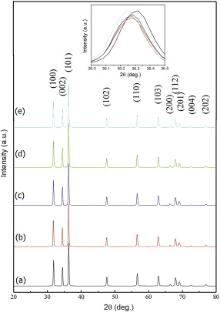
 | Fig. 1 XRD patterns of: (a) un-doped ZnO, (b) 0.5 wt% Co, (c) 1.0 wt% Co, (d) 1.5 wt% Co, (e) 2.0 wt% Co-doped ZnO NPs. The inset shows a magnification of the (101) diffraction peak for the un-doped and Co-doped ZnO NPs. |
Typical XRD patterns of un-doped and Co-doped ZnO compositions with varying 0.5, 1.0, 1.5, and 2.0 wt% of Co concentration are shown in Fig. 1 (a-e). The pronounced diffraction peaks in the XRD pattern located at 2θ = 31.73° , 34.38° , 36.22° , 47.56° , 56.59° , 62.79° , 66.43° , 67.95° , 69.08° , 72.67° , and 77.05° correspond to (100), (002), (101), (102), (110), (103), (200), (112), (201), (004), and (202) planes, respectively. All the diffraction peaks can be indexed with the hexagonal wurtzite-type structure (space group P63mc), which are in agreement with JCPDS card No. 75-0576. In order to study the effect of Co doping, a careful analysis of XRD pattern was levied out. It indicates that there is no clear change in the XRD pattern as well as it is found to be quite sharp and intense, which implies that the high crystallinity of the prepared samples. It is evident from XRD patterns that there is no indication of any secondary phase (metallic cobalt, cobalt oxides or any binary zinc cobalt phases) or clusters, confirming that the samples are pure single phase. Thus, it is understood that Co2+ ions were systematically substituted into Zn2+ions sites within the ZnO crystal lattice without changing the wurtzite structure of the parent ZnO and it is in good agreement with the one reported earlier [18].
The average crystallite size was estimated by measuring the full-width at the half-maximum (FWHM) of the most intense diffraction peak (101) using Debye-Scherrer equation[20]:
equation(1)

where D is the average crystallite size, λ is the wavelength of the incident X-ray beam (0.15418 nm), θ is the Bragg diffraction angle and β is the FWHM. The average crystallite size of Co-doped ZnO NPs was found to be in the range of 19-24 nm. This indicates that the crystallite size increases slightly with increasing Co content. The increase in the Co concentration at the ZnO matrix will increase the nucleation of the particles, which enhances the grain growth of Co-doped ZnO NPs. Mohapatra et al.[36] reported that due to the nucleation, the grain growth increases with increasing Co concentration in the ZnO matrix.
| Table 1 Crystallite size, strain, lattice parameters, cell volume and fit parameters of un-doped and Co-doped ZnO NPs |
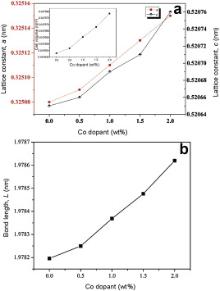
Rietveld refinement (RR) analysis is a very effective method to characterize in detail the crystalline structure, including both the structural (cell parameters, site occupancy, atomic positions, thermal parameters, etc) and microstructural parameters (crystallite size, microstrain, preferred orientation, etc). The typical refinement plots of un-doped and Co-doped ZnO nanoparticles are shown in Fig. 2 (a-e). InFig. 2, the calculated patterns are shown in the same field as a solid line curve. The difference between the observed and calculated intensities is shown in the middle field. All refinements were performed using the space group P63mc, and both structural and microstructural parameters are listed in Table 1. During the refinements, the goodness of fit is defined by the reliability factor S = Rwp/Re, where Rwp andRe are R-weighted and R-expected patterns, respectively [37]. The values of the crystallite size obtained using Debye-Scherrer formula are in the same range as the values obtained by profile fitting by RR analysis. This small difference may be due to the fact that the contribution of the internal strain is not considered in Scherer model, where the peak shape is fitted with Gaussian only. But in the Profile fitting by RR analysis, the peak shape profile is fitted by using a linear combination of Gaussian (microstrain) and Lorentzian (crystallite size) functions, which is called as Voight or Pseudo-Voight functions [37]. From the structural analysis, the fitted patterns are in agreement with the respective experimental data confirming the formation of pure hexagonal wurtzite ZnO phase without any other impure phases regardless of dopant concentrations. Interestingly, the position of XRD pattern clearly shows that there is a shift in the peak position towards lower 2θ value (inset of Fig. 1) with increasing Co content, which means that the lattice parameters a and c increase with increasing Co concentration. The increasing trend of lattice parameters clearly indicates that Co2+ ions are substituting Zn2+ ions on the ZnO matrix and these results are in good agreement with the one reported earlier [18]. Fig. 3 (a) shows the variation of lattice parameters a and c, from RR analysis as a function of dopant concentration. The nearest-neighbour Zn-O bond length along the c-direction is given by [38]:

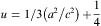
 where L is the bond length, a and c are the lattice parameters from RR analysis, and u is the internal parameter. The internal parameter u in the wurtzite structure is defined as:
equation(3)

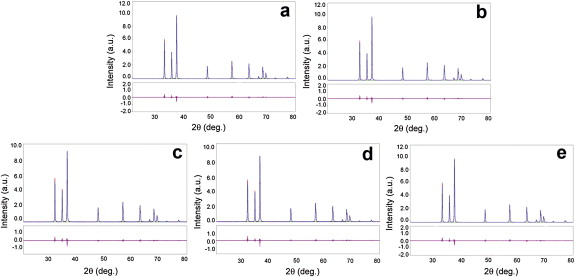 | Fig. 2 XRD pattern refinements by the Rietveld method of: (a) un-doped ZnO, (b) 0.5 wt% Co, (c) 1.0 wt% Co, (d) 1.5 wt% Co, (e) 2.0 wt% Co-doped ZnO NPs. (Experimental data, upper solid line: calculated pattern, lower solid line: intensity difference). |
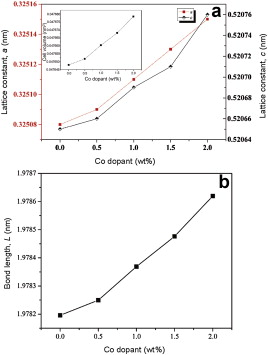 | Fig. 3 (a) Plot of lattice parameters (a and c) vs Co-doped ZnO, the inset shows the cell volume as a function of Co-doped ZnO NPs; (b) bond length vs Co-doped ZnO NPs. |
Fig. 3 (b) depicts the plot of the calculated Zn-O bond length as a function of Co content. It is clear fromFig. 3(b) that Zn-O bond length follows the increasing trend as the lattice parameters increase with increasing cobalt content. The c/a parameter has also been found to show a good agreement with the value of 1.633 for the ideally close packed hexagonal structure. The volume of unit cell hexagonal system has been calculated from the following equation [38]:
equation(4)
V=0.866a2c
 The values of the crystallite size, strain, lattice parameter, and cell volume obtained from the RR analysis are shown in Table 1.
The morphology of the un-doped and Co-doped ZnO NPs was studied by HR-SEM studies (Fig. 4).Fig. 4(a, b), (c, d) and (e, f) shows the SEM micrographs of the un-doped ZnO, 0.5 wt% and 2.0 wt% Co-doped ZnO samples, respectively. These figures show the presence of large spherical aggregates of smaller individual NPs of various sizes. From Fig. 4(a, b), it is observed that the un-doped ZnO shows grains having sizes in the range of 25-30 nm with inter-granular spacing. The micrographs clearly indicate the presence of weak links between the grains. Fig. 4(c, d) shows the formation of NPs that are self-aggregated in a close-packed periodic array of hexagonal-like shape. The average particle size of these NPs are found to be in the range of 30-35 nm up to 0.5 wt% Co-doped ZnO. Fig. 4(e, f) revealed the presence of randomly distributed spherical NPs up to 2.0 wt% of Co-doped ZnO with the size ranging from 37 to 42 nm. From the above observations, it can be noticed that the doping concentration of Co affects the parent ZnO, and the grains are in the nanoscale region, but slightly increase as the Co concentration increases.
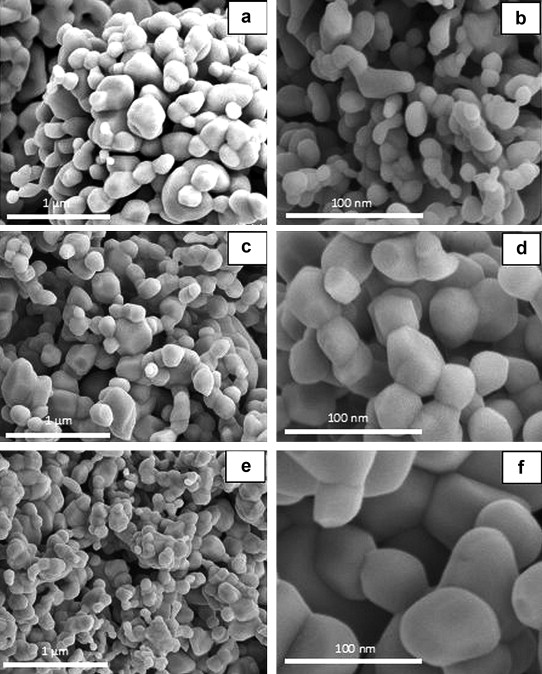 | Fig. 3 HR-SEM images of: (a, b) un-doped ZnO, (c, d) 0.5 wt% of Co-doped ZnO, (e, f) 2.0 wt% of Co-doped ZnO NPs. |
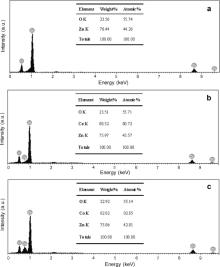
To check the chemical composition of the material, an EDX analysis was performed. Fig. 5(a-c) depicts the EDX spectra of un-doped ZnO, 0.5 wt% and 2.0 wt% Co-doped ZnO samples. Fig. 5(a), which is the EDX spectrum of the un-doped ZnO, shows the presence of zinc and oxygen signals only, confirming the high purity of ZnO. Fig. 5(b, c) shows the EDX spectrum corresponding to the presence of O, Zn, and Co elements only. Compositional analysis results determined by the EDX analysis are in good agreement with the starting compositions of 0.52 wt% and 2.02 wt% compared to 0.5 wt% and 2.0 wt% for Co-doped ZnO NPs. It is important to notice that the prepared Co-doped ZnO nanoparticles are pure and free from impurities. These results are in consistent with the XRD results. It is also interesting to note that the preparation conditions completely favour the doping of cobalt into the ZnO lattice, thus allowing to studying the effect of increasing cobalt content on the properties of Co-doped ZnO NPs.
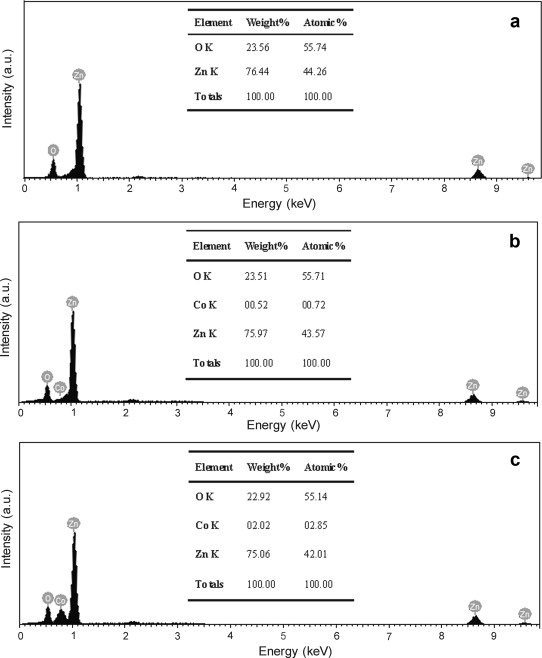 | Fig. 4 EDX spectrum of: (a) un-doped ZnO, (b) 0.5 wt% of Co-doped ZnO, (c) 2.0 wt% of Co-doped ZnO NPs (inset table shows the composition of elements). |
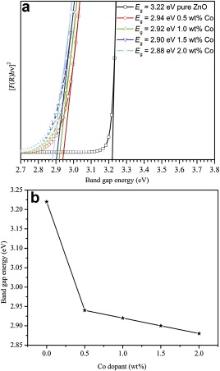
The optical properties of Co-doped ZnO NPs were measured and compared with un-doped ZnO to investigate the effect of Co doping on the band gap energy value. The spectra of the as-prepared samples were recorded in the range of 200-800 nm at room temperature. The direct band gap energy (Eg) of the NPs has been estimated from DRS measurements using Kubelka-Munk (K-M) function [39]and the F(R) value is calculated from the following equation:
equation(5)
F(R)=2(1− R)/2R

 | Fig. 5 Plot of [F(R)hυ ]2 vs band gap energy, (b) band gap as a function of Co-doped ZnO NPs. |
In order to study the role of doping induced defects on the photoluminescence behaviour of the synthesized ZnO NPs, excitation spectra were recorded at room temperature. Fig. 7 shows the room temperature PL spectra of the un-doped and Co-doped ZnO nanoparticles. The samples were excited by using the excitation wavelength of 325 nm. It was observed that all the PL spectra were composed of two emission bands, which consists of near-band-edge emission (NBE) peak lying at ultraviolet (UV) transition region and a strong visible light (VL) emission peak related to deep level defect (DLD) transition. PL spectra reveal the presence of two main peaks, UV emission peak at 400 nm and a weak-broad green emission peak in the visible region at 536 nm. With Co-doping, the contribution of 400 nm UV peak diminishes while the contribution of 536 nm green peak becomes prominent. The contribution of the 536 nm peak further improves with increasing Co-doping. The UV emission at 400 nm is related to the exciton recombination of NBE[43], whereas the green emission at 536 nm results from the recombination of electrons with holes trapped in the singly ionized oxygen vacancies (+Vo) and the associated DLD. Furthermore, there is a slight increase in the green emission intensity at 536 nm, which agrees well with the reported emission bands of TM-doped ZnO[44]. Based on our results, it can be noticed that the enhancement in the density of the singly ionized oxygen vacancies (+Vo) occurs with increasing cobalt content. It also shows that the probability of non-radiative and visible emission increases, whereas the probability of UV emission diminishes. This seems to be the main cause behind the enhanced green emission with increasing Co doping and the results are in good agreement with XRD, EDX and UV-Visible studies.
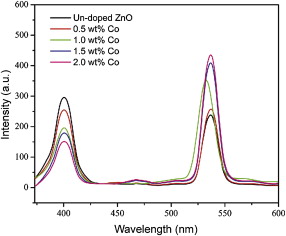 | Fig. 6 Room temperature PL spectra of un-doped and Co-doped ZnO NPs. |
The magnetization (M) vs applied magnetic field (H) curves at room temperature for un-doped and Co-doped ZnO NPs are shown in Fig. 8. It can be seen that the un-doped and Co-doped ZnO NPs exhibit a well defined hysteresis loops with different coercivities, remanence and saturation magnetization (Ms), which indicates that all the compositions show a room temperature ferromagnetic (RTFM) behaviour. The value of the saturation magnetization (Ms) is 0.485 × 10− 3, 0.523 × 10− 3, 0.739 × 10− 3, 1.342 × 10− 3, and 2.203 × 10− 3 emu/g for 0, 0.5, 1.0, 1.5 and 2.0 wt% Co doping, respectively. It is worth noticing that Ms value increases with increasing Co dopant concentration. But the magnetization value is still several orders of magnitude lower than those conventional ferromagnetic materials (∼100 emu/g). As a result, the magnetism within these nanoparticles is marginal in considering these materials as ferromagnetic materials. The similar results were observed in the other Co-doped ZnO reported earlier[18] and [45]. Furthermore, the low magnetization results were also observed for Fe-doped ZnO using a microwave irradiation technique [46]. The origin of RTFM in DMS materials has been explained by considering the several assumptions [47], [48] and [49], including the presence of secondary phase, level/density of defects (O, Zn or both O and Zn vacancies), free carrier-mediated exchange, the sp-dexchange mechanism, etc. It has been reported that the bulk ZnO exhibits a weak diamagnetic behaviour, whereas ZnO NPs show a RTFM, mainly due to the formation of oxygen and zinc vacancies during the preparation, and the associated point defects [47]. Interestingly, in this study, un-doped ZnO NPs show a RTFM behaviour, and it is in agreement with the previous report [47].
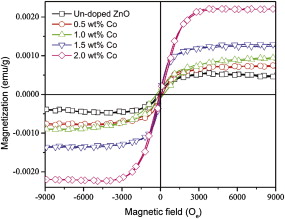 | Fig. 7 Room temperature hysteresis (M-H) curve of un-doped and Co-doped ZnO NPs. |
In order to elucidate the origin of RTFM in Co-doped ZnO NPs in the present work, a probable explanation can be found from XRD, EDX and UV-Visible results. These results suggest that Co2+ ions occupy Zn2+sites within the ZnO lattice, and there is no evidence for the formation of any secondary phase (metallic cobalt, cobalt oxides or any binary zinc cobalt phases) or clusters. The lattice parameters were found to increase with increasing Co content, while keeping the original wurtzite-type crystal structure, thus confirming the formation of pure and single phase, which in turn suggest that Co2+ ions are incorporated into Zn2+ sites, instead of forming Co clusters. This provides strong but indirect evidence that the magnetization is not due to the secondary phase and clusters.
Based on the obtained results, it can be noticed that the observed RTFM in the Co-doped ZnO NPs originates from a combination of two effects mainly: (i) substitution of non-magnetic metal Zn by a magnetic metal Co; and/or (ii) probably from the oxygen vacancy defects constituting the bound magnetic polarons (BMP). This is one of the promising candidates for the origin of RTFM in this system. In the present experiment, a rapid microwave heating might induce the formation of oxygen vacancy defects in the Co-doped ZnO NPs and also promote the probable formation of an anionic vacancy. This may play an important role to obtain considerable ferromagnetism in the samples. According to BMP model, the oxygen vacancies and doping cause a greater overall volume to be occupied by BMP. This, in turn enhances the ferromagnetism by the overlap of BMP. Srinet et al.[50] reported that the introduction of Co2+ ion within the un-doped ZnO lattice improves significantly the RTFM. Godoy et al.[51] have reported that the observed RTFM is due to the defects mediated magnetic coupling between Co2+ atoms under the scope of BMP. From the above discussion, an increase in magnetization associated mainly with an increase in oxygen vacancies in addition to the presence of magnetic Co2+ ions within the ZnO lattice are in good agreement with PL results, leading to the enhancement of the ferromagnetic behaviour in Co-doped ZnO NPs, which is also in consistent with some of the earlier reports[50] and [51].
Nanomaterials have become an alternative for antibacterial applications, because of the emergence of nanotechnology. Compared with traditional antibacterial agents, nano-antibacterial materials offer many advantages, such as security, long-lasting, no drug resistance and generality. Un-doped and Co-doped ZnO NPs can be applied to many fields; however, few papers have reported the antibacterial activities of Co-doped ZnO NPs[21], [52] and [53]. In this study, the antibacterial activities of the un-doped and Co-doped ZnO NPs against five bacteria and fungus C. albicans were tested by determining the MIC (μ g/ml). The results are listed in Table 2. It is found that Co-doped ZnO NPs show higher antibacterial activity than un-doped ZnO, according to the following order: 2.0 wt% Co-doped ZnO > 1.5 wt% Co-doped ZnO > 1.0 wt% Co-doped ZnO > 0.5 wt% Co-doped ZnO > un-doped ZnO. Thus, it is evident that an increase in Co doping concentration results in the increase in the antibacterial activity [53]. The possible explanation for the increase in antibacterial effect is due to the metal doping in ZnO. This results in the increase in the abrasive surface texture of ZnO NPs [52] and [54]. Moreover, it has been suggested that Co-doped ZnO might act through the release of Zn2+ from ZnO nanopowders, or by mechanical destruction of the cell membrane by the penetration of NPs, or through the production of active oxidative species generated from the surface of ZnO NPs, etc. But the exact mechanism is still not clearly understood. The outer membrane wall of bacteria is damaged by the reactive species, such as 


| Table 2 Determination of MIC against the test pathogens for the un-doped and Co-doped ZnO NPs |
The results also show that gram-negative bacteria E. coli and S. typhi are highly susceptible to Co-doped ZnO NPs, whereas a moderate activity is noted in gram-positive bacteria S. aureus and B. cereus, and very least activity is recorded against P. aeruginosa and C. albicans. This difference in antibacterial activities between gram-negative and gram-positive bacteria was commonly reported in the literature[58] and [59]. The difference in activity against these two types of bacteria can be explained by the different structures and chemical composition of the cell surfaces. The cell wall of gram-negative bacteria is different from that of the gram-positive bacteria by having an outer membrane that covers the peptidoglycan layer [57]. As clear from the above discussion, it is possible that the generated reactive oxygen species might react with the cell wall, thus results in the killing of bacteria. Further, these NPs gradually interact with the cell membrane leading to the enhancement of permeability of the cell membrane, and thus enter into the cell, and eventually cause the cell death.
The influence of cobalt doping concentration on the structural, morphological, optical, and magnetic properties of un-doped and Co-doped ZnO NPs synthesised via microwave combustion method has been investigated. Rietveld refinements of X-ray diffraction patterns confirm the formation of pure single phase ZnO wurtzite structure with Co content up to 2.0 wt%, where Co2+ replaces Zn2+ ions. The crystallite size varies in the range of 19-24 nm. SEM analysis shows that the morphology changes from grains to NPs with a close-packed periodic array having hexagonal-like shape and then into randomly distributed spherical NPs with the variation of Co-content. A clear red shift has been observed in the direct band gap of the Co-doped NPs, as a consequence of the successful incorporation of Co2+ ions into ZnO lattice. The optical band gap of ZnO remarkably decreases from 3.22 eV to 2.88 eV with increasing Co doping levels from 0 to 2.0 wt%, which is mainly attributed to the d-d transitions. PL spectra show a strong green emission band, when compared to un-doped ZnO, because of the increase in the density of defects for Co-doped ZnO NPs. According to the magnetic measurements, all the compositions exhibit RTFM, and the value of saturation magnetization increases with increasing Co concentration. The observed RTFM is explained on the basis of BMP model, and is dependent on the amount of dopant (Co2+) ions. Further, the antibacterial studies performed against a set of bacterial strains show that higher Co-doped ZnO NPs possess the most antibacterial effect.
The authors have declared that no competing interests exist.
| [1] |
|
| [2] |
|
| [3] |
|
| [4] |
|
| [5] |
|
| [6] |
|
| [7] |
|
| [8] |
|
| [9] |
|
| [10] |
|
| [11] |
|
| [12] |
|
| [13] |
|
| [14] |
|
| [15] |
|
| [16] |
|
| [17] |
|
| [18] |
|
| [19] |
|
| [20] |
|
| [21] |
|
| [22] |
|
| [23] |
|
| [24] |
|
| [25] |
|
| [26] |
|
| [27] |
|
| [28] |
|
| [29] |
|
| [30] |
|
| [31] |
|
| [32] |
|
| [33] |
|
| [34] |
|
| [35] |
|
| [36] |
|
| [37] |
|
| [38] |
|
| [39] |
|
| [40] |
|
| [41] |
|
| [42] |
|
| [43] |
|
| [44] |
|
| [45] |
|
| [46] |
|
| [47] |
|
| [48] |
|
| [49] |
|
| [50] |
|
| [51] |
|
| [52] |
|
| [53] |
|
| [54] |
|
| [55] |
|
| [56] |
|
| [57] |
|
| [58] |
|
| [59] |
|