Effect of Grain Size on Phase Transformation and Photoluminescence Property of the Nanocrystalline ZrO2 Powders Prepared by Sol-Gel Method
1 School of Materials Science and Engineering, University of Science and Technology Beijing, Beijing 100083, China
2 School of Chemistry and Biological Engineering, University of Science and Technology Beijing, Beijing 100083, China
Corresponding author. Prof., Ph.D.; Tel.: þ86 10 62334958; E-mail address: chang@ustb.edu.cn (Y. Chang).
Fund:This project was financially supported by the National Natural Science Foundation of China (No.11175014), the National Basic Research Program of China (No. 2009GB109004) and the National Magnetic Confinement Fusion Program (No. 2011GB108002).
1. IntroductionZrO2 is a wide band gap (5.0-5.5 eV) transition metal oxide with excellent mechanical performance, great electrical behaviors, good chemical resistance, eminent thermal and optical properties. It is one of the most important ceramic materials because of the large range of industrial applications, such as catalysis, coatings, spacecraft shielding, paint additives, oxygen sensors, fuel cells, and nuclear fuel matrix[1], [2], [3] and [4]. Under atmospheric pressure, pure ZrO2 exhibits three polymorphic phases, monoclinic (m-ZrO2), tetragonal (t-ZrO2) and cubic (c-ZrO2) with increasing temperature. Monoclinic phase is stabilized from room temperature to 1175 ° C. In the range of 1175-2370 ° C, tetragonal phase is stabilized. From 2370 to 2680 ° C, cubic phase is the stable phase. Monoclinic to tetragonal or cubic phase transformation will be accompanied by a 3%-5% of volume expansion[5]. In the past few years, many methods have been performed to keep metastable phase ZrO2 stable, such as introducing more oxygen vacancies[6] and [7] or high density defects[8], preparing in high pressure[9], controlling by sodium ions[10]. Tomas et al.[11] and Baldinozzi et al.[12] also reported that the phase transition occurs above a threshold crystal size.
Nanocrystalline ZrO2 has been synthesized by spray pyrolysis, electrospinning zirconia-polymer precursor, gel-combustion routes, sol-gel process, precipitation method[11]. Among them, sol-gel process is one of the best methods for its simple procedure, low-cost, time-saving and perfect properties[11], [13], [14], [15] and [16]. In this paper, nanocrystalline ZrO2 powders were prepared by sol-gel process, and inorganic precursor was chosen for the experiments because of its non-toxicity, low-cost and feasibility compared with organic precursor. An extensive investigation of grain size effects on phase transformation and photoluminescence property of the nanocrystalline ZrO2 powders was performed.
2. ExperimentalIn this study, ZrO2 powders were synthesized by a sol-gel route. Zirconium oxychloride octahydrate (ZrOCl2· 8H2O) and oxalic acid dehydrate (C2H2O4· 2H2O) with the molar ratio of 1:1 were used for the preparation of the precursor solution, and de-ionized water was used as solvent. ZrOCl2 and C2H2O4solutions were stirred for 10 min by using magnetic stirrer, respectively. The former solution was then added slowly to the later solution, and the sol was obtained by hydrolysis and reactions after the precursor solution was stirred for 8 h. The gel was obtained when the sol was aged at room temperature for 12 h. The gel was heated at 100 ° C for 24 h in a vacuum drying oven, fully ground and annealed at 500-1200 ° C for 2 h in air to produce the final powders. The samples annealed at 500, 600, 700, 800, 900, 1000, 1100 and 1200 ° C were named as Z500, Z600, Z700, Z800, Z900, Z1000, Z1100 and Z1200, respectively.
Formation of the sol and the gel can be described as the following formulas:
equation(1)
2ZrOCl+H2C2O2+2H2O=2ZrOCO4· 2H2O+2HCl
 equation(2)
2ZrOCO4· 2H22O+O=22ZrO+42CO+4H2O
 X-ray diffraction (XRD) of the samples was examined on a DMAX-RB X-ray diffractometer using CuKα radiation (λ = 0.15418 nm). The grain sizes of the powders were estimated by using the typical Scherrer equation, and quantitative phase analysis was performed by the Rietveld method. The microstructures were investigated on a JEM-2010 high resolution transmission electron microscope (TEM). Photoluminescence (PL) emission spectra of the samples were investigated by using an F-4500 fluorescence spectrometer with a Xe lamp as the excitation source. In this work, the PL spectra for all the samples were measured in the same condition, and the weight of the samples was the same. Micro-Raman spectrum was taken in backscattering configuration and analyzed with a LabRAM Aramis spectrometer. As an excitation source, we used the 514.5 nm of an Ar-ion laser. Ar-ion laser can emit different wavelengths. Among them, the wavelength of 514.5 nm has very strong emission intensity, which is always used as excited wavelength for the materials.
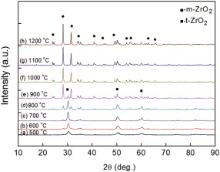
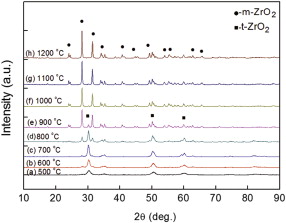
3. Results and Discussion Fig. 1 shows the XRD patterns for all the nanocrystalline ZrO2 samples annealed from 500 ° C to 1200 ° C. Both m-ZrO2 and t-ZrO2 phases were detected at the annealing temperature from 500 ° C to 900 ° C. In Z500 sample, only one weak peak belongs to the (200)m reflections, and the other peaks match well with the reflections of t-ZrO2 phase. As the annealing temperature increases, the diffraction intensity of m-ZrO2 increases, while the intensity of t-ZrO2 decreases, which indicates the phase transformation of the nanocrystalline ZrO2 from tetragonal to monoclinic. Generally, it is difficult to distinguish the characteristic (111) peaks of t-ZrO2 and c-ZrO2, and the peak of (200)c is always regarded as the symbol of the cubic phase. In Fig. 1, no (200)c peak was observed, which means that no cubic phase exists in these samples, and they only consist of m-ZrO2 and t-ZrO2 phases. When the annealing temperature is higher than 1000 ° C, no signal of the t-ZrO2 phase was detected, indicating a complete transformation from t-ZrO2 to m-ZrO2.
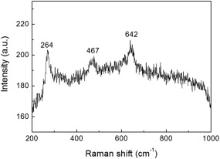
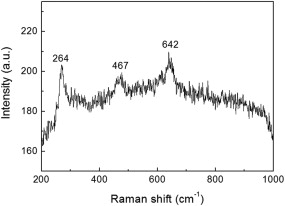
In order to further distinguish the phase structures of t-ZrO2 and c-ZrO2, Raman spectrum from the sample prepared at 500 ° C was measured at room temperature, and the result is shown in Fig. 2. Three separate Raman lines located at 264, 467 and 642 cm− 1 were observed, which corresponds to the typical Raman active mode of t-ZrO2[17]and[18]. No signal of c-ZrO2 was detected, which may ascribe to the formation of c-ZrO2 form at lower temperature[19].
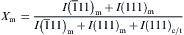
Quantitative phase analysis was performed to determine the concentration of the monoclinic and the tetragonal phases in these samples. The integrated intensity ratio Xm and Xt is defined as the following equation [19], [20], [21], [22], [23]and[24]:
equation(3)

Xt=1− Xm
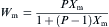
 where I(hkl) implies the integrated intensities of the diffraction line, and m, c, t represent the monoclinic, tetragonal, and cubic phases, respectively. The weight fraction of Wm and Wt can be estimated by using the following relations [20],
equation(5)
 equation(6)
Wt=1− Wm
 where P is a constant with the value of 1.249 [20], and Xm can be obtained from Eq. (3). The values ofXm and Wm for m-ZrO2 in all the samples are listed in Table 1. It reveals that the concentration of m-ZrO2 increases with increasing the annealing temperature, while the concentration of the tetragonal phase decreases and finally disappears as the annealing temperature is up to 1000 ° C.
Table 1
Table 1
 Table 1 Intensity ratio Xm, weight fraction Wm and average grain size for all the nanocrystalline ZrO2 samples| Sample | Xm (%) | Wm (%) | Grain size (nm) |
|---|
| Z500 | 11.4 | 13.9 | 8.6 | | Z600 | 15.7 | 18.9 | 10.7 | | Z700 | 20.0 | 23.8 | 13.2 | | Z800 | 45.9 | 51.5 | 17.0 | | Z900 | 92.2 | 93.7 | 21.0 | | Z1000 | 100.0 | 100.0 | 23.3 | | Z1100 | 100.0 | 100.0 | 25.5 | | Z1200 | 100.0 | 100.0 | 27.5 |
| Table 1 Intensity ratio Xm, weight fraction Wm and average grain size for all the nanocrystalline ZrO2 samples |
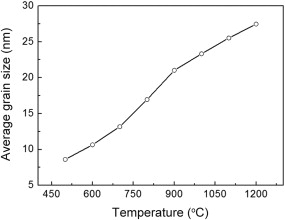
The average grain sizes of these samples can be calculated by Scherrer formula,
equation(7)

 where D is the crystalline size, λ is the X-ray wavelength and the value is 0.15405 nm, θ denotes to Bragg diffraction angle, B is the full-width at half-maximum of the diffraction peak corrected using the corresponding peak of a micron-sized sample
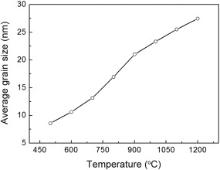
 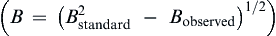 and K is a constant with a value of 0.89 [15]. The estimated results for all the samples are shown in Fig. 3, which clearly shows that the average grain size increases gradually as the annealing temperatures increase. Combined the results of Table 1 and Fig. 3, it can be concluded that the grain growth dominates the phase transformation of the nanocrystalline ZrO2 powders.
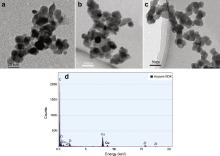
TEM was performed to further determine the morphology and the grain size of these powders. Fig. 4shows the typical TEM images of the Z600, Z800 and Z1200 samples, and nearly all the particles are spherical. The average grain size measured from the TEM images of the Z600, Z800 and Z1200 samples are 12, 18 and 30 nm, respectively. Considering the agglomeration of the particles, the average size of the particles measured from the TEM images for all the samples is in good agreement with the crystalline size estimated by Scherrer formula shown in Fig. 3. The EDX (energy dispersive X-ray spectrometer) result confirms the presence of Zr and O from the samples, and the signals of Cu and C are from TEM grid (Fig. 4(d)).
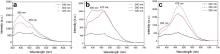
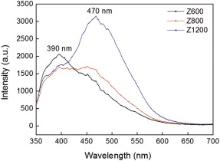
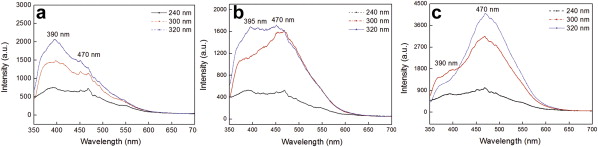
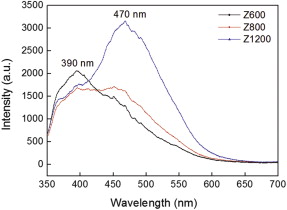
The PL properties of the Z600, Z800 and Z1200 samples were investigated, and the samples were excited by the wavelengths of 240, 300 and 320 nm, respectively (Fig. 5). The emission intensity of the PL emission spectra is enhanced with increasing the excitation wavelength, while no change of the emission position excited with different wavelengths was observed. Fig. 6 shows the comparison of the Z600, Z800 and Z1200 samples excited by the wavelength of 320 nm. It can be seen that all the emission spectra show two main broad peaks centered at around 390 and 470 nm, respectively. The emission intensity of the peak located at 390 nm decreases while that of the peak centered at 470 nm increases as annealing temperature increases. The emission peaks located at 390 and 470 nm are ascribed to the oxygen vacancies emission of t-ZrO2 and m-ZrO2 respectively[22] and [23]. In Fig. 6, the intensity ratio inI390 to I470 is 1.61, 1.04 and 0.56 for the Z600, Z800 and Z1200 samples, respectively, indicating a negative relation between concentration of the t-ZrO2 phase and the annealing temperature. The XRD and PL results of the Z600, Z800 and Z1200 samples reveal that the metastable phase, t-ZrO2 are stable with the smaller grain size, and grain growth leads to the phase transformation from tetragonal to monoclinic phase.
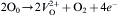
In this work, the sol-gel process may create large amount of surface defects, such as oxygen vacancy/interstitial and Zr vacancy/interstitial in the nanocrystalline ZrO2 powders[25]. The formation of these defects may be described as the following formulas:
equation(8)
2ZrO+hv→ Zr4++O2+4e−
 equation(9)
Zr4++e− → Zr3+
 equation(10)
 where Zr4+ is the defects that posited at irregular near-surface sites; Zr4+ may generate Zr3+ centers by electron capture; O0 is an oxygen atom in regular site; e− is an electron in conduction band, andVO2+ denotes oxygen vacancy. Oxygen vacancy always leads to the formation of new energy levels in the band-gap region. When the nanocrystalline ZrO2 materials are excited with photons, electrons are trapped by the oxygen vacancies and F centers are created [7]. Then the recombination of the Fcenters with holes (h+) creates the excited states of the emitter, and these excited emitters undergo radiative transitions to the ground state. The following relations can be described as the recombination process [22],
equation(11)
VO+e− → F
 equation(12)
F+h+→ VO+hv
 That is the reason why the emission intensity of oxygen vacancies in the nanocrystalline ZrO2 powders prepared in our work is very high.
4. ConclusionNanocrystalline ZrO2 powders were produced by sol-gel method. ZrO2 powders experience a phase transformation from tetragonal to monoclinic when the annealing temperature increases from 500 to 1200 ° C. TEM results show that nearly all the samples are spherical, and the average size of these particles is in good agreement with the values estimated by the Scherrer formula. The PL spectra exhibit two main emission peaks centered at 390 and 470 nm, respectively. The ratio in I390 to I470 decreases with the increase of the annealing temperature, which indicates that phase transformation happens as annealing temperature increases. This work proposes that grain size greatly affects the phase transformation and the photoluminescence of the nanocrystalline ZrO2 powders.
Acknowledgements
The authors have declared that no competing interests exist.


 , Changjing Shao