


Effect of Graphene Nanoplate and Silicon Carbide Nanoparticle Reinforcement on Mechanical and Tribological Properties of Spark Plasma Sintered Magnesium Matrix Composites
[Aniruddha Das, Sandip P. Harimkar*  ]
]
]
|
|


Processing of magnesium (Mg) matrix composites reinforced with low reinforcement content (up to 4-5 vol.%) of graphene nanoplates (GNPs) and silicon carbide (SiC) nanoparticles using ball milling and spark pasma sintering (SPS) is reported. Near full densification was observed for all the composite compositions at the sintering temperature of 450 °C (soaking time of 5 min and applied pressure of 50 MPa). Detailed analysis of the microstructure and mechanical and tribological (under dry sliding contact with alumina counter-face) properties with reinforcement content in Mg-GNP and Mg-SiC is presented. Mg-GNP and Mg-SiC composites reinforced with bout 2 vol.% of reinforcement content exhibited significant improvement in microhardness and wear resistance as compared with Mg compacts.
With increasing importance of light-weight and energy-efficient systems in structural and automotive applications, magnesium (Mg) and its alloys are attracting increasing attention[1], [2], [3], [4], [5] and [6]. Mg is one of the most abundant metals and constitutes about 2.7% by weight of the earth's crust. Mg with its density of 1.74 g/cm3— about two-thirds of the density of aluminum and one-fifth of the density of steel— is the lightest among all the structural materials. However, wider utilization of Mg and its alloys in practical applications, particularly those involving tribological contacts, is severely limited due to their lower strength and wear resistance[7], [8], [9] and [10].
Reinforcing the Mg alloy matrix with large volume fractions of hard/stiff ceramic micro-particles often improves the hardness and wear resistance of the composites. The processing of such ceramic particulate reinforced Mg matrix composites using conventional casting (squeeze and stir casting)[11], [12] and [13], spray forming[14] and [15], and powder metallurgy[16] and [17] has been widely reported. While several different types of reinforcement particles such as TiC[18] and [19], B4C[20] and [21], TiB2[22], Al2O3[23] and [24], Y2O3[25] and [26], and feldspar[27] have been used, the effect of SiC particle reinforcement on mechanical propertied of Mg alloy composites is most widely investigated[28], [29], [30] and [31]. The strengthening in these composites is often attributed to mechanisms such as load transfer from matrix to reinforcement, nucleation of dislocations due to thermal mismatch between reinforcement and matrix, and matrix grain refinement[32]. Orowan strengthening mechanism is not expected to be operative in micro-particle reinforced composites due to large inter-particle spacing[33]. Alahelisten et al. investigated the dry sliding wear behavior of Mg composites reinforced with Al2O3 micro-fibers (3 μ m diameter and 500 μ m length)[34]. The Mg composites exhibited minimum wear rate both in initial and steady-state wear conditions at 10 vol.% of micro-fibers. It was reported that the adhesive wear mechanism is suppressed at this level of reinforcement content. At higher reinforcement content (30 vol.%), the delamination due to sub-surface cracks resulted in severe wear loss. Saravanan and Surappa reported the melt stir processing of Mg matrix composites reinforced with 30 vol.% SiC particles (average particle size of 40 μ m)[28]. The dry sliding wear rate of the composites was reported to be two orders of magnitude less compared to un-reinforced Mg. Detailed analysis of sliding wear behavior of Mg-Al alloy composites reinforced with 8 vol.% SiC particles (particle size of 14 μ m) was reported by Lim et al.[29]. It was reported that the SiC reinforcement results in only marginal decrease in wear rate at lower sliding speeds (1-2 m/s). At higher sliding speed (5 m/s) especially with higher load, the wear rate actually increases for the reinforced composites. The behavior was attributed to transition from oxidative to delamination and abrasive wear with increasing sliding speed under higher load. Jiang et al. also reported processing of TiC reinforced Mg matrix composites by introducing TiC-Al master alloy (processed using self-propagating high-temperature synthesis) in molten magnesium[18]. The sliding wear rate for the composites reinforced with 10 vol.% TiC (particle size of about 5 μ m) reduced to about half of that for unreinforced Mg. Wang et al. also reported powder metallurgy based processing of TiB2 (particle size of about 6 μ m) reinforced Mg composites[22]. Significant improvement in wear resistance was observed for the Mg-TiB2 composites at 10 and 20 vol.% TiB2 particles reinforcement. Clearly, most of the investigations reported general improvement in hardness and wear resistance of micro-particle reinforced Mg composites at high reinforcement content (about 10-30 vol.%).
Recently, nano-fillers such as ceramic nanoparticles[35], [36], [37]and[38], carbon nanotubes (CNTs)[39], [40]and[41], and graphene nanoplates (GNPs)[42] have attracted significant attention for reinforcement in Mg and Al alloys. In addition to conventional strengthening mechanisms, Orowan mechanism is expected to be effective in nano-filler reinforced metal matrix composites, resulting in strengthening even at lower reinforcement content[33]. This is particularly attractive for preserving low density of the alloys while improving strength/hardness and wear resistance in the composites. Lan et al. reported processing of SiC nanoparticle (particle size of 30 nm) reinforced Mg alloy composites using casting assisted by high intensity ultrasonic vibration cavitation[35]. While the nanoparticle distribution was generally uniform in the matrix, some clusters of agglomerated particles were also observed. The microhardness increased by about 75% with the reinforcement of 5 wt% SiC nanoparticles in the composites. Nguyen and Gupta also reported significant improvement in hardness from about 63 HV for AZ31B alloy to about 79 and 82 HV for composites with the reinforcement of 0.66 and 1.11 vol.% Al2O3 nanoparticles (particle size of 50 nm), respectively[36]. The dry sliding wear behavior of pure Mg matrix reinforced with Al2O3 nanoparticles was also investigated by Lim et al.[37]. About 1.8 times increase in wear resistance was reported with the reinforcement of 1.11 vol.% Al2O3 nanoparticles. The dominant material removal mechanisms for nanocomposites were abrasive and adhesive wear mechanisms. The previously reported delamination wear mechanisms were not observed for the Mg-Al2O3 composites. Similar observations have been made by Habibnejad-Korayem et al. with the reinforcement of 100 nm Al2O3 nanoparticle in Mg and AZ31 alloys at 2 wt% reinforcement content[38]. Some efforts have also been made to reinforce CNTs in Mg alloys. Morisada et al. reported friction stir processing of CNT reinforced AZ31 composite surfaces[39]. An increase in hardness from 55 HV for friction stir processed base alloy to about 78 HV for CNT reinforced composite surfaces was attributed to grain refinement and CNT induced strengthening. Goh et al. also reported disintegrated melt deposition of CNT reinforced Mg composites[40]. Only slight increase in hardness (from 45 to 48 HR15T) was observed for reinforcement content of 0.3 wt% CNTs followed by a drop in hardness with further increase in reinforcement content. Due to its excellent mechanical and physical properties of GNPs, efforts have recently been made to process GNP reinforced light alloy composites[42]. Note that the effect of GNP reinforcement on physical and mechanical properties of polymer matrix composites has been widely investigated[43]and[44]. A recent report investigated the effect of 0.1 wt% GNP reinforcement on mechanical properties of Al matrix composites[42]. An increase in hardness from 83 for pure Al to 99 HV for GNP reinforced composites was observed. It was observed that interfacial reactions leading to formation of Al4C3 resulted in degradation of tensile strength of the composites. No such studies are reported for Mg matrix composites most probably due to difficulty in processing of GNP reinforced composites. As the formation of detrimental carbides with Mg is not likely[45], the GNP reinforcement is particularly attractive for improving the hardness and wear resistance of Mg matrix composites.
In this paper, spark plasma sintering (SPS) of Mg composites reinforced with lower reinforcement content (up to 4-5 vol.%) of nano-fillers such as GNPs and SiC nanoparticles is reported. SPS involves sintering of ball milled composite blends under the influence of pulsed direct current and uniaxial pressure[46], [47] and [48]. The unique mechanisms such as Joule heating at the particle contacts and/or sparks at the gaps between particles (not directly observed) result in densification and sintering at relatively lower temperature and shorter sintering time compared to conventional hot pressing[49] and [50]. In most of the cases it is difficult to make direct comparison of obtained tribological results with the literature. While this is sometime expected due to strong dependence of tribological data on the complex parameters of tribosystems, it is important to understand the relative effect of reinforcement type on the tribological properties. In this paper, direct comparison has been made for effect of GNP and SiC nanoparticle reinforcement on the tribological properties of the Mg composites. Detailed analysis of specific wear rate and coefficient of friction (COF) under dry sliding contact with Al2O3 counter-face is presented.
Commercially available Mg powder with purity of 99.8% and an average particle size of 44 μ m (Alfa Aesar, USA) was used for matrix material. Multilayer GNP (5-25 nm in thickness and 5-25 μ m in diameter; American Elements, USA) and SiC nanoparticles (< 80 nm in diameter; US Research Nanomaterials, Inc, USA) were used as reinforcements for the processing of Mg-GNP and Mg-SiC composites, respectively. Pure Mg, Mg-GNP and Mg-SiC composite powders were prepared using a ball mill. The ball milling was performed for 15 min with a speed of 350 r/min and ball-to-powder ratio of 5:1 using tungsten carbide jar and balls. The powder mixtures were then sintered using a commercial SPS unit (Thermal Technology, USA). Graphite dies and punches were used to sinter 20 mm-diameter and 3-4 mm-thick compacts of each composition. The powder was pre-pressed at a pressure of 5 MPa before the application of sintering pressure of 50 MPa. The sintering cycle consisted of heating to a sintering temperature of 450 ° C at a rate of 50 ° C/min, soaking at 450 ° C for 5 min, and cooling at the rate of 50 ° C/min.
Archimedes method was used to measure the density of the sintered compacts. Phase analysis of Mg, Mg-GNP, and Mg-SiC composite compacts was conducted using an X-ray diffractometer (Philips Norelco, USA) operating with Cu Kα radiation (λ = 0.154178 nm). The diffraction angle (2θ ) was varied from 20° to 90° with a step increment of 0.02° /s. Microhardness of Mg, Mg-GNP, and Mg-SiC composites was measured using a Vickers hardness tester (Buehler, USA) with a load of 10 g and holding time of 15 s. At least ten microhardness readings were taken for each sample, and an average value with standard deviation was reported. Compression testing was conducted using a universal testing machine (Instron, USA) with a strain rate of 10− 4 s− 1. The aspect ratio of the compression test samples was maintained at 1 (10 mm diameter and 10 mm thick cylindrical samples) to minimize buckling effect. Dry (un-lubricated) ball-and-disk wear testing was performed using a commercial tribometer (Nanovea, USA). An alumina ball with a diameter of 6 mm was used for counter-face during wear testing. The wear tests were performed with an applied load of 1 N and sliding velocity of 150 r/min, and the diameter of the wear tracks was maintained at 4 mm. For each wear test, the wear weight loss was measured after 10 min intervals for total test duration of 1 h. At least three wear tests were performed, and specific wear rates were reported. Coefficient of friction (COF) during wear tests was also recorded for each test. The surface profile of the wear tracks was analyzed using a non-contact 3-D surface profilometer (Nanovea, USA). The fracture and worn surfaces of the compacts were analyzed using a scanning electron microscope (FEI, USA).
The X-ray diffraction (XRD) patterns from the spark plasma sintered Mg and Mg-GNP composites are presented in Fig. 1(a). Most of the peaks corresponding to Mg were identified in these XRD patterns. For all the Mg-GNP composites, a characteristic peak of GNPs at diffraction angle of 2θ = 26.5° was observed. No other peaks except those of Mg and GNPs
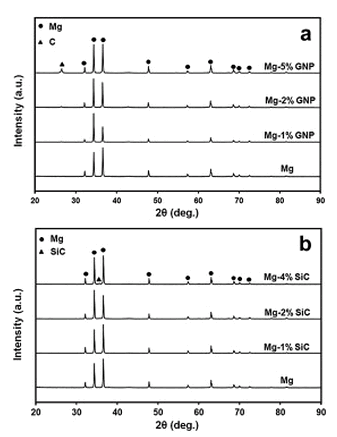 | Fig. 1 XRD patterns of: (a) Mg-GNP, (b) Mg-SiC composites. XRD pattern of pure Mg compacts is also shown for comparison. |
were observed in the XRD patterns of Mg-GNP composites. In the case of Al-GNP composites, several studies have reported formation of aluminum carbide (Al4C3) at the high surface energy prismatic planes of carbon exposed by defects [42]. Such carbides lower the strength of the composites. While carbides such as MgC2 and Mg2C3 are known in Mg-C system [51] and [52], the formation of such metal carbides for Mg-GNP composites is not known or reported, indicating better potential of GNPs in strengthening Mg-based composites. The XRD patterns from SPS sintered Mg-SiC composites are also shown in Fig. 1(b). The characteristic peaks of SiC were not observed for the Mg-SiC composites reinforced with very low volume fractions of SiC nanoparticles (1 and 2 vol.% SiC). The SiC peaks seem to emerge at higher volume fraction of SiC nanoparticles in composites (Mg-4 vol.% SiC). It has been observed that native oxide layers on SiC particles react with Mg matrix to form Mg2Si phase at the interfaces [31]. Such reactions weaken the interfaces and embrittle the composites. Most of these observations were made for composites reinforced with micrometer-scale SiC particles processed using solid state and liquid metal processing methods [53]. The formation of such embrittling phases is not readily apparent from the XRD patterns of all the Mg-SiC composites.
The theoretical density (based on the rule of mixture) and measured density of the spark plasma sintered Mg-GNP and Mg-SiC compacts are listed in Table 1. For pure Mg compact by SPS at 450 ° C, near full densification with relative density of 97.58% was observed. In one of the previous investigations, almost full densification with relative density greater than 99% was achieved for spark plasma sintered Mg compacts (starting particle size of 180 μ m) at sintering temperature of 525 ° C and uniaxial pressure of 60 MPa[54]. In our investigation, we used finer particles with average particle size of 44 μ m. The Mg powder was also ball milled for 15 min before SPS. We observed near full densification for Mg at much lower temperature and pressure (sintering temperature of 450 ° C and uniaxial pressure of 50 MPa). The finer particle size and further ball milling increases the surface area for diffusion and favors densification during sintering. The ball milling also activates the surfaces by breaking any contamination layers or creating surface defects, favoring densification at relatively lower temperatures. For the similar SPS parameters, relatively higher relative density was observed for Mg-GNP and Mg-SiC composite compacts. Not much variation in the relative density was observed with increasing content of GNP reinforcement, and the relative density remained close to 99%-100% for all the composite compacts. While near full densification was also observed for Mg-SiC composites, slight decrease in relative density was observed at higher SiC reinforcement content (Mg-4 vol.% SiC). This decrease in relative density for higher SiC is likely to be due to agglomeration of SiC nanoparticles in the sintered Mg-SiC composite compacts.
| Table 1 Density, hardness, and compressive strength of Mg, Mg-GNP, and Mg-SiC composites |
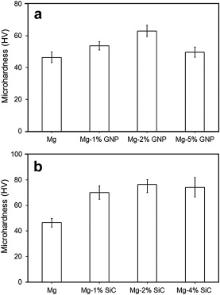
Average microhardness of spark plasma sintered pure Mg compacts was about 46 HV. The Mg-GNP composites exhibited relatively higher microhardness than pure Mg compacts (Fig. 2(a)). The microhardness of the Mg-GNP composites increased with increasing reinforcement content up to 2 vol.% GNP followed by a decrease in hardness for 5 vol.% GNP. The Mg-GNP composites reinforced with 2 vol.% GNP exhibited the highest hardness in the set of Mg-GNP composites. The hardness for this composition (Mg-2 vol.% GNP) was of about 63 HV, which is about 37% greater than that for unreinforced Mg. The decrease in hardness for higher volume fraction of GNP (5 vol.%) is likely to be due to agglomeration of GNP in the Mg-GNP composites. Compared to Mg-GNP composites, the Mg-SiC composites showed much more marked improvement in microhardness (Fig. 2(b)). The hardness of the Mg-SiC composites increased to 70 and 76 HV with SiC reinforcement of 1 and 2 vol.%, respectively. The increase in hardness is about 65% for Mg-SiC composites reinforced with 2 vol.% SiC as compared to that of unreinforced Mg.
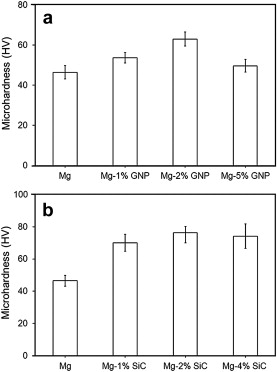 | Fig. 2 Micro-hardness of: (a) Mg-GNP, (b) Mg-SiC composites. Micro-hardness data for pure Mg compacts is also shown for comparison. |
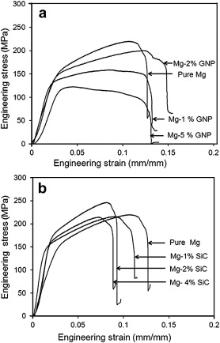
The representative compressive stress-strain curves of Mg and Mg-GNP composites are presented inFig. 3(a). Then ultimate (peak) compressive strength for pure Mg compacts was about 220 MPa. In general, all the Mg-GNP composites exhibited lower ultimate compressive strength than the Mg compacts. While the strength levels decreased for Mg-GNP composites reinforced with 1 and 5 vol.% GNP, the total strain to failure remained comparable (∼13%). For the Mg-GNP composites reinforced with 2 vol.% GNPs, the decrease in strength was also associated with marginal increase in total strain to failure compared to Mg compacts. The ultimate compressive strength and total strain to failure for Mg-2 vol.% GNP composites were about 201 MPa and 15%, respectively. The Mg-5 vol.% GNP composites exhibited the lowest strength (123 MPa) in the set.
 | Fig. 3 Compressive stress-strain curves for: (a) Mg-GNP, (b) Mg-SiC composites. The stress-strain curves for pure Mg compacts are also shown for comparison. |
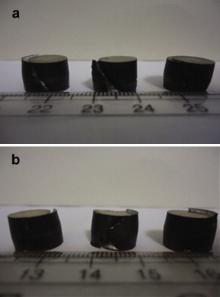
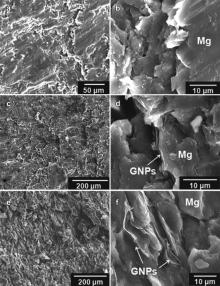
The representative compressive stress-strain curves for Mg-SiC composites are presented in Fig. 3(b). For Mg-SiC composite reinforced with 2 vol.% SiC, marginal increase in ultimate compressive strength along with significant decrease in fracture strain was observed. The ultimate compressive strength and total strain to failure for Mg-2 vol.% SiC were 247 MPa and 9.1%, respectively. For other compositions of Mg-SiC composites (1 and 4 vol.% SiC), the fracture strain was significantly decreased without much change in the peak strength levels compared to Mg compacts. Clearly, the strengthening due to nano-scale reinforcements, particularly GNPs, observed from microhardness analysis was not apparent in the compression testing data. The macro-mechanical testing data such as compression strength is very sensitive to the processing and microstructural defects in the samples. It has been widely reported that the nano-scale reinforcement improves the nano- and micro-scale properties, but sometimes results in degradation of macro-scale mechanical properties. Similar observations have been made by Bartolucci et al. for GNP-reinforced Al matrix composites[42]. They observed that micro-hardness increases from 83 HV for pure Al to about 99 HV for Al-GNP composites reinforced with 0.1 wt% GNPs. However, the Al-GNP composites exhibited 18% lower tensile strength as compared to Al samples. In their study, the degradation of strength of the Al-GNP composites was attributed to the formation of Al4C3 during hot pressing. The formation of the carbides was detected by XRD analysis in their investigations. In the present study, the formation of any undesirable phases was not detected by XRD analysis. It is one of the attractive features of the SPS process that no or very little carbides or undesirable phases are formed due to rapid sintering. The degradation of the compressive strength with the GNP and SiC reinforcement in the Mg-composites in the present study is likely to be due to the SPS and microstructural defects. Fig. 4 shows the pictures of Mg, Mg-GNP, and Mg-SiC samples failed in compression testing. Almost all the samples showed some extent of barreling before splitting into two parts. The shear plane or the fracture surface was inclined at about 45° to the loading axis. Fig. 5 shows the SEM micrographs from the fractured surfaces of pure Mg and Mg-GNP composites. The fracture surfaces of the Mg-GNP composites were relatively rougher than those of pure Mg samples. The fracture surface of pure Mg showed shear marks (from lower left corner to upper right corner inFig. 5(a)) and also the microvoids (likely at the sites of porosity in the sample). For the Mg-GNP composites reinforced at lower volume fraction of GNPs (2 vol.%), both microcracks and microvoids were observed on the fracture surfaces (Fig. 5(c and d)). At higher volume fraction of GNPs (5 vol.%), the clusters of agglomerated GNPs were clearly visible on the fracture surfaces (Fig. 5(e and f)). The fracture surfaces of Mg-SiC composites also exhibited features such as microvoids and agglomeration of SiC nanoparticles (Fig. 6). Clearly, the presence of microvoids and agglomeration of nano-scale reinforcements (GNPs and SiC) seem to have weakened the composite samples, causing premature fracture in compressive loading.
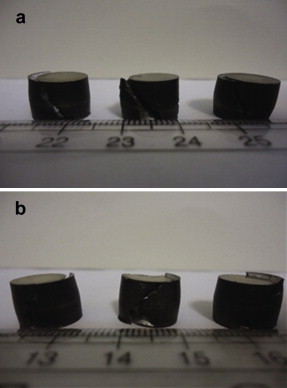 | Fig. 4 Compression failed compacts of: (a) Mg-GNP, (b) Mg-SiC composites. |
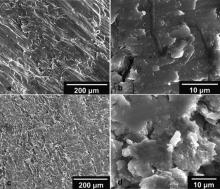
 | Fig. 5 SEM images of fractured surfaces of: (a, b) pure Mg, (c, d) Mg-2 vol.% GNP, (e, f) Mg-5 vol.% GNP. |
 | Fig. 6 SEM images of fractured surfaces of: (a, b) Mg-2 vol.% SiC, (c, d) Mg-4 vol.% SiC. |
For Mg-GNP samples, the decrease in strength was not associated with significant increase in ductility as indicated by results on total strain for failure. While the strength remained essentially at the same level, the total strain to failure decreased significantly with the reinforcement of SiC in the composites. Mg has limited ductility at low temperature due to its hexagonal closed packed structure and limited basal plane slip. It has been observed that the reinforcement of fillers often increases the ductility of the Mg composites due to activation of non-basal slip systems[33]. In the present work, except for reinforcement level of 2 vol.% GNP, the strength degradation of the Mg-GNP composites was not associated with significant change in ductility. The ductility actually decreased in Mg-SiC composites. Note that all the mechanical testing data available in literature is for cast and/or hot extruded samples. The grain size and crystallographic texture are significantly affected by the processing route used for fabrication of Mg composites[55]. While the XRD analysis shows some changes in peak intensity of major Mg peaks with addition of reinforcement, detailed pole figure analysis is needed to characterize the role of crystallographic texture in mechanical behavior.
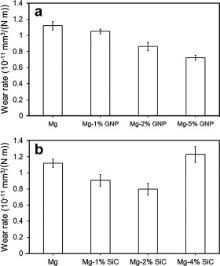
The wear rate data for Mg and Mg-GNP compacts against alumina counter-body ball is presented in Fig. 7. The wear rate decreases continuously with increasing GNP content. Except for the Mg-GNP composite reinforced with 5 vol.% GNP, this trend is consistent with the increase in microhardness observed for these composites. Fig. 8 shows the surface profiles of the wear tracks for Mg and Mg-GNP composites. The depth and width of wear track were about 25 μ m and 2.5 mm, respectively, for pure Mg compacts. The wear track for Mg also showed significant (∼10-15 μ m) material pile-up due to plastic deformation at the edges of the track. The depth and wear track decreased with increasing GNP reinforcement content. For Mg-GNP composites reinforced with 5 vol.% GNPs, the depth and width of wear track were about 15 μ m and 1 mm, respectively. The material pileup at the edges of the wear track was about 5 μ m. The trend is consistent with the variation of wear rate with reinforcement content, suggesting improvement in wear resistance with the reinforcement of GNPs in Mg composites. For all the samples, the surface profiles indicate that the wear tracks were relatively rough.
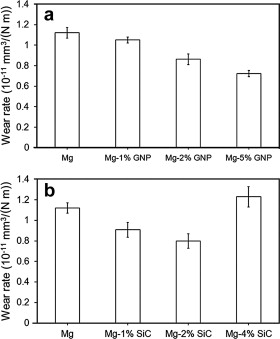 | Fig. 7 Specific wear rates for: (a) Mg-GNP, (b) Mg-SiC composites. The wear rate for pure Mg compacts is also presented for comparison. |
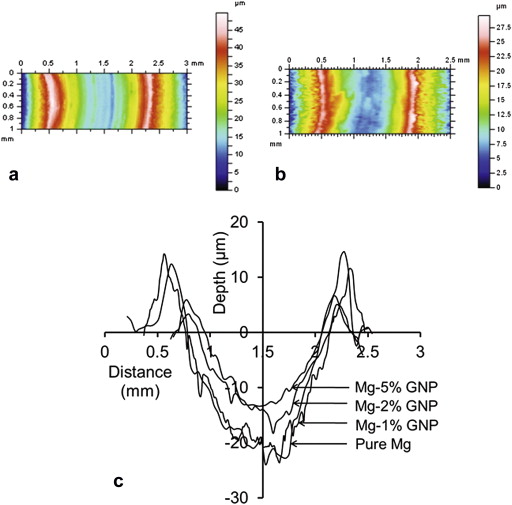 | Fig. 8 3-D surface profiles of wear tracks for: (a) pure Mg, and (b) Mg-5 vol.% GNP; (c) comparison of 2-D surface profiles across the wear tracks for pure Mg and Mg-GNP composites. |
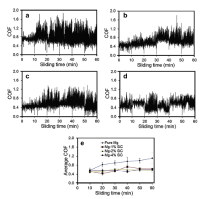
shows coefficient of friction traces for Mg and Mg-GNP compacts. The coefficient of friction was recorded for all 10 min intervals of the wear tests. For Mg samples, the coefficient of friction increases rapidly to a very high value in each interval. After the first interval, the coefficient of friction data shows significant scatter. The rise of coefficient of friction is relatively slower, particularly in first few intervals, for Mg-GNP composites. The average coefficient of friction for different time intervals for Mg and Mg-GNP composites is also plotted in Fig. 9(c). In general, the coefficient of friction increases with increasing sliding time for all the samples. The average coefficient of friction is about 0.5-0.7 in the first 10 min interval and increases to about 0.7-1.1 in the last 10 min interval of the wear tests. Also, there was no much difference in the variation of coefficient of friction for Mg and Mg-GNP (1 vol.% GNPs) samples, and both the compositions exhibited similar values of coefficient of friction. The Mg-GNP samples reinforced with 2 and 5 vol.% GNPs exhibited relatively lower coefficient of friction for most of the test intervals compared to pure Mg compacts. The coefficient of friction remained close to 0.5-0.7 for Mg-GNP composites reinforced with 5 vol.% GNPs.
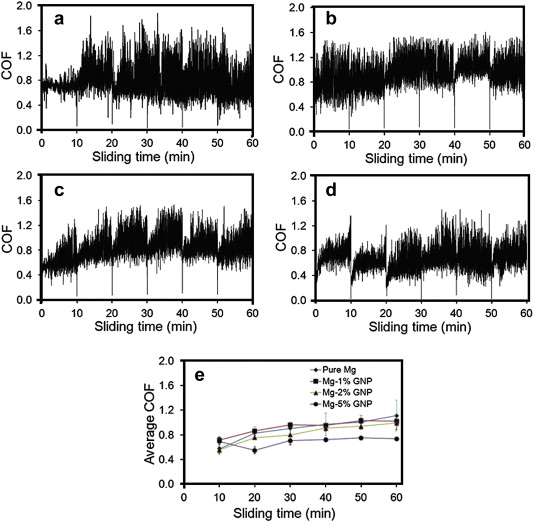 | Fig. 9 Coefficient of friction for: (a) pure Mg, (b) Mg-1 vol.% GNP, (c) Mg-2 vol.% GNP, and (d) Mg-5 vol.% GNP; (e) average coefficient of friction for Mg and Mg-GNP composites. |
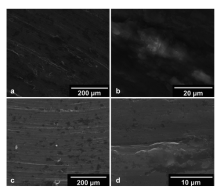
The SEM images from the worn surfaces of Mg and Mg-GNP composites are shown in Fig. 10. The worn surface of pure Mg compacts shows typical abrasive scratches with deformed regions covered with wear debris (Fig. 10(a and b)). Micro-cracks in the deformed regions are also visible in the SEM images. While abrasive wear is expected in the case of sliding of hard counter-body against soft metallic substrates such as Mg, it is often associated with oxidative wear[56]. As the activation energy of Mg oxidation is very low, Mg tends to oxidize due to frictional heat (2Mg + O2 → 2MgO). The magnesium oxide (MgO) further reacts with moisture to form magnesium hydroxide (MgO + H2O → Mg(OH2))[56]. The surface oxides are likely to cause wear of aluminum oxide counter-face, forming oxide debris on the surface. The worn surfaces of Mg-GNP composites are relatively smoother than the worn surface of pure Mg compacts. Note that the Mg-GNP compacts have higher relative density than the Mg compacts. The deformation and material removal under sliding contact is likely to initiate at the pores in the Mg compacts. The Mg-GNP composite reinforced with 2 vol.% GNPs shows clear grooves parallel to sliding direction, indicative of abrasive wear mechanisms. The asperities on the hard alumina counter-face plough or cut the surface material, creating wear debris. The deformed regions/patches and wear debris can also be seen on the worn surfaces (Fig. 10(c)). For the Mg-GNP composites reinforced with higher volume fraction of GNP reinforcement (5 vol.% GNPs), the wear surfaces are covered with GNPs (Fig. 10(d)). While most of the exposed GNPs seem to have been pulled out of the Mg matrix, some nanoplates are released on the surface and are seen covering the wear debris. It has been reported that GNPs are effective in reducing friction and wear on sliding surfaces of steel. Berman et al. reported that coefficient of friction for sliding steel surfaces reduces from 0.91 (without lubrication) to about 0.15 with the supply of 2-3 drops of solution processed graphene every 400 cycles[57]. The concentration of graphene in ethanol solution was 1 mg/L. The supply of solution processed graphene also resulted in orders of magnitude reduction in wear rate. It was observed that the presence of GNPs suppresses the tribo-corrosion (reduced wear) and also provides easy shearing (reduced friction). While general reduction in wear rate and coefficient of friction was observed for the Mg-GNP composites, the reinforcement of GNPs in the metal matrix is not as effective as the direct delivery of graphene at the sliding surfaces.
 | Fig. 10 SEM micrographs from worn surfaces of: (a, b) pure Mg, (c) Mg-2 vol.% GNP, and (d) Mg-5 vol.% GNP composites. |
Specific wear rates for Mg and Mg-SiC composites are plotted in Fig. 7(b). The reinforcement of SiC nanoparticles at lower content (1 and 2 vol.%) resulted in a decrease in wear rate. The Mg-SiC composite reinforced with 2 vol.% SiC exhibited the best wear resistance among these composites. The wear rate increased with further increase in reinforcement with SiC. The wear rate for Mg-SiC composites reinforced with 4 vol.% SiC was higher than that of pure Mg compacts. The surface profiles of the wear tracks for these composites are also shown in Fig. 11. The Mg-SiC composites reinforced with 4 vol.% SiC exhibited the highest wear depth (∼25 μ m) and width (2-2.5 mm). The depth and width of wear track for Mg-SiC composite reinforced with 2 vol.% SiC were about 10 μ m and 1.5 mm, respectively. The Mg-SiC composites reinforced with 1 and 2 vol.% SiC also significantly reduced pile-up of material at the edges of wear tracks. The trend of variation of wear depth and width is consistent with the variation of wear rate with the SiC reinforcement content. Clearly, the reinforcement of SiC nanoparticles at lower reinforcement level (1-2 vol.%) resulted in improvement in wear resistance. SiC has very high hardness (∼2840-3240 HV), and its reinforcement in softer materials such as Mg increases the hardness of the composite. The Mg-SiC composites (1-2 vol.% SiC) exhibited higher micro-hardness compared to pure Mg (Fig. 2(b)). The improved wear resistance of these composites is consistent with the Archard's law that states that wear volume loss is inversely proportional to the hardness of the material being worn away. Despite the relatively higher hardness of the Mg-SiC composites reinforced with 4 vol.% SiC nanoparticles, these composites exhibited lower wear resistance than Mg compacts. This is likely to be due to the transition of wear mechanisms at higher content of SiC reinforcement.
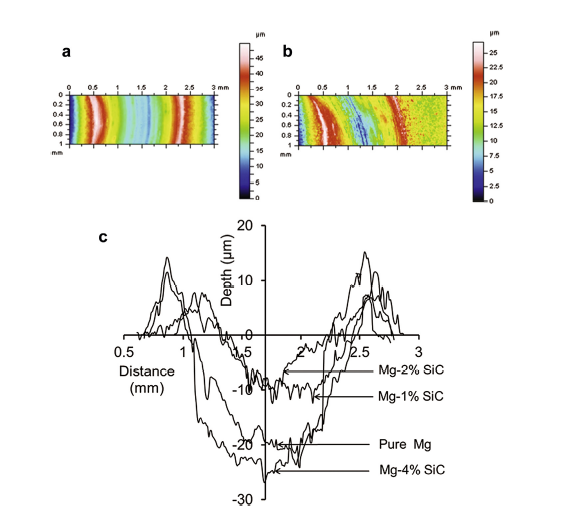 | Fig. 11 3-D surface profiles of wear tracks for: (a) pure Mg, and (b) Mg-2 vol.% SiC; (c) comparison of 2-D surface profiles across the wear tracks for pure Mg and Mg-SiC composites. |
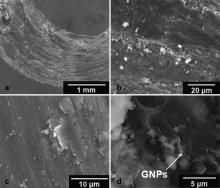
The representative coefficient of friction trace for Mg-SiC composite reinforced with 2 vol.% SiC is shown inFig. 12. The coefficient of friction data for all the intervals for Mg-SiC composites is also presented in the figure. All the Mg-SiC composites exhibited lower coefficient of friction compared to pure Mg compacts. The coefficient of friction remained close to 0.4-0.6 for the composite samples. These values are much lower than that reported for Mg-GNP composites. Fig. 13 shows the SEM micrographs of the wear surfaces of the Mg-SiC composites. The wear surfaces clearly show the abrasive grooves with micro-cutting at the deformed regions. The worn surfaces are also covered with darker regions, indicating of oxidative wear mechanisms. For Mg-SiC composites reinforced with 2 vol.% SiC, significant micro-cracking of the deformed splats was observed. At higher reinforcement content (4 vol.% SiC), clear micro-cracking and debonding of the nanoparticle agglomerates were observed. Also, deep grooves, likely due to abrasive action of debonded SiC nanoparticles, were observed on the worn surfaces. This is likely the reason for higher wear loss in this composite composition. It has also been reported that SiC forms hydrated silica under friction and moisture (2SiC + 3O2 → 2SiO2 + 2CO; SiO2 + 2H2O → Si(OH)4)[56]. The hydrated silica further reacts with hydrated magnesia to form dense hydrous magnesium silicate (DHMS) tribolayer. The reduction of coefficient of friction for Mg-SiC composites is likely due to formation of such tribolayer. In a previous report on the reinforcement of SiC micro-particle (25 μ m) in Mg, beneficial effect of SiC on wear resistance was observed only at a very high reinforcement level (26.3 wt% SiC)[56]. Significant degradation of wear resistance was observed for Mg-SiC (9.8 wt% SiC) composites as compared to pure Mg. The results in this study suggest that wear resistance improves at very low reinforcement contents (1-2 vol.%) of SiC nanoparticles. However, it is difficult to disperse the SiC nanoparticles in the Mg matrix at and beyond about 4 vol.%, resulting in degradation of wear resistance.
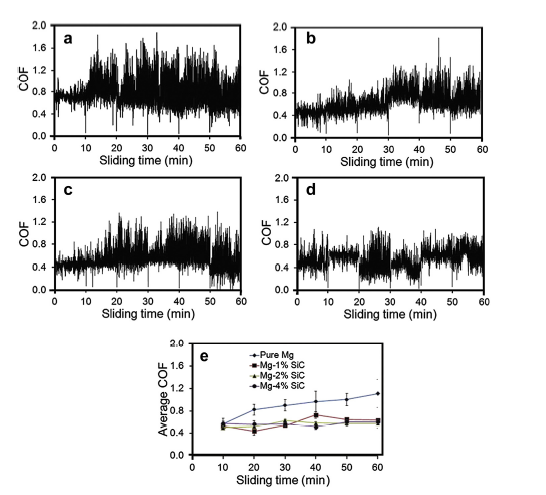 | Fig. 12 Coefficient of friction for: (a) pure Mg, (b) Mg-1 vol.% SiC, (c) Mg-2 vol.% SiC, and (d) Mg-4 vol.% SiC; (e) average coefficient of friction for Mg and Mg-SiC composites. |
 | Fig. 13 SEM micrographs from worn surfaces of: (a, b) Mg-2 vol.% SiC, and (c, d) Mg-4 vol.% SiC composites. |
Dense magnesium matrix composites reinforced with low content (1-5 vol.%) of GNPs and SiC nanoparticles have been successfully processed by ball milling and SPS. Near full densification was observed for all the composite compositions at sintering temperature of 450 ° C (soaking time of 5 min and applied pressure of 50 MPa). Mg-GNP and Mg-SiC composites exhibited higher microhardness than pure Mg compacts. The microhardness increased by about 37% and 65% with the reinforcement of 2 vol.% GNPs and SiC, respectively. Further increase in reinforcement content (> 2 vol.% GNPs and SiC) resulted in decrease in microhardness most likely due to agglomeration of nano-scale fillers. The micro-scale strengthening effect as observed from hardness improvement was not readily observed in bulk compressive testing. Except for Mg-2 vol.% SiC, all the composite compositions exhibited lower compressive strength than pure Mg compacts. Consistent with the microhardness improvements, marked improvements in wear resistance against alumina counter-face was observed with the reinforcement of GNPs and SiC in the composites. The wear rate decreased by about 23% and 28% with the reinforcement of 2 vol.% GNPs and SiC, respectively. It has been observed that the higher limit on the nano-filler reinforcement content, which results in the best improvement in microhardness and wear resistance, is about 2 vol.% for the reported powder metallurgy based processing approach. Agglomeration of nano-fillers at higher reinforcement content results in degradation of hardness and wear resistance of the composites.
The authors have declared that no competing interests exist.
| [1] |
|
| [2] |
|
| [3] |
|
| [4] |
|
| [5] |
|
| [6] |
|
| [7] |
|
| [8] |
|
| [9] |
|
| [10] |
|
| [11] |
|
| [12] |
|
| [13] |
|
| [14] |
|
| [15] |
|
| [16] |
|
| [17] |
|
| [18] |
|
| [19] |
|
| [20] |
|
| [21] |
|
| [22] |
|
| [23] |
|
| [24] |
|
| [25] |
|
| [26] |
|
| [27] |
|
| [28] |
|
| [29] |
|
| [30] |
|
| [31] |
|
| [32] |
|
| [33] |
|
| [34] |
|
| [35] |
|
| [36] |
|
| [37] |
|
| [38] |
|
| [39] |
|
| [40] |
|
| [41] |
|
| [42] |
|
| [43] |
|
| [44] |
|
| [45] |
|
| [46] |
|
| [47] |
|
| [48] |
|
| [49] |
|
| [50] |
|
| [51] |
|
| [52] |
|
| [53] |
|
| [54] |
|
| [55] |
|
| [56] |
|
| [57] |
|