Synthesis, Surface Characterization and Photocatalytic Activity of TiO2 Supported on Almond Shell Activated Carbon
[A. Omri1, *  , S.D. Lambert
2 , J. Geens2 , F. Bennour3 , M. Benzina1 ]
, S.D. Lambert|
|


Three types of photocatalysts were synthesized by metal organic chemical vapor deposition and impregnation methods using the almond shell activated carbon as support. These photocatalysts denoted by (TiO2/ASAC (V), TiO2/ASAC (I1) and TiO2/ASAC (I2)) were characterized by scanning electron microscopy (SEM), X-ray diffraction (XRD), Fourier transform infrared spectroscopy (FTIR), diffuse reflectance spectroscopy (DRS) and nitrogen adsorption-desorption isotherms. SEM observation shows that TiO2 was deposited on activated carbon surface. XRD results confirm that TiO2 existed in a mixture of anatase and rutile phases. The DRS spectra show the characteristic absorption edge of TiO2 at approximate 380 nm corresponding to the optical band gap of 3.26 eV. Besides, FTIR spectrum indicated the presence of (Ti-O) groups. The specific surface area of photocatalysts decreased drastically in comparison with the original activated carbon. The catalysts were very efficient for the photodegradation of total organic carbon (TOC) from industrial phosphoric acid solution under UV irradiation. The kinetics of photocatalytic TOC degradation was found to follow a pseudo-first-order model. The prepared TiO2/ASAC showed high photoactivity for the photodegradation of TOC in the following order: TiO2/ASAC (V) > TiO2/ASAC (I1) > TiO2/ASAC (I2) > ASAC > TiO2 (P25).
Activated carbon is used mostly for adsorption in industry because of its large adsorption capacity, fast adsorption kinetics and relative ease of regeneration[ 1], [ 2], [ 3], [ 4],[ 5]. Activated carbons are commonly prepared from coal, wood[ 6],[ 7], peat and coconut shells[ 8]. However, the demand for novel and more efficient adsorbents initiated research for low-cost, locally available and renewable materials as potential alternative precursors in activated carbon production. For this purpose, many materials such as fruit stones[ 9], pyrolyzed coffee residues[ 10], date stones[ 11], pomace ashes[ 12], and rice husks[ 13] were studied.
Photocatalysis is an important industrial process in wastewater treatment, heavy metal remediation, air purification, sterilization, etc. Titanium dioxide (TiO2) is the most widely used photocatalyst owing to its efficiency, low-cost and chemical stability[ 14]. TiO2 powders such as DEGUSSA P25 have been commercially available for several years. Nevertheless, after degradation tests, photocatalysts in the form of powders must be removed from the suspension and this step is an important factor that may cause some problems in industrial applications[ 15], [ 16],[ 17]. To solve these problems, photocatalysts (e.g. TiO2) have been immobilized on various supports such as silica[ 18],[ 19], silicon carbide[ 20], clay[ 21], fly ash[ 22], zeolites[ 23] and activated carbon[ 24], [ 25], [ 26],[ 27].
The advantages of using the activated carbon as a support, are summarized as follows. (1) The support adsorbs a high amount of pollutants around the loaded TiO2. Then the rate of photooxidation is improved[ 28],[ 29]. (2) The adsorbed pollutants (organic substances) are oxidized at the surface of the photocatalyst, and resulting intermediates are also adsorbed and then further oxidized. Toxic intermediates, if formed, are not released in the air atmosphere and/or in solution phase, thus preventing secondary pollution. (3) Since the pollutants are finally oxidized into CO2, the lifetime of the hybrid photocatalysts is long[ 30]. Presently, several preparation methods for TiO2/activated carbon composites, such as hydrothermal[ 31], sol-gel[ 30], boil deposition[ 32], dip coating[ 33], metal organic chemical vapor deposition (MOCVD)[ 34], and impregnation[ 35] have been reported. Although TiO2/activated carbon has been extensively used for the degradation of pollutants, such as phenol[ 36], substituted phenol and dyes[ 30],[ 37], there is no available literature for the photodegradation of organic moieties from Tunisian industrial phosphoric acid by TiO2 supported on activated carbon.
The phosphoric acid is manufactured using different processes, among which the thermal and wet-processes are the most commonly used. Concerning the wet-process, it is used in Tunisia to produce phosphoric acid from phosphate minerals[ 38]. However, this process leads to an acid with a high impurities level, including organic pollutants[ 3], [ 4],[ 39] which are n-dibutyl phthalate, humic and fulvic acids[ 40],[ 41]. Hence, the removal of these organic pollutants seems to be an important step for the production of phosphoric acid with a high purity level.
The purpose of the present work is to load TiO2 on the surface of active carbon by using two techniques (MOCVD and impregnation). Both techniques are compared in terms of textural and structural properties as well as the amount of loaded TiO2 in anatase form. In this aim, three photocatalysts were prepared by the deposition of TiO2 on the surface of almond shell activated carbon. These photocatalysts were employed not only for the adsorption of total organic carbon (TOC) from industrial phosphoric acid solution, but also for determining their catalytic efficiency for industrial applicability.
Activated carbon (ASAC) was prepared from the physical activation of almond shell, which was obtained from a local company in Sfax (Tunisia). Ammoxidation process was used to modify the activated carbon surface using a method described previously[ 4]. The textural properties of the material are listed in Table 1.
| Table 1. Textural and structural properties of the samples |
Titanium isopropoxide (Ti (OPri)4, TTIP, Sigma-Aldrichs, purity: 97%) and commercial TiO2 (Degussa P25, Degussa Chemical) were used as titanium source for the preparation of photocatalysts. Industrial phosphoric acid solution (54% P2O5) produced by the SIAPE society was used to evaluate the photocatalytic efficiency of synthesized photocatalysts. This phosphoric acid contains (578 ± 5) × 10-6 of TOC. The details of this industrial product are found in a previous research study[ 4].
2.2.1. MOCVD method
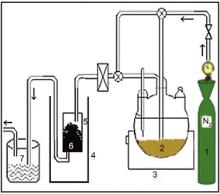
To prepare the TiO2/ASAC photocatalyst by the MOCVD method, the apparatus presented in Fig. 1 was used. A fixed amount (4.0 g) of ASAC (particle size < 63 μm) was put into a quartz reactor, and dehydrated under a stream of dry nitrogen at 400 °C for 3 h. Then, the temperature of the reactor was adjusted to 600 °C. After the reactor temperature was stabilized, the deposition of TiO2 was initiated by evaporating TTIP contained in a flask at 100 °C under a nitrogen flow rate of 200 mL/min for 5 h. The gas line was heated to avoid the TTIP condensation. At the end of the deposition, the reactor was purged by nitrogen gas for about 15 min. The resulting deposit was removed from the reactor and kept in a hermetic bottle for subsequent use.
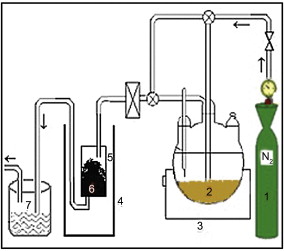 | Fig. 1. Schematic diagram of the experimental setup: (1) nitrogen gas cylinder; (2) TTIP; (3) flask heater; (4) furnace; (5) quartz tube; (6) ASAC; (7) cold trap. |
The photocatalyst prepared by this method, was named TiO2/ASAC (V), with the letter (V) indicating the vapor phase.
2.2.2. Impregnation method
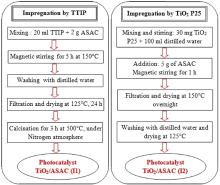
Two TiO2/ASAC photocatalysts were prepared by the impregnation method. First, different weights of ASAC were added under stirring into a TTIP solution or a TiO2 P25 aqueous suspension. When TTIP was used, the temperature of the mixing was fixed to 150 °C. After the impregnation process, the samples were filtered and dried for different times. The first series was calcined to 500 °C for 3 h in a nitrogen purged reactor tube in the furnace with a heating rate of 5 °C/min. The steps of the photocatalysts preparation were presented in Fig. 2.
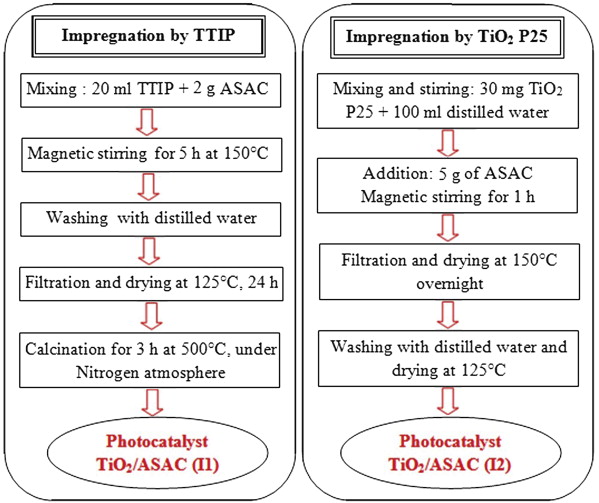 | Fig. 2. Scheme of the preparation method of TiO2/ASAC photocatalysts by the impregnation method. |
The synthesized photocatalysts are named TiO2/ASAC (I1) and TiO2/ASAC (I2), where I1 and I2 indicate the impregnation by TTIP and TiO2 P25, respectively.
Several techniques were employed for the characterization of the samples. In order to determine the crystal phase composition and the TiO2 crystallite size in the photocatalysts, X-ray diffraction measurements were carried out at room temperature using an X-ray diffractometer (Philips® PW 1710 diffractometer, Cu Kα, 40 kV/40 mA, scanning rate of 2 degree per min). The crystallite size was calculated by X-ray line broadening analysis using Scherrer equation[ 42].
The micrographs of TiO2/ASAC and original ASAC samples were examined under a scanning electron microscope (SEM, Hitachi SU-70). The structural feature of these samples was observed at the accelerated voltage of 1.0 kV. Before observation, the samples were coated with gold in E-1010 Ion sputter. Energy dispersive X-ray analysis (EDX) was employed for the quantitative determination of TiO2 contained in the carbon matrix. This was determined using Hitachi SU-70, SEM equipped with a microanalysis system EDX (Oxford X-Max 50 mm2).
Nitrogen adsorption-desorption isotherms were measured at -196 °C on a Fisons Sorptomatic 1990 after outgassing (10-5 Pa) for 24 h at ambient temperature. The specific surface area, SBET, was determined according to the Brunauer-Emmet-Teller (BET) method at the relative pressure, p/ p0, in the range of 0.05-0.30.
The porosity degree of the photocatalysts was measured by pycnometry. In order to determine the real density ( ρs), water was chosen since it can penetrate in pores[ 43]. Whereas, for the apparent density ( ρp), mercury was chosen since it does not penetrate in the porous network. The porosity ( χ) can be calculated by the following equation:
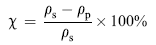 | (1) |
The surface functional groups were studied by FTIR spectroscopy. The FTIR spectra of the prepared materials were recorded between 500 and 4000 cm-1 in a NICOET spectrometer. The transmission spectra of the samples were recorded using the KBr pallet containing 0.1% of the sample.
A diffuse reflectance accessory attached to the Varian cary 100 UV-Visible spectrophotometer was used to record the reflectance spectra to determine the optical band gap of the photocatalysts.
Adsorption experiments were performed by adding in erlenmeyers flask, 0.6 g of ASAC or TiO2/ASAC photocatalysts with 100 mL of the industrial phosphoric acid solution (initial total organic compounds concentration, TOC0 = 578 × 10-6). The solution was stirred under 400 r/min at 45 °C and a very acidic pH value. After the desired contact time, ASAC or TiO2/ASAC samples were recuperated by filtration on a nylon membrane (0.45 mm in pore size, 25 mm in diameter). The filtrate acid was analyzed by using a Shimadzu TOC-5050 apparatus for the determination of the residual TOCr.
The adsorption percentage of TOC by ASAC and TiO2/ASAC samples was calculated as follows:
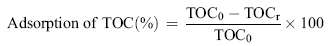 | (2) |
where TOC0 and TOCr are the concentrations of initial and residual total organic carbon, respectively.
Photodegradation of TOC from industrial phosphoric acid was conducted in a laboratory-scale photoreactor. It is a cylindrical photoreactor (diameter = 8 cm, height = 12 cm), operating in a closed recirculating circuit driven by a centrifugal pump and with a stirred reservoir tank equipped with a device for the samples withdrawal. Illumination was carried out using a lamp (11 W low-pressure mercury lamp, Philips, Holland) with wavelengths ≤ 254 nm. The photocatalyst (1.2 g) was mixed in 200 mL of an industrial phosphoric acid solution at different temperatures (25-45 °C). Before irradiation, the suspensions were stirred under dark conditions for 30 min. During the photocatalytic tests, the shaking of the suspensions was controlled to ensure the homogeneity of the suspension. At given time intervals, about 4 mL of aliquots were sampled, and separated by filtration to determine TOCr.
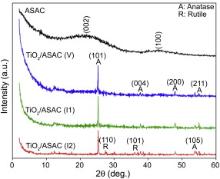
The X-ray Diffraction (XRD) patterns of almond shell activated carbon (ASAC) and TiO2/ASAC catalysts are shown in Fig. 3. The two broad peaks of the ASAC sample indicate that this sample is not very crystallized, which is a typical characteristic of the activated carbon. While the peak at 2 θ = 22° corresponds to reflexions in the (002) plane, whereas the peak at 2 θ = 43° matches the (100) plane[ 44]. The XRD patterns of TiO2/ASAC catalysts show the presence of peaks at 2 θ values of 25.3°, 37.8°, 48°, 53.9° and 55° corresponding to the anatase phase (JCPDS No. 21-1272).
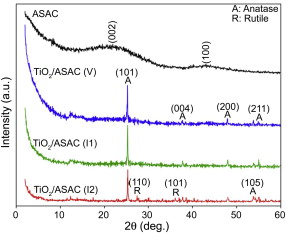 | Fig. 3. XRD patterns of the ASAC, TiO2/ASAC (V), TiO2/ASAC (I1) and the TiO2/ASAC (I2). |
Both peaks at 2 θ values of 27.4° and 36.1° are characteristics of the TiO2-rutile phase (JCPDS No. 21-1276). The crystallization of amorphous TiO2 into anatase occurs at about 380 °C, as explained in literature[ 45] and [ 46]. Moreover, the transformation of anatase into rutile seems to occur between 550 °C and 650 °C[ 46]. So in this work, after calcination at 500 °C for 3 h, the rutile phase appears in TiO2/ASAC (V) and TiO2/ASAC (I1) samples.
As listed in Table 1, the relative content of anatase and rutile are estimated using the Spurr-Myers equation (3)[ 47]:
 | (3) |
where A (%) is the relative content of anatase, IA and IR are the intensities of the anatase (101) peak at 2 θ = 25.3° and the rutile (110) peak at 2 θ = 27.4°[ 48],[ 49].
The anatase content of samples is equal to 92%, 83% and 81% for TiO2/ASAC (V), TiO2/ASAC (I1) and TiO2/ASAC (I2), respectively. These values show that the anatase is highly predominant in all samples. The main active crystal phases of TiO2 are anatase and rutile. Among the two phases, anatase is typically more active[ 50]. According to Ambrus et al.[ 51], photocatalyst containing anatase phase is more efficient than rutile-only catalyst. This also suggests that the catalyst (TiO2/ASAC (V)) with >90% anatase shows improved photocatalyst activity.
Based on the XRD results, the average crystal size of TiO2 was calculated using the Debye-Scherrer equation (4):
 | (4) |
where D is the average crystallite size (nm), λ is the wavelength of the X-ray radiation ( λ = 0.1540 nm), K is the Scherrer constant ( K = 0.9), β is the full-width at half-maximum (FWHM) of the (1 0 1) plane and θ is the Bragg angle (rad)[ 52],[ 53]. The size of TiO2 crystallites is listed in Table 1 for all the samples.
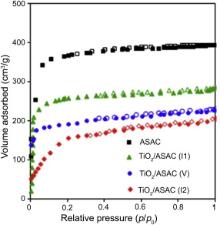
The nitrogen adsorption isotherm of different photocatalysts is presented in Fig. 4. The isotherm exhibits a typical International Union of Pure and Applied Chemistry (IUPAC) type IV with a tight hysteresis loop at high relative pressure of p/ p0 = 0.6-1.0, thus indicating the presence of mesopores[ 49],[ 54]. As shown in Table 1, the specific surface area ( SBET) was reduced from 1400 to 580 m2/g (~41%) and the total pore volume was reduced from 0.83 to 0.3 cm3/g (31%), indicating that the pores of the ASAC are remarkably blocked by the loaded TiO2. The reduction in surface area and pore volumes in sample TiO2/ASAC (V) was more than that in TiO2/ASAC (I1). This may indicate that TTIP vapor, which was driven by nitrogen in chemical vapor deposition procedure, was easier to penetrate the porous texture of ASAC and deposited there. On the other hand, the content of anatase in TiO2/ASAC (V) is higher than that of TiO2/ASAC (I1). This may signify that the chemical vapor deposition procedure gave more chance to the precursor to take position on the pores ready to crystallize when conditions are suitable. On the other hand, anatase TiO2 can have more effect on reducing the surface area and pore volumes due to its presence within the micro-meso texture. In other words, the percentage anatase is proportional to the reduction in surface area and pore volumes. This means easier crystallization of anatase inside the pores, and thus confirming that percentage anatase may be used as an inverse indicator of reduction in surface area and porosity.
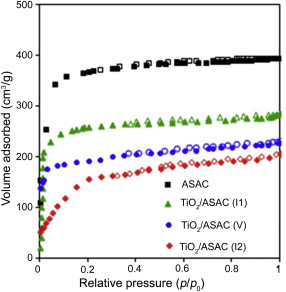 | Fig. 4. Nitrogen adsorption-desorption isotherms of ASAC and TiO2/ASAC samples. |
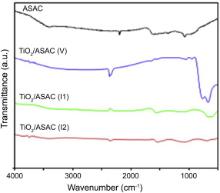
The FTIR spectra of ASAC and TiO2/ASAC samples are shown in Fig. 5. For all samples, the broad peaks at 1610 and 3420 cm-1 correspond to the vibration of -OH groups and H2O molecules adsorbed on the surface of samples[ 55],[ 56], respectively. The FTIR spectrum of each photocatalyst presents a broad band between 680 and 850 cm-1, which is characteristic of the vibration (Ti-O-Ti) for the anatase phase. This band is more intense for TiO2/ASCA (V) sample, as a consequence of the higher TiO2-anatase loading in this sample. The band at 1060 cm-1 can be attributed to (Ti-O-C) groups[ 57] ,[ 58].
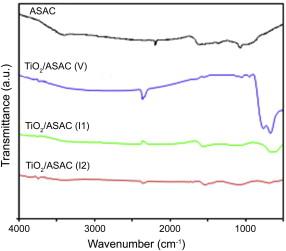 | Fig. 5. FTIR spectra of ASAC and TiO2/ASAC samples. |
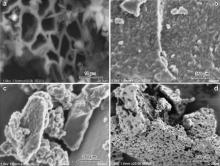
SEM images of ASAC, TiO2/ASAC (V), TiO2/ASAC (I1) and TiO2/ASAC (I2) samples are shown in Fig. 6. It is clearly seen that ASAC sample presents an irregular and highly porous surface (Fig. 6(a)). When TiO2 is grafted on ASAC by the MOCVD method (TiO2/ASAC (V) sample), TiO2 particles are uniformly distributed on the surface as well as in the bulk of the activated carbon (Fig. 6(b)). SEM images of TiO2/ASAC (I1) and TiO2/ASAC (I2) samples show the agglomeration of TiO2 particles on the carbonaceous surface (Fig. 6(c) and (d)).
 | Fig. 6. SEM images of ASAC (a), TiO2/ASAC (V) (b), TiO2/ASAC (I1) (c) and TiO2/ASAC (I2) (d) samples. |
Coverage rate rc was introduced to characterize the active surface of ASAC covered by TiO2, and it is calculated by the following equation:
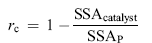 | (5) |
where SSAcatalyst is the tested specific surface area of the catalysts, and SSAP is predicted by the following equation based on the composition of the individual components[ 59]:
 | (6) |
where SSAT and SSAASAC are the specific surface area of TiO2 and almond shell activated carbon, respectively. The mTiO2 and mASAC are the mass percentage of TiO2 and ASAC in the photocatalysts, respectively. SSAASAC is much larger than SSAT, so SSAP can be further approximately expressed as:
 | (7) |
The calculated values of coverage rate rc for ASAC by TiO2 training the three photocatalysts are shown in Table 1. These values show that the TiO2 is strongly deposited on carbonaceous surface. For the impregnation method, the titania was transformed into network and covering layers on ASAC, blocking the pores and reducing active surface of the activated carbon. It is clear that the ASAC could efficiently support to deposit titanium particles.
The concentration of TiO2 in the TiO2/ASAC photocatalysts was clearly identified from EDX (Table 1). Especially, the TiO2/ASAC (V) had the highest titania concentration of 18.2 wt%. This may be attributed to the elaboration conditions which use the nitrogen like a conveying gas of the titanium vapor.
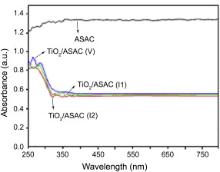
The diffuse reflectance spectroscopy of ASAC and TiO2/ASAC photocatalysts are shown in Fig. 7. ASAC shows a strong absorption almost in the whole range of the wavelength studied. On the other hand, photocatalysts exhibited a different absorption pattern. Within the range of 400-800 nm, the absorption is due to the ASAC component below 400 nm, and it is typically due to the presence of anatase phase TiO2. The spectra show the characteristic absorption edge of anatase phase TiO2 approximately 380 nm. The absorption edge does not shift towards the blue region, which indicates that there is no quantum size effect on the TiO2/ASAC photocatalysts[ 60]. The optical band gap energy value Eg calculated by extrapolating the linear portion of UV region to zero was found to be 3.26 eV, which was in agreement with that reported by Rengaraj et al.[ 61]. The TiO2/ASAC photocatalysts appeared to be gray in color, due to the increase in electric charges in TiO2 by the addition of ASAC.
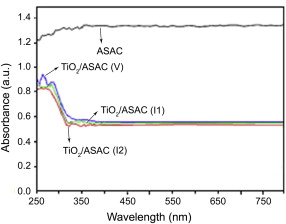 | Fig. 7. UV-vis diffuse reflectance spectra of ASAC and TiO2/ASAC samples. |
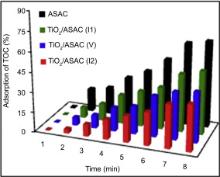
In order to evaluate the adsorption capacities of the prepared solids, TOC adsorption kinetics were performed for 180 min (Fig. 8). It is found that the activated carbon ASAC shows the highest adsorption capacity of TOC because the specific surface area of ASAC sample is equal to 1398 m2/g[ 62]. The reason may be supported by the presence of mesopores on its surface. Generally, the presence of mesopores in the activated carbon can significantly enhance adsorption capacities, especially for large adsorbates[ 62]. The TOC adsorption capacity of TiO2/ASAC (V), TiO2/ASAC (I1) and TiO2/ASAC (I2) samples is related to the specific surface. TiO2/ASAC (I1) sample shows the highest TOC capacity, which corresponds to the highest specific surface area of synthesized photocatalysts, i.e. 730 m2/g.
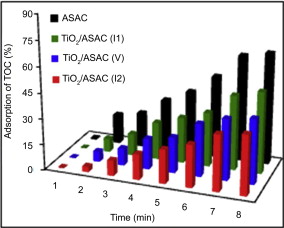 | Fig. 8. TOC adsorption kinetics on the different solids (ASAC, TiO2/ASAC (V), TiO2/ASAC (I1) and TiO2/ASAC (I2)). |
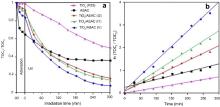
Fig. 9(a) shows the photocatalytic activity of ASAC and three prepared photocatalysts. Under dark conditions (TOC adsorption), ASAC adsorbs about 30% of TOC, whereas TiO2/ASAC samples only adsorb 15% of TOC. These results confirm the adsorption kinetics presented in the previous section. Under UV illumination, after 300 min, the residual ratio “TOC/TOC0” is higher for ASAC sample (about 40%) compared to TiO2/ASAC samples (10% < TOC/TOC0<20%), while during the TOC adsorption phase, ASAC sample adsorbs a higher amount of TOC compared to TiO2/ASAC samples. So these results suggest that the presence of TiO2 inside the porous texture of ASAC increases the TOC degradation under UV illumination. Nevertheless, the important factor that enhances the photoactivity of TiO2 is its grafting on ASAC sample because the high specific surface area of ASAC concentrates TOC around the grafted TiO2. Furthermore, ASAC improves the thermal stability of TiO2-anatase, avoids the growth of TiO2 crystallites, and preserves a higher content of surface hydroxyl groups[ 52]. When TiO2/AC (V) was used, the TOC degradation was 92% in comparison of only 50% for the case of TiO2 (P25). This proves that the AC supporting TiO2 can mineralize TOC to a larger extent than the suspended TiO2 particles.
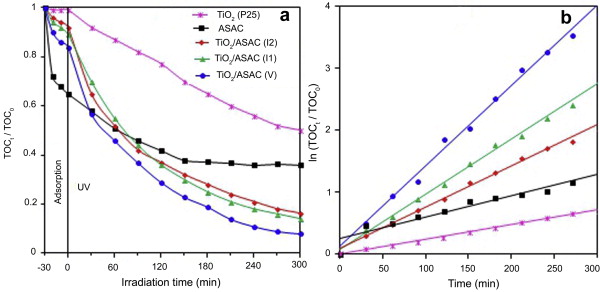 | Fig. 9. Photocatalytic TOC degradation tests over the different samples at 45 °C. The inset shows the plot of ln (TOC0/TOCt) versus time. |
The vapor-made photocatalyst (TiO2/ASAC (V)) synthesized by MOCVC shows higher photoactivity than the other photocatalysts. This result is in correlation with the physico-chemical properties of materials, such as the anatase content in this sample is slightly higher (92%) than that in both other TiO2/ASAC samples (81%).
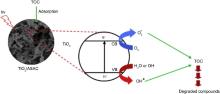
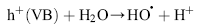
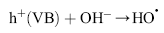
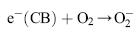
The mechanism of photocatalytic oxidation processes has been extensively discussed in the literature[ 63], [ 64],[ 65]. When the photocatalyst is exposed to UV radiation with light energy greater than its band gap energy (3.2 eV), an electron (e-) in the conduction band (CB) of the semiconductor can be transferred to the valance band (VB), remaining a positive hole (h+) in the valence band (Fig. 10).
 | (8) |
 | Fig. 10. Schematic illustration of the possible structure of TiO2/ASAC photocatalyst and adsorption and photocatalytic degradation of TOC by TiO2/ASAC. |
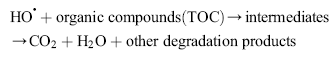
Under light irradiation, reactive oxygen species, such as HO• and O2•- in the electron and hole are produced by H2O and O2 on the surface of TiO2. The hydroxyl radicals (HO•), which are the most powerful oxidizing agent, can mineralize most of the organic pollutants to smaller and less harmful species, eventually producing CO2, H2O, and other degradation products through the various different paths[ 65] and [ 66].
 | (9) |
 | (10) |
 | (11) |
 | (12) |
Fig. 10 depicts possible structure of TiO2/ASAC with adsorption capacity and photocatalytic activity. As mentioned in the previous section, a large amount of TiO2 will be exposed on the surface of activated carbon. As a result, active site available on the surface of activated carbon will increase. This may also contribute to the high photocatalytic activity of TiO2/ASAC. Thus, TiO2 supported on activated carbon will degrade TOC through photocatalytic oxidation process as mentioned above. HO• will attack aromatic ring sites in organic compounds and result in the formation of ring-opened products.
Ring-opened products may contribute to decrease in molecular size which may later yield CO2 and H2O and other degradation products[ 67]. The breaking down of the benzene ring and subsequent mineralization leading to CO2 and H2O could be visualized by the decrease in TOC during the photocatalytic process[ 68].
The kinetics of TOC degradation by TiO2/ASAC photocatalysts is analyzed using the first-order model expressed in equation (13)[ 69]:
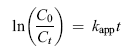 | (13) |
where kapp is the apparent rate constant of the first-order reaction (min-1), C0 is the equilibrium concentration of TOC after adsorption in the dark, and Ct is the remaining concentration of TOC at certain irradiation time. The plot of ln ( C0/ Ct) versus t is shown in Fig. 9(b) which confirms that the photocatalytic degradation follows the pseudo-first-order kinetics for all TiO2/ASAC photocatalysts. In the case of the activated carbon (ASAC), this theory is not valid because TOC is adsorbed on ASAC but does not degrade. This adsorption phenomenon takes place at two stages, the first of which relates to adsorption on the pores surface and the second represents the diffusion inside the sites of the activated carbon[ 4].
Table 2 presents the apparent first-order rate constants ( kapp) for different photocatalysts. kapp is used as a comparison parameter because it is independent of the TOC concentration used. It allows for the determination of the photocatalytic activity independent of the previous adsorption period in the dark. The degradation rate of TOC by the TiO2/ASAC (V) photocatalysts is higher than the other correlation coefficient.
| Table 2. Apparent first-order rate constants ( kapp) for the different photocatalysts |
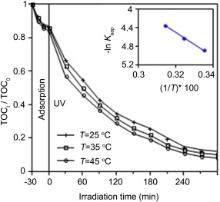
For TiO2/ASAC (V) sample, the kinetics of the photocatalytic degradation of TOC at different temperatures in the range of 25-45 °C has been carried out (Fig. 11). What is worthwhile noting is that the amount of degraded TOC increases with the temperature.
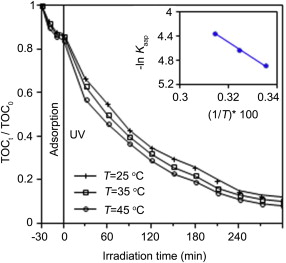 | Fig. 11. TOC photocatalytic degradation tests with TiO2/ASAC (V) sample at different temperatures. The inset shows the plot of ln kapp versus 1/ T ( T is the temperature). |
The apparent activation energy ( Ea) for the photocatalytic degradation of TOC is calculated from the Arrhenius equation (14):
 | (14) |
The linear transform ln kapp = f(1/ T) gives a straight line, whose slope is equal to - Ea/ R (see the inset of Fig. 11). From the data obtained for all the photocatalysts (figures not shown), Ea is equal to 20, 45 and 85 kJ/mol for TiO2/ASAC (V), TiO2/ASAC (I1) and TiO2/ASAC (I2) samples, respectively. This apparent energy represents the total activation energy of both adsorption and photocatalytic degradation of TOC.
Almond shell activated carbon is used as the support during the production of supported TiO2 by metal organic chemical vapor deposition (MOCVD) and impregnation methods. The XRD analysis confirms that TiO2 supported on activated carbon contains two different phases: anatase (high content) and rutile (low content). Scanning electron microscopy has revealed the uniform distribution of TiO2 over the activated carbon when the MOCVD method is used. The specific surface area of ASAC decreased from 1400 m2/g to 580 m2/g, indicating that the pores of this activated carbon are blocked by TiO2. FTIR measurements show that TiO2/ASAC photocatalysts have a broad band between 680 and 850 cm-1 characteristic of the vibration (Ti-O-Ti) for the anatase phase. The kinetics of the TOC degradation in industrial phosphoric acid solution by TiO2/ASAC photocatalysts well fit a pseudo-first-order kinetic. The comparison of the various materials gives the following decreasing order of the catalytic performance: TiO2/ASAC (V) > TiO2/ASAC (I1) > TiO2/ASAC (I2) > ASAC > TiO2 (P25). MOCVD method is more effective than impregnation in the preparation of the hybrid TiO2-activated carbon materials. These hybrid materials present high potentials for the adsorption of pollutants and also for the degradation of organic pollutants from groundwater and surface water.
Acknowledgments
S.D. Lambert is grateful to Belgian F.R.S.-F.N.R.S for her research associate position. The authors thank Pr. Jean-Paul Pirard, University of Liege, for helpful discussions. The authors also acknowledge the Tunisian Chemical Group (GCT), Research Center of Sfax, the Fonds de Recherche Fondamentale Collective and the Ministère de la Région Wallonne for financial supports.
| 1. |
|
| 2. |
|
| 3. |
|
| 4. |
|
| 5. |
|
| 6. |
|
| 7. |
|
| 8. |
|
| 9. |
|
| 10. |
|
| 11. |
|
| 12. |
|
| 13. |
|
| 14. |
|
| 15. |
|
| 16. |
|
| 17. |
|
| 18. |
|
| 19. |
|
| 20. |
|
| 21. |
|
| 22. |
|
| 23. |
|
| 24. |
|
| 25. |
|
| 26. |
|
| 27. |
|
| 28. |
|
| 29. |
|
| 30. |
|
| 31. |
|
| 32. |
|
| 33. |
|
| 34. |
|
| 35. |
|
| 36. |
|
| 37. |
|
| 38. |
|
| 39. |
|
| 40. |
|
| 41. |
|
| 42. |
|
| 43. |
|
| 44. |
|
| 45. |
|
| 46. |
|
| 47. |
|
| 48. |
|
| 49. |
|
| 50. |
|
| 51. |
|
| 52. |
|
| 53. |
|
| 54. |
|
| 55. |
|
| 56. |
|
| 57. |
|
| 58. |
|
| 59. |
|
| 60. |
|
| 61. |
|
| 62. |
|
| 63. |
|
| 64. |
|
| 65. |
|
| 66. |
|
| 67. |
|
| 68. |
|
| 69. |
|