


Effects of Annealing Temperature on Cu-Doped ZnO Nanosheets
[Yuliang Liu1, *  , Junpeng Wang
1 , Chunhua Xu1 , Zishu Si1 , Shensheng Xu2 , Sanqiang Shi3 ]
, Junpeng Wang|
|


The synthesis of Cu-doped ZnO nanosheets at room temperature was reported in our previous paper. The effects of annealing temperature on Cu-doped ZnO nanosheets were studied in this paper. Cu-doped ZnO nanosheets were annealed at 200-500 °C in air. The annealed specimens were characterized by scanning electron microscopy (SEM), X-ray diffraction (XRD) and transmission electron microscopy (TEM). The results show that Cu concentration in Cu-doped ZnO nanosheets reduced with increasing annealing temperature. When annealing temperature was lower than Zn melting point (410 °C), the morphologies of the Cu-doped ZnO nanosheets remained nearly the same as that before annealing. However, when the annealing temperature was over Zn melting point, Cu-doped ZnO nanosheets changed to nanowires, wormlike nanosheets or did not change. The change of Cu concentration in Cu-doped ZnO nanosheets is explained by oxidation thermodynamics. A physical model is suggested to explain the morphology changes of Cu-doped ZnO nanosheets, based on the existence of Cu-rich layer beneath Cu-doped ZnO nanosheets.
Semiconductor ZnO has large exciton binding energy (60 meV) and wide direct band gap (3.37 eV). The synthesis, characterization, and application of nanostructural ZnO have been researched intensively[ 1]. Nanostructural ZnO is expected to have wide-ranging application possibilities, such as photocatalysis[ 2], solar cells[ 3],[ 4], ultraviolet lasers[ 5], build-blocks in modern nanoelectronics[ 6],[ 7] and anode materials for Li-ion batteries[ 8].
Properties of ZnO can be tuned by doping transition metal atoms, such as Cu, to fit specific needs and applications. The doping can induce drastic changes in electrical, optical and magnetic properties of ZnO by altering its electronic structure[ 9]. Substitution of Cu into the ZnO lattice has shown to improve properties such as gas sensitivity, photocatalytic activity and magnetic semiconductivity[ 10]. Up to now, Cu-doped ZnO systems have been fabricated using various synthetic approaches, such as pulsed laser deposition[ 11], magnetron sputtering[ 12], sol-gel method[ 13],[ 14], ion beam technique[ 15], and chemical vapor deposition[ 16],[ 17]. A fast and low cost method to fabricate Cu-doped ZnO nanosheets has also been reported in our previous paper[ 18].
Nanostructural Cu-doped ZnO can be used at room temperature or high temperature. The morphologies and structures of Cu-doped ZnO may change at high temperature, resulting in change in properties of nanostructural Cu-doped ZnO during services. When the Cu-doped ZnO films or powders were heated at high temperature, generally, Cu doping is still in Cu-doped ZnO[ 19]. CuO precipitates from Cu-doped ZnO are also reported during the synthesis of Cu-doped ZnO powders by sol-gel method. The gel sintered in Ar had a pure Cu-doped ZnO phase while both Cu-doped ZnO and CuO phases were observed in the gel sintered in air[ 14]. However, Cu concentration in Cu-doped ZnO nanosheets reduced with increasing annealing temperature in this experiment, due to the growth of Cu-doped ZnO nanosheets on zinc foil. The effects of Zn foil substrate on the structure and morphology of Cu-doped ZnO nanosheets remain unclear and are unavailable in open literature. In this study, Cu-doped ZnO nanosheets were produced by immersing zinc foils into CuSO4 aqueous solutions for short time and then dried at ambient temperature first. The effects of annealing temperatures on the morphology and the Cu concentration of Cu-doped ZnO nanosheets were also studied.
Commercial zinc foils with the thickness of 300 μm and the purity of 99.0% were ground on 1000# emery paper, then washed in acetone, ethanol and distillation water for 5 min, respectively, by a ultrasonic cleaner (KQ-600DB, 600W, 40 kHz). Cleaned zinc foils were immersed into 1%, 2.5%, and 5% CuSO4 aqueous solutions for 3 s, respectively, and finally dried at ambient condition for about 20 min. Then the specimens were washed in distillation water for 3 times to clean reaction products in the solutions. All the chemicals, including acetone (99.5%), ethanol (99.7%), and CuSO4 (99%) are analytic grade in the experiments.
Specimens in an alumina crucible were heated at the temperatures of 200, 300, 400, and 500 °C, respectively, in a tube furnace (SYS-G-Z-13) in air for 3 h. The morphologies of the annealed specimens were characterized by scanning electron microscopy (SEM, JEM-5610LV). The crystal structures of the specimens were examined with a D8 advanced X-ray diffractometer (CuKα radiation, 40 kV, 30 mA). Samples for transmission electron microscopy (TEM) examination were prepared as follows: a bottle of the ethanol solution with the specimens, including those before annealing, after annealing at 300 or 500 °C was put into an ultrasonic machine (SYS-5200) for 30 min. The resulting solution was dropped onto a carbon coated Ni TEM grid. TEM image was taken from the samples on the Ni TEM grid by using a JSM-2100 transmission electron microscope with an energy dispersive spectroscope.
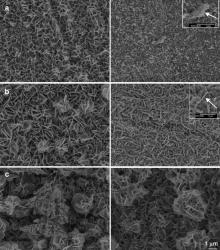
The surface morphologies of the immersed specimens in various CuSO4 aqueous solutions after annealing at different temperatures are quite different. When annealing temperature was lower than Zn melting point (410 °C), the morphologies of specimens before and after annealing were nearly same, as shown in Fig. 1. However, morphologies significantly changed after annealing at temperatures over the melting point (410 °C) of Zn. Fig. 1(a) shows the morphologies on the specimens after immersing in 1% CuSO4, then annealing at 300 °C (left) and at 500 °C (right). The morphology on the specimen annealed at 300 °C shows uniform nanosheets and is similar to that before annealing, which was shown in our previous paper[ 18]. The morphology of Cu-doped ZnO nanosheets on the specimen annealed at 500 °C becomes short nanowires, as shown in Fig. 1(a). More nanowires and fewer nanosheets (marked with an arrow) can be seen clearly at high magnification on the upper right of Fig. 1(a). Fig. 1(b) shows the morphologies on the specimen after immersion in 2.5% CuSO4, then annealing at 300 °C (left) and at 500 °C (right). The morphology on the specimen annealed at 300 °C shows uniform and flower-like nanosheets and is similar to that before annealing in our previous paper[ 18]. The morphology of Cu-doped ZnO nanosheets on the specimen annealed at 500 °C becomes short worm-like nanosheets, as shown in Fig. 1(b). Worm-like nanosheets and fewer nanowires (marked with an arrow) can be seen clearly at high magnification on the upper right of Fig. 1(b). Fig. 1(c) shows the morphologies on the specimen after immersing in 5% CuSO4, then annealing at 300 °C (left) and at 500 °C (right). The morphologies of Cu-doped ZnO nanosheets on the specimens annealed at 300 and 500 °C show flower-like nanosheets and are similar to that before annealing in our previous paper[ 18]. The diameters of the flowers are in the range of 1-2 μm and the thicknesses of nanosheets are about 70-100 nm with the width of less than 1 μm.
 | Fig. 1. Morphologies of nanostructures on the specimens after annealing at 300 °C (left) and 500 °C (right): the specimens immersing in 1% (a); 2.5% (b); and 5% (c) CuSO4 solutions first. |
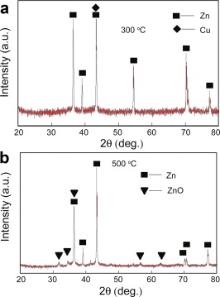
The structural characteristics of the specimens after immersing in 2.5% CuSO4 then annealing at various temperatures were studied by XRD. Fig. 2(a) and (b) shows XRD spectra of the specimens after annealing at 300 and 500 °C in air for 3 h, respectively. Hexagonal close-packed Zn can be identified in Fig. 2(a), which is from zinc-foil substrate. Cu phase can not be determined effectively because only the strongest Cu peak at 2 θ = 43.2° is detected and overlaps with the peak for Zn. ZnO phase cannot be detected in Fig. 2(a). The possible reason is that the quantity of ZnO phase is too less to be detected. ZnO and Zn phases can be detected on the specimen surfaces after oxidation at 500 °C in Fig. 2(b). The peaks for ZnO in Fig. 2(b) belong to hexagonal ZnO.
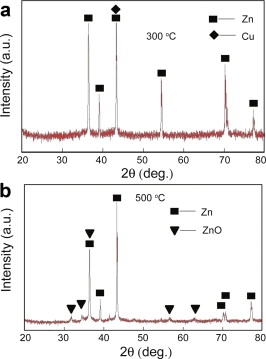 | Fig. 2. XRD spectra of the specimens showing: (a) Zn and possible Cu phases after annealing at 300 °C; (b) ZnO and Zn phases after annealing at 500 °C. |
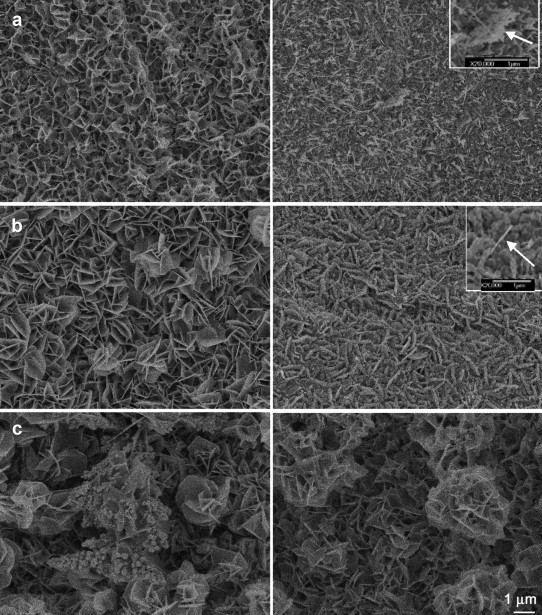
TEM images on the specimens immersed in 2.5% CuSO4 and annealed at various temperatures are shown in Fig. 3. The morphologies show nanosheets and blocks. Fig. 3(a) is TEM images taken from the specimen immersed in 2.5% CuSO4. The morphology of blocks is shown on the upper left in Fig. 3(a). The crystalline structure of the blocks could not be detected by selective area electron diffraction (SAED), due to thick blocks. The morphology of a nanosheet on the lower left in Fig. 3(a) shows nanograins and the high resolution image on the lower right in Fig. 3(a) shows the nanograins with the size of about 5 nm. SAED for the nanosheet illustrated on the right upper in Fig. 3(a) shows polycrystalline diffraction rings, suggesting the polycrystalline hexagonal ZnO.
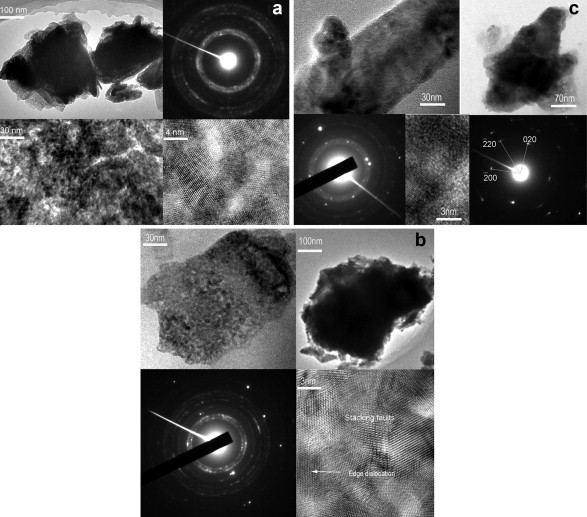 | Fig. 3. TEM image taken from the specimens immersed in 2.5% CuSO4 aqueous solution and then the specimens before annealing (a), after annealing (b) at 300 °C and after annealing at 500 °C (c). |
Fig. 3(b) shows TEM images taken from the specimen after annealing at 300 °C. By comparison with the nanosheets in Fig. 3(a), the nanosheet on the upper left of Fig. 3(b) shows larger grains. SAED for the nanosheet illustrated on the bottom-left of Fig. 3(b) shows polycrystalline diffraction rings and diffraction spots, suggesting polycrystalline and large hexagonal ZnO grains. A high resolution image taken from the nanosheets on the bottom-right shows more defects on the ZnO grains, such as edge dislocations and stacking faults. The morphology of a block is shown on the top-right of Fig. 3(b). The crystalline structure of the block can not be detected by SAED, due to the thick block.
Fig. 3(c) shows TEM images taken from specimens after annealing at 500 °C. The nanosheets on the upper left in Fig. 3(c) become worm-like, which is inconsistent with SEM image in Fig. 1(b). SAED for the worm-like nanosheets illustrated on the lower left in Fig. 3(c) is similar to that in Fig. 3(b), showing polycrystalline diffraction rings and diffraction spots. A high resolution image shows ZnO grains, taken from the worm-like nanosheet on the lower middle in Fig. 3(c). The crystalline defects in the worm-like nanosheet obtained after annealing at 500 °C are less than those after annealing at 300 °C. The morphology of a block is shown on the upper right in Fig. 3(c). The crystalline structure of the block is identified as fcc Cu by SAED, shown in the lower right in Fig. 3(c).
Cu-doped ZnO nanosheets were formed on the specimen surfaces while the blocks were beneath the nanosheets after zinc foils were immersed into CuSO4 aqueous solutions, based on our previous analysis[ 18]. The compositions on the nanosheets and blocks in Fig. 3 were analyzed by energy dispersive spectroscopy (EDS), as listed in Table 1. Based on the composition analysis in Table 1, the structure for the nanosheets from the immersed specimens was Cu-doped ZnO (Cu:ZnO) while the structure for the blocks contained ZnO and Cu-rich layer. With the increasing annealing temperatures, Cu concentration in ZnO nanosheets decreased while that in blocks increased, as shown in Fig. 4. When the annealing temperature increased from 20 to 500 °C, Cu concentration in ZnO nanosheets reduced from 2.1 at.% to zero in Fig. 4(a) while the Cu concentration in block (Cu-rich layer) increased from 29.03 at.% to 91.51 at.% in Fig. 4(b).
| Table 1. Elements measured by EDS on (a) nanosheets and (b) blocks of the specimens before (20 °C) and after annealing at various temperatures |
 | Fig. 4. Changes of Cu concentrations with increasing annealing temperatures: (a) Cu-doped ZnO nanosheets, (b) blocks. |
Cu-doped ZnO films or powders have been synthesized by different methods[ 11], [ 12], [ 13], [ 14], [ 15], [ 16], [ 17],[ 18]. The valences of Cu in Cu-doped ZnO should be +2 or +1. Cu might be in the substitutional sites of Zn2+[ 14],[ 20] or the main impurities in ZnO crystal[ 12]. Generally, annealing at high temperature could not change Cu doping concentration in Cu-doped ZnO films[ 19]. The decrease of Cu concentration in Cu-doped ZnO nanosheets during annealing in the present experiment should be related to metal Zn in Zn foil substrate.
With increasing annealing temperatures, Cu concentration in ZnO nanosheets reduced while that in Cu-rich layer (blocks) increased in Fig. 4. Cu redistribution in the nanosheets and blocks is explained by oxidation thermodynamics as follows.
Based on oxidation theory, in the system with two elements of Cu and Zn, Cu is the base metal and Zn is the solute metal. Zn and Cu in Cu-Zn alloys can be oxidized to ZnO and CuO, respectively, during initial oxidation[ 21]. The structure of the specimens in the present experiment can be expressed as Cu-doped ZnO nanosheets/Cu-rich layer (Cu-Zn)/Zn foil substrate during annealing. The structure of Cu-rich layer (Cu-Zn)/Zn foil substrate is similar to that of Cu-Zn alloy so the oxidation theory of Cu-Zn alloy can be used to explain the annealing process. When the specimens were annealed at high temperature in oxidative environment, Cu and Zn elements in Cu-rich layer (Cu-Zn) beneath Cu-doped ZnO nanosheets could be oxidized to CuO and ZnO, based on the thermodynamics calculation. The values of Δ G0s for formation of ZnO and CuO are calculated by Eqs. (1) and (2)[ 22], respectively. The equilibrium oxygen partial pressure 
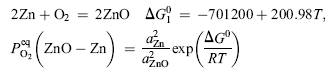 | (1) |
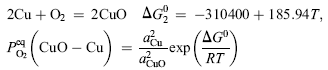 | (2) |
where R is the gas constant (8.31 J/(mol K)); G0 is the standard free energy changes; 

The oxygen partial pressure in the oxide scale decreases from specimen surface (2.12 × 10⁴ Pa, in air) to equilibrium oxygen partial pressures, 
Based on the oxidation theory of Cu-Zn alloy, when CuO and ZnO are formed on Cu-Zn alloy at the initial oxidation, CuO can change to ZnO, due to Zn atom diffusion out from alloy[ 21], based on Δ G0 calculation on Eq. (3). If the zinc level in Cu-Zn alloy is >20%, stable ZnO scale will form after initial oxidation[ 21]. In the present experiment, CuO could change to ZnO during continuous annealing with Zn atoms diffusion out from Zn foil substrate.
 | (3) |
At the same time, diffused zinc atom from Zn foil substrate displaces Cu in Cu-doped ZnO nanosheets, according to Eq. (3). The displaced Cu in Eq. (3) remained on the Cu-rich layer (Cu-Zn, blocks). In this way, Cu concentration decreased in Cu-doped ZnO nanosheets and increased on the Cu-rich layer with increasing annealing temperatures.
The morphologies of ZnO nanosheets obtained by immersing Zn foils in different concentrations of CuSO4 aqueous solutions did not change after annealing at temperatures below Zn melting point (410 °C), while the morphologies of ZnO nanosheets might change after annealing at temperatures over Zn melting point, such as 500 °C, depending on the concentration of CuSO4 aqueous solutions (Fig. 1).
Since the structure of the specimens can be expressed as Cu-doped ZnO nanosheets/Cu-rich layer (Cu-Zn)/Zn foil substrate during annealing, Zn atoms should diffuse through Cu-rich layer from Zn foil substrate during annealing to form new ZnO oxide. The amount of diffused Zn atoms from Zn foil substrate depended on annealing temperature. When annealing temperature was below Zn melting point, such as 300 °C, new ZnO formed on the specimen surface during annealing should be less, due to less Zn atoms diffusion out from solid Zn foil substrate. For this reason, the morphology of ZnO nanosheets immersed in different concentrations of CuSO4 aqueous solutions does not change.
However, when annealing temperature was over melting point of Zn, such as 500 °C, diffusion rate of Zn atoms from liquid Zn foil substrate would increase significantly. If Cu-rich layer could not resist Zn atom diffusion, the morphology of Cu-doped ZnO nanosheets might change, which is explained in Fig. 5.
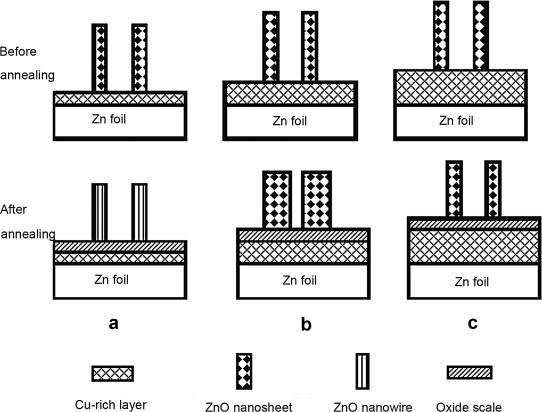 | Fig. 5. Schematic of the morphology change of the Cu-doped ZnO nanosheets during annealing at 500 °C. The specimens were immersed in 1% CuSO4 (a), 2.5% CuSO4 (b), 5% CuSO4 (c). |
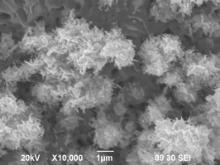
A Cu-rich layer (Cu-Zn) was beneath Cu-doped ZnO nanosheets after Zn foil was immersed into CuSO4 aqueous solutions[ 18], as illustrated on the top of Fig. 5. The higher the CuSO4 concentration in solution was, the thicker the Cu-rich layer formed on the specimens was. New ZnO could be formed on the specimen surface during annealing if Zn atom diffused out from Zn foil through Cu-rich layer. The different thicknesses of Cu-rich layers on the specimens could affect the diffusion rates of Zn atoms from Zn foils during annealing, resulting in different changes of the morphologies of Cu-doped ZnO nanosheets. Thin Cu-rich layer on the specimen immersed in 1% CuSO4 aqueous solution (the top of Fig. 5(a) could not resist Zn atom diffusion form Zn foil). More Zn atoms were available on specimen surface and reacted with oxygen in air during annealing to form new ZnO. New ZnO could be oxide scale or ZnO nanowires, depending on diffusion routes of Zn atoms. Generally, Zn atoms diffuse along the lattices of oxide, resulting in the formation of oxide scale, but ZnO nanowires can be formed if a Zn atom diffuses along line defects, such as screw dislocation, in oxide[ 23] as illustrated in Fig. 5(a). ZnO nanowires formed on Zn or Zn-Cu alloy foils have single crystalline structure, which was reported in our previous paper[ 24],[ 25]. Moreover, From Fig. 1(a), the quantity of nanosheets on the specimens after annealing at 500 °C is less than that at 300 °C, suggesting that ZnO nanosheets might transfer to ZnO oxide scale. The possible reasons include that the bottom of ZnO nanosheets merges into new oxide scale during annealing and that nanosheets become worm-like (see Fig. 1(b)) to reduce surface area of the nanosheets for lower surface energy. The thicker Cu-rich layer on specimens immersed in 2.5% CuSO4 aqueous solutions could resist the diffusion of Zn atoms from Zn foil during annealing and less new ZnO was formed as nanowires or oxide scale in Fig. 1(b). Moreover, the ZnO nanosheets became worm-like, due to the growth of ZnO grains in nanosheets for lower surface energy, illustrated in Fig. 5(b). Very thick Cu-rich layer on the specimens immersed into 5% CuSO4 aqueous solutions could effectively resist the diffusion out of Zn atoms from Zn foil substrate during annealing and nearly no new ZnO could be formed on the specimen surface. Therefore, the morphology of ZnO nanosheets was nearly the same as that before annealing (Fig. 5(c)). To conform this explanation, the specimen after immersed into 5% CuSO4 aqueous solutions was annealed at 700 °C for 3 h and ZnO nanowires on ZnO nanosheets can be observed in Fig. 6.
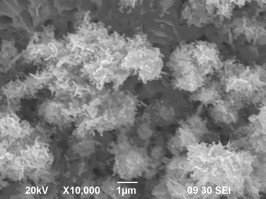 | Fig. 6. Morphologies of nanostructures on the specimens being annealed at 700 °C and immersed in 5% CuSO4 solution. |
(1)When the annealing temperatures increased from 20 to 500 °C, Cu concentration in Cu-doped ZnO nanosheets reduced while that in Cu-rich layer increased. In the case of Zn foil immersed in 2.5% CuSO4 aqueous solution, Cu concentration in ZnO nanosheets reduced from 2.1 at.% to zero while that in Cu-rich layer increased from 29.03 at.% to 91.51 at.%, with the rise in annealing temperatures to 500 °C.
(2)The morphologies of Cu-doped ZnO nanosheets remained nearly unchanged after annealing at the temperatures lower Zn melting point (410 °C), independing on CuSO4 concentration in solutions immersed specimens. However, the morphologies significantly changed after annealing at 500 °C. The Cu-doped nanosheets on the immersed specimens in 1% CuSO4 solution became nanowires. The Cu-doped nanosheets on the immersed specimens in 2.5% CuSO4 solutions became worm-like. The Cu-doped nanosheets on the immersed specimens in 5% CuSO4 solutions remained nearly the same as that before annealing.
Acknowledgments
This work was financially supported by the Henan University of Science and Technology through a grant of Postgraduate Innovation Fund (No. CXJJ-Z015), the Foundation and Advanced Technology Fund of Henan Science and Technology Department (No. 11230041002) and the Program for Changjiang Scholars and Innovative Research Team in University (No. IRT1234).
| 1. |
|
| 2. |
|
| 3. |
|
| 4. |
|
| 5. |
|
| 6. |
|
| 7. |
|
| 8. |
|
| 9. |
|
| 10. |
|
| 11. |
|
| 12. |
|
| 13. |
|
| 14. |
|
| 15. |
|
| 16. |
|
| 17. |
|
| 18. |
|
| 19. |
|
| 20. |
|
| 21. |
|
| 22. |
|
| 23. |
|
| 24. |
|
| 25. |
|