
Photoelectrochemical Performance of Nb-doped TiO2 Nanoparticles Fabricated by Hydrothermal Treatment of Titanate Nanotubes in Niobium Oxalate Aqueous Solution
[Lizhen Long1, 2 , Liangpeng Wu1 , Xu Yang1 , Xinjun Li1, *  ]
]
]
|
|


Nb-doped TiO2 nanoparticles were prepared by hydrothermal treatment of titanate nanotubes in niobium oxalate aqueous solution. The effect of Nb doping and rutile content on the photoelectrochemical performance based on TiO2 powder electrodes was investigated. The results show that Nb-doped TiO2 with a small amount of rutile exhibits the enhanced photoelectric conversion efficiency for dye-sensitized solar cell. The highest photoelectric conversion efficiency of 8.53% is obtained for 1% Nb–TiO2 containing a small amount of rutile. When a small amount of rutile contained in 2% Nb–TiO2, a higher photoelectric conversion efficiency of 8.77% is achieved.
Dye-sensitized solar cells (DSSCs) based on titanium dioxide (TiO2) are considered as one of the most promising alternative to the costly traditional Si-based photovoltaic cells[ 1]. A typical DSSC comprises a dye-sensitized TiO2 electrode, a liquid redox electrolyte and a counter electrode. Under illumination, electron injection takes place from the photoexcited dye molecules to the conduction band of TiO2, and then these electrons migrate through TiO2 to the external circuit. The crystal structure, crystalline degree and electrical conductivity of TiO2 have a significant influence on electron transfer in photoanode of DSSCs.
TiO2 with high crystallinity provides high-efficiency electron transfer[ 2]. Hydrothermal method is an efficient way to obtain TiO2 with high crystallinity. Ruiz et al.[ 3] prepared anatase TiO2 by hydrothermal treatment of TiO2 gel in dilute HNO3 and found that the hydrothermal treatment greatly improved the sensor response transients. Well-crystalline TiO2 nanomaterials can be obtained by hydrothermal treatment of titanate nanotubes[ 4]. Xu et al.[ 2], [ 5] prepared TiO2 nanoparticles by hydrothermal treatment of titanate nanotubes. And the conversion efficiency of DSSCs based on titanate nanotube-derived TiO2 nanoparticles was increased compared with that of the cell based on P25. In addition, the crystal structure of TiO2 can also influence the DSSCs performance. Yun et al.[ 6] synthesized mixed-phase TiO2 by TiCl4 hydrolysis and the maximum photoelectric conversion efficiency was obtained for TiO2 with 16 wt% rutile.
TiO2 with high conductivity can also promote the electron transport within the TiO2-dye-electrolyte system and result in the improvement of DSSCs performance[ 7]. Doping with Nb is an effective way to improve the electrical conductivity of TiO2[ 8]. Up to now, methods such as powder sintering[ 9], electrochemical anodization of Ti–Nb alloys[ 10], sol–gel[ 11], [ 12] and sol–gel followed by hydrothermal[ 8], [ 13] have been used to synthesize a variety of Nb-doped nanomaterials. Lü et al.[ 13] prepared Nb-doped TiO2 by hydrothermal treatment of Nb powder and tetrabutyl titanate in hydrogen peroxide and ammonia solution, and the energy-conversion efficiency of DSSCs based on 5.0 mol% Nb-doped TiO2 is increased by 18.2% compared to that of a cell based on undoped TiO2.
Herein, we present a new method to prepare Nb-doped TiO2 nanoparticles by hydrothermal treatment of titanate nanotubes in niobium oxalate aqueous solution. The effect of doping concentration and crystal structure on the photoelectrochemical properties of Nb-doped TiO2 was also investigated.
All reagents were of analytical grade and used as received. Sodium hydroxide (NaOH, 96%), hydrochloric acid (HCl, 99%), Sodium sulfate anhydrous (Na2SO4, 99%) were obtained from Guangzhou Chemical Reagent Factory, China. Niobium oxalate was purchased from Ningxia Orient Tantalum Industry Co., Ltd, China. N-719 dyes were obtained from Solaronix, Switzerland. Chloroplatinic acid hexahydrate (H2PtCl6·6H2O, 37.5% as Pt), potassium iodide (KI), iodide (I2) and 4-tert-butylpyridine were supplied by Westingarea Corporation.
2.2.1. Hydrothermal synthesis of titanate nanotubes (TNTs)
A commercial, anatase TiO2 powder (obtained from Panzhihua Iron and Steel Group, China) was used as a starting material. The hydrothermal synthesis of titanate nanotubes (TNTs) was according to the procedure in literature[ 14]. In a typical manner, 100 mL 10 mol/L NaOH solution and 2 g anatase TiO2 powders were put into a 250 mL Teflon-lined flask. The flask was maintained at 110 °C under atmospheric pressure and magnetic stirring for 24 h. After being cooled to the room temperature, the white product was washed thoroughly with deionized water until the solution conductivity was lower than 70 μs/cm. Then the precipitate was bathed with 0.1 mol/L HCl solution for 5 h and subsequently washed by deionized water until the solution conductivity was lower than 5 μs/cm. Finally, the washed samples were dried at 80 °C for 24 h.
2.2.2. Preparation of Nb-doped TiO2 nanoparticles
TNTs and a certain amount of niobium oxalate were dispersed in 50 mL deionized water and stirred for 30 min, and then the suspension was transferred into the autoclaves and the hydrothermal reaction was carried out at 150 °C for 14 h. After the hydrothermal treatment, the powders were washed with deionized water and dried at 80 °C for 24 h. Nb-doped TiO2 nanoparticles were obtained after annealing at 400 °C for 4 h. The Nb-doped TiO2 nanoparticles, with a different weight ratio of TNTs and Nb in niobium oxalate (1:0, 1:0.001, 1:0.0025, 1:0.005, 1:0.01 and 1:0.02, respectively), are named as undoped TiO2, 0.1% Nb–TiO2, 0.25% Nb–TiO2, 0.5% Nb–TiO2, 1% Nb–TiO2 and 2% Nb–TiO2, respectively.
The morphology and energy dispersive spectroscopy (EDS) of the samples were inspected by field-emission scanning electron microscopy (FE-SEM, Hitachi S-4800). The crystalline of samples were investigated with X-ray diffraction (XRD, X′ Pert-PRO, PANalytical, Holland) recorded with 2 θ range from 10° to 80° at a scan rate of 1.5°/min. Transient photocurrent and electrochemical impedance spectroscopy (EIS) were measured in the three-electrode system linked with CHI 660A electrochemical station (CHInstruments, USA). The undoped and Nb-doped TiO2 powder electrodes were prepared by screen-printing method[ 15], and used as working electrode. A platinum sheet and a saturated Ag/AgCl electrode were used as reference electrode and counter electrode, respectively. 0.1 mol/L Na2SO4 aqueous solution was employed to serve as the supporting electrolyte.
The prepared powder electrodes with an active area of 0.5 cm × 0.5 cm were immersed in 0.5 mmol/L anhydrous ethanol solution of N-719 dye for 24 h. The counter electrodes were prepared by dip-coating 7.7 mmol/L anhydrous ethanol solution of H2PtCl6 on to fluorine-doped tin oxide (FTO) glasses. Then the dye-adsorbed powder electrode was assembled with Pt counter electrode, and the gap between the two electrodes was fixed using double faced adhesive tape. The electrolyte composed of 0.5 mol/L 4-tert-butylpyridine, 0.1 mol/L KI and 0.05 mol/L I2 in acetonitrile was introduced into the gap between the two electrodes. Photocurrent density–voltage curves of DSSCs were measured by a CHI 660A electrochemical workstation under the illumination of simulated sunlight with a 300-W xenon lamp (AM 1.5, 100 mW cm-2).
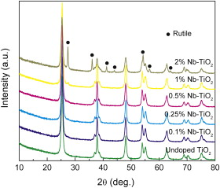
Fig. 1 shows the XRD patterns of Nb-doped TiO2 nanoparticles. For undoped TiO2, 0.1% Nb–TiO2, 0.25% Nb–TiO2 and 0.5% Nb–TiO2, the diffraction peaks match well with the pattern of tetragonal anatase (JCPDS card No. 98-000-9852). Besides the anatase phase, the peak at 27.4° corresponding to the characteristic peak of (110) crystal plane of rutile emerges in 1% Nb–TiO2. The peaks at 27.4°, 36.1°, 41.3°, 44°, 54.3°, 56.6° and 64° (marked as dark dots) attributed to that of tetragonal rutile (JCPDS card No. 98-000-9161) become obvious in 2% Nb–TiO2. The rutile content is 3 wt% and 29 wt% for 1% Nb–TiO2 and 2% Nb–TiO2, respectively, which is calculated using the following equation[ 16]
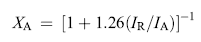
where XA is the weight fraction of anatase in the mixed-phase TiO2, IA is peak intensities of (101) crystal plane of anatase and IR is (110) crystal plane of rutile. No characteristic peaks of Nb2O5 are observed in Nb-doped TiO2, which might imply that Nb5+ is incorporated into the TiO2 lattice[ 17].
 | Fig. 1. XRD patterns of undoped and Nb-doped TiO2. |
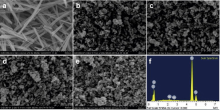
Fig. 2(a) shows the SEM image of TNTs obtained by hydrothermal treatment of TiO2 powder in NaOH aqueous solution. The uniform TNTs bunches together with length range from hundreds of nanometers to several microns. After hydrothermal treatment in deionized water, the TNTs were transformed into TiO2 nanoparticles (Fig. 2(b)). The morphology of Nb-doped TiO2 is similar to that of undoped TiO2 as shown in Fig. 2(c, d and e) for 0.1% Nb–TiO2, 1% Nb–TiO2 and 2% Nb–TiO2, respectively. And Nb presents in TiO2, which can be determined by EDS. The EDS of 1% Nb–TiO2 is shown in Fig. 2(f), and the atom ratio of Nb:Ti is 0.3:100.
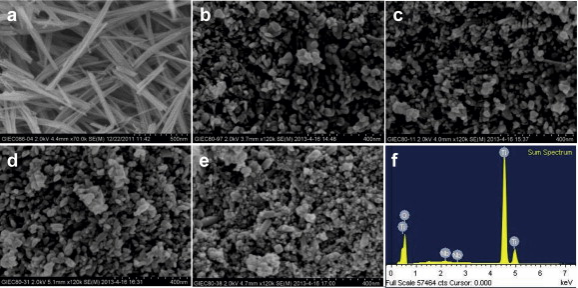 | Fig. 2. SEM images of (a) TNTs, (b) undoped TiO2, (c) 0.1% Nb–TiO2, (d) 1% Nb–TiO2, (e) 2% Nb–TiO2, and (f) the EDS of 1% Nb–TiO2. |
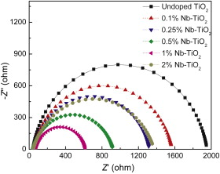
The EIS measurement was performed in the frequency range from 105 to 0.01 Hz with voltage amplitude of 0.005 V. Fig. 3 shows the Nyquist plots of undoped and Nb-doped TiO2 powder electrodes under UV illumination. A larger curvature radius usually represents a larger charge transfer resistance and a lower separation efficiency of the photogenerated electron-hole pairs[ 18]. All the circular radii of Nb-doped TiO2 are smaller than that of undoped TiO2 indicating that Nb doping suppresses the electron-hole recombination, which could be attributed to the increase of conductivity after Nb doping. The 1% Nb–TiO2 shows the smallest circular radius, indicating that it has the smallest charge transfer resistance. However, the increased circular radius of 2% Nb–TiO2 illuminated that it has a higher charge transfer resistance compared to 1% Nb–TiO2.
 | Fig. 3. EIS Nyquist plots of undoped and Nb-doped TiO2 under UV illumination. |
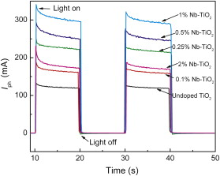
Photocurrent generation depends on electron injection, charge transfer, and charge-recombination processes[ 13]. Fig. 4 shows the transient photocurrent response of undoped and Nb-doped TiO2 powder electrode under UV illumination. The photocurrent of Nb-doped TiO2 is higher than that of undoped TiO2. The decrease of electron-hole recombination is one of the main reasons for the high photocurrent of Nb-doped TiO2. The highest photocurrent goes for 1% Nb–TiO2. And then, the photocurrent decreases for 2% Nb–TiO2 as a result of the increased charge transfer resistance.
 | Fig. 4. Transient photocurrent of undoped and Nb-doped TiO2 under UV illumination. |
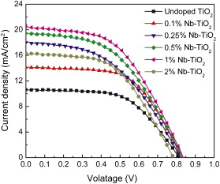
Fig. 5 shows the current density versus voltage curves of undoped and Nb-doped TiO2. The corresponding photovoltaic parameters are summarized in Table 1. Doping with Nb leads to the increase of the circuit photocurrent density Jsc. The open-circuit voltage Voc is almost the same for undoped and Nb-doped TiO2, except that the Voc for 2% Nb–TiO2 is relatively small. The fill factor (FF) decreases with the increase in Jsc, except that the FF for 1% Nb–TiO2 is relatively big. The Jsc and photoelectric conversion efficiency, η for Nb-doped TiO2 is higher than that of undoped TiO2 ( Jsc = 10.63 mA cm-2, η = 4.93%) due to the decrease of electron-hole recombination after Nb doping. The highest Jsc and η are achieved for DSSCs based on 1% Nb–TiO2 ( Jsc = 20.58 mA cm-2, η = 8.53%) powder electrode. And then, the Jsc and η% decreased for 2% Nb–TiO2 ( Jsc = 16.33 mA cm-2, η = 6.73%).
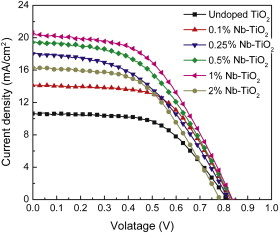 | Fig. 5. Photocurrent density–voltage curves of DSSCs base on undoped and Nb-doped TiO2. |
| Table 1. Characteristics of DSSCs based on undoped and Nb-doped TiO2 powder electrodes |
It is noticeable that 1% Nb–TiO2 with a small amount of rutile phase exhibits remarkably high photoelectric conversion efficiency, while for 2% Nb–TiO2 with 29 wt% rutile phase, the photoelectric conversion efficiency is decreased. It is deducible that a small amount of rutile in Nb-doped TiO2 is beneficial to the improvement of photoelectric conversion efficiency. In order to verify the above deduction, the hydrothermal condition of 2% Nb-doped TiO2 was used to prepare Nb-doped TiO2 with different rutile content by adjusting the pH of niobium oxalate solution. The pH of niobium oxalate solution was adjusted to 2.0, 3.0, 3.5, and 6.5 using oxalic acid aqueous solution and ammonia water, respectively. The DSSCs performance of Nb-doped TiO2 with different rutile content was investigated.
Fig. 6 shows the XRD patterns of 2% Nb–TiO2 obtained under different pH. For the sample prepared under pH = 3.5, a mixed-phase with anatase and 7.9 wt% rutile is obtained. The rutile content increased from 7.9 wt% to 29 wt% (pH = 3.0) and then to 62 wt% (pH = 2.0) with the fall of pH. For the sample prepared under weak acidic condition (pH = 6.5), pure anatase phase is obtained and the peak intensity is increased. The XRD results indicated that anatase is predominantly formed under weak acidic conditions, while rutile formed under strong acidic conditions. The results are in agreement with the result reported by Murakami et al.[ 19].
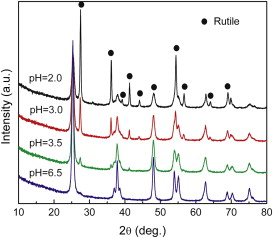 | Fig. 6. XRD patterns of 2% Nb–TiO2 prepared under different pH. |
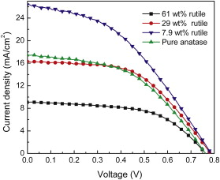
Fig. 7 shows the J– V curves of the DSSCs based on 2% Nb–TiO2 with different content of rutile, which reveals that the rutile content has a significantly influence on the performance of DSSCs. Table 2 lists the photovoltaic parameters extracted from the J– V curves. The Jsc and η is increased with the rutile content from 62 wt% ( Jsc = 8.88 mA cm-2, η = 3.9%) to 29 wt% ( Jsc = 16.33 mA cm-2, η = 6.73%) and then to 7.9 wt% ( Jsc = 26.76 mA cm-2, η = 8.77%). However, for pure anatase phase, the Jsc and η are also decreased ( Jsc = 17.99 mA cm-2, η = 6.43%) compared to that of the sample containing 7.9 wt% rutile. These results verify that a small amount of rutile in Nb-doped TiO2 is beneficial to the improvement of photoelectric conversion efficiency.
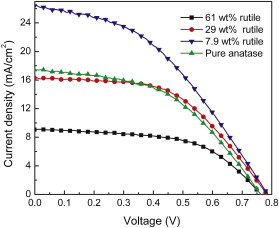 | Fig. 7. Photocurrent density–voltage curves of DSSCs base on 2% Nb–TiO2 with different content of rutile. |
| Table 2. Characteristics of DSSCs based on 2% Nb–TiO2 with different content of rutile |
Dye-sensitized semiconductor electrode with high conductivity can promote the migration of photogenerated electrons through the semiconductor to external circuit, and result in the enhancement of DSSCs performance. It is reported that the incorporation conductive materials such as carbon nanotubes[ 18] or graphene[ 20] into TiO2 could dramatically enhance the DSSCs performance. Nb doping can greatly increase the conductivity of TiO2 due to the increase of electron concentration and the enhancement of electron mobility[ 13]. Effects of low concentration doping with Nb are mostly ascribed to Nb5+ that lead to mixed Nb 4 d-Ti 3 d states close to the TiO2 conduction band[ 21]. In our experiment, the Nb incorporated into TiO2 also enhanced the DSSCs performance as shown in Fig. 5.
The performance of DSSCs is greatly influenced by rutile content in mixed-phase TiO2[ 6]. On one hand, small amounts of rutile in mixed-phase TiO2 can remarkably enhance the DSSCs performance[ 22] due to the synergistic effect of rutile and anatase. Tang et al.[ 23] proposed that the synergistic effect of mixed-phase is caused by the photogenerated electrons transfer from anatase to lower energy rutile trapping site. This electron transfer would serve to reduce the recombination rate of anatase by increasing the separation between the electron and hole. On the other hand, the excess rutile increases the formation of passive electron sink[ 24], which provides trap states for electron. Thus, more time should be spent to reach the FTO electrode due to the increase of residence time in these trap sites. Due to the synergistic effect between anatase and rutile, the highest η of 8.53% (in Table 1) is obtained for 1% Nb–TiO2 containing a small amount of rutile and a higher photoelectric conversion efficiency of 8.77% (in Table 2) is achieved for 2% Nb–TiO2 with a small amount of rutile. Whereas, the η of DSSCs based on 2% Nb–TiO2 with higher amount of rutile (29 wt% and 62 wt%) is decreased, which could be ascribed to the increase of passive electron sink. In addition, the excess rutile in mixed-phase TiO2 may decrease the electrical conductivity and result in the decrease of DSSCs performance, since the electrical conductivity of rutile is significantly lower than that of anatase[ 23], [ 25].
Nb-doped TiO2 particles are obtained by hydrothermal treatment of TNTs in niobium oxalate aqueous solution. Doping with Nb and the presence of a small amount of rutile in TiO2 can greatly improve the DSSCs performance. The highest photoelectric conversion efficiency of 8.53% is obtained for 1% Nb–TiO2 containing a small amount of rutile. And a higher photoelectric conversion efficiency of 8.77% is achieved for 2% Nb–TiO2 with 7.9 wt% rutile.
The work is supported by the National Natural Science Foundation of China (No. 51172233), the Major State Basic Research Development Program of China (“973 Program”, No. 2009CB220002), and the Key Laboratory of Water and Air Pollution Control of Guandong Province, China (GD2012A05).
| 1. |
|
| 2. |
|
| 3. |
|
| 4. |
|
| 5. |
|
| 6. |
|
| 7. |
|
| 8. |
|
| 9. |
|
| 10. |
|
| 11. |
|
| 12. |
|
| 13. |
|
| 14. |
|
| 15. |
|
| 16. |
|
| 17. |
|
| 18. |
|
| 19. |
|
| 20. |
|
| 21. |
|
| 22. |
|
| 23. |
|
| 24. |
|
| 25. |
|