
Dielectric and Ferroelectric Properties of BaTiO3 Nanofibers Prepared via Electrospinning
[Yan Wei1, *  , Yu Song
2 , Xuliang Deng1 , Bing Han1 , Xuehui Zhang2 , Yang Shen2, ** , Yuanhua Lin3 ]
, Yu Song, Yuanhua Lin|
|


BaTiO3 nanofibers of about 400 nm in diameter were synthesized via electrospinning. The evolution of the morphology and phase composition of the BaTiO3 nanofibers was studied by scanning electron microscopy and X-ray diffraction within the annealing temperature of 750e1050 o C. Higher annealing temperature led to rougher surface and better crystallization of the BaTiO3 nanofibers. Below 1050oC, the BaTiO3 nanofibers maintained its large aspect ratios and could still be regarded as individual nanofiber. The dielectric permittivities of the BaTiO3 nanofibers (εr~820) were calculated with the MG equation by considering the porous bulk specimens as composites of BaTiO3 nanofibers and air. The ferroelectric properties of the BaTiO3 nanofibers were measured by using a ferroelectric analyzer coupled with an atomic force microscope. P-E loop measured for the BaTiO3 nanofiber exhibits small hysteresis.
BaTiO3 is studied as a typical ferroelectric material with high dielectric permittivity, low dielectric loss and other excellent ferroelectric properties[ 1]. Owing to the outstanding properties, BaTiO3has been widely applied in capacitors, sensors, nonvolatile random access memory and many composites[ 2]. With their high intrinsic dielectric permittivities, the nanostructured BaTiO3 particles, such as spheres[ 3] or fibers[ 4], have also been employed as dielectric fillers in polymer composites to improve the dielectric behavior of the composites. The dielectric as well as geometric (size, shape etc) properties of the BaTiO3 particles play a critical role in determining the dielectric behavior of the polymer composites[ 5, 6]. There have also been efforts in making three-phase polymer composites filled with both BaTiO3 particles and conductive fillers. The presence of BaTiO3 nanoparticles prevents the conductive fillers from connecting into conducting paths, giving rise to lower dielectric loss. Our recent results show that a kind of three-phase polymer composite filled with BaTiO3nanoparticles and graphene nanopellets could be polarized up to 150 kV/mm without much increased leakage current[7]. Yet, BaTiO3nanofibers are considered more promising over their spherical counterparts as dielectric fillers to improve the dielectric strength of their composites with polymers under high electric field. Due to their large aspect ratios and hence larger dipolar moment along their longitudinal axis, BaTiO3nanofibers are capable of increasing the dielectric permittivity of polymer composites[ 8]. Recent studies further indicate that surface treatments of BaTiO3 nanofibers leads to stronger interfaces between the nanofibers and polymer matrix, giving rise to enhanced dielectric breakdown strength of polymer composites[ 9]. Enhanced dielectric strength of these BaTiO3nanofibers-filled polymer composites is attributed to the orientation of BaTiO3nanofibers in directions perpendicular to the external electric field. Both phase field modeling[ 6] and finite element simulation[10] indicate that the orientation of BaTiO3nanofibers is favorable for mitigating the electric field concentration in polymer matrix, which is caused by the large differences in dielectric permittivity between the BaTiO3(εr~ 1000) and polymer matrix (εr~2-3).
Electrospinning is one of the methods to fabricate onedimensional materials. It is a convenient and versatile method to produce fibers, for instance, polymer, ceramic and composite fibers[ 11, 12, 13, 14]. In this study, continuous BaTiO3nanofibers are prepared via electrospinning with solegel precursor.
Dielectric and ferroelectric properties of BaTiO3ceramics have been intensively studied and well documented. The measurements are usually performed to dense ceramics sintered at relatively high temperature. There have been very limited reports on the dielectric behavior of BaTiO3nanofibers[ 15]. Although piezoelectric force microscopy (PFM) has been employed for the measurement of the piezoelectric response of the aligned BaTiO3nanofibers[ 16], the measurement of their dielectric permittivities still requires a bulk specimen which is normally obtained through sintering at high temperature. The dielectric behavior obtained from a dense body thus could not be regarded as the intrinsic dielectric permittivities of the individual BaTiO3nanofibers. Here, in this contribution, we explored the evolution of morphology and phase composition of BaTiO3nanofibers with annealing temperature up to 1050°C, the upper limit beyond which the BaTiO3nanofibers are sintered into bundles or cluster and can’t be treated as individual nanofibers. Porous bulk specimens of the BaTiO3nanofibers are calcined at <1050 °C with their dielectric permittivities measured. The dielectric permittivities of the individual BaTiO3nanofibers are then calculated with a MaxwelleGarnett equation by considering the specimens as composites of BaTiO3nanofibers and air. The ferroelectric properties of the BaTiO3nanofibers are also investigated by using a ferroelectric test module coupled with an atomic force microscope (AFM).
The chemicals were purchased from China National Medicines Corporation Ltd. if not otherwise specified. BaTiO3nanofibers were prepared via electrospinning combined with sol-gel method. Briefly, barium acetate, tetrabutyl titanate and acetylacetone were dissolved in acetic acid at a molar ratio of 1:1:2 and stirred to get homogeneous barium titanate precursor sol. Poly (vinyl pyrrolidone) (PVP, M = 1,300,000) was added to the precursor for the control of sol viscosity. The sol was then transferred into a syringe and electrospun by applying an electric field of 1.5 kV/cm. Fibers consisting of PVP and barium titanate precursor via electrospinning were then calcined at 550 °C for 1.5 h to remove PVP. White powders were obtained. For direct comparison, BaTiO3particles were also prepared with the sol of barium titanate precursor and PVP by calcining at 550 °C for 1.5 h. Both the BaTiO3nanofibers and BaTiO3particles were annealed at 750 °C, 850 °C, 950 °C and 1050 °C for 6 h.
For the measurement of dielectric properties, the BaTiO3nanofibers were cold-pressed into pellets of 10 mm in diameter at 2 MPa. The resultant pellets were thermally treated at 750 °C, 850 °C, 950 °C and 1050 °C for 6 h, respectively. Ag paste was then painted on both sides of the pellet samples as electrodes for the measurement of dielectric properties. The apparent densities ( ρa) of the resultant sample pellets after each heat treatment were measured by Archimedes method. The theoretical densities ( ρt) of BaTiO3specimens were also determined from the XRD patterns. The relative density was then determined as ρa/ρtt.
X-Ray diffraction (XRD, Bruker D8) and scanning electron microscopy (SEM, JEOL4500) were employed to investigate the crystal structure and morphology of BaTiO3fibers and particles. Dielectric properties were measured by employing an HP 4294A precision impedance analyzer (Agilent) in the frequency range of 100 Hz to 100 MHz at room temperature. For the measurement of the ferroelectric properties, the BaTiO3nanofibers were glued to a Pt/Si substrate with silver paste as bottom electrode and grounded. The probe of the atomic force microscope (AFM, PISA XE-100) was connected to a ferroelectric test module (TF analyzer 2000, axiACCT) and used as top electrode. During the measurement, topography image of the BaTiO3nanofibers was firstly obtained by AFM image and was then used to navigate the probe to touch the top of the BaTiO3 nanofiber. The polarizationeelectric field (PeE) loops were then measured by the ferroelectric test module at 20 Hz.
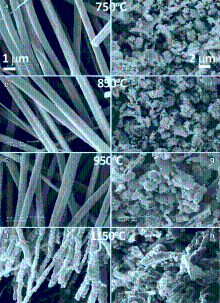
The effects of annealing temperature on the evolution of morphology of BaTiO3nanofibers are first characterized by SEM. Fig. 1(a)-(d) shows the SEM images of BaTiO3nanofibers calcined at different temperatures. As the temperature increases from 750 °C to 1050 °C, the diameter of the BaTiO3nanofibers gradually decreases from ~800 nm to ~400 nm, which is also accompanied by the change of surface morphology of the nanofibers from quite smooth at 750 °C to rather rough at 1050 °C. The morphology evolution of BaTiO3nanofibers with temperature are in line with the trend observed by others. Li et al. reported the same change in surface roughness of the BaTiO3nanofibers after annealing from 500 °C to 800 °C[ 17]. Within this temperature range, the BaTiO3nanofibers undergo the transformation from amorphous to crystalline. With the further increase of annealing temperature up to 1050 °C, the BaTiO3nanofibers begin to sinter, giving rise to even rougher surface and much less pores in the nanofibers. For comparison, the BaTiO3particles derived from the same precursor sol used in the electrospinning process are subjected to the same heat treatments with their SEM images shown in Fig. 1(e)-(h). The most distinctive change in morphology of the BaTiO3particles could be observed in the sample annealed at 1050 °C (Fig. 1(h)), where most of the particles have been sintered into large clusters.
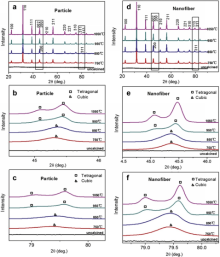
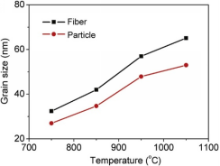
In addition to the evolution of the morphology of BaTiO3nanofibers with annealing temperature, phase transformation from cubic to tetragonal is also revealed by X-Ray diffraction patterns, as shown in Fig. 2. On the XRD patterns of samples annealed at 750 °C and 850 °C, all diffraction peaks could be assigned to cubic phase (space group: Pm3m). Further increase in the annealing temperature to 950 °C and 1050 °C leads to the phase transformation from cubic to tetragonal (space group: P4mm), as evidenced by the split of (200) and (311) peaks of cubic phase (as better distinguished in Fig. 2(b) and (c)). The same phase transformation is observed in the BaTiO3particles after the same heat treatments, with the only difference being the higher tetragonality of the BaTiO3nanofibers than that of the BaTiO3particles. As calculated from the XRD patterns, c/a ratio of BaTiO3fibers are 1.0083 at 950 °C and 1.0084 at 1050 °C, as compared with c/a of ~1.0076 at 950 °C and 1.0081 at 1050 °C for BaTiO3particles. Also It could be observed from the XRD patterns that the intensities of the (002)/(200) peaks and (113)/(311) peaks are much higher in the BaTiO3nanofibers than those in the BaTiO3particles (as shown in Fig. 2(b)-(f)), which is indicative of better crystallization after the annealing. The better crystallization of BaTiO3 nanofibers is further evidenced by their larger grain sizes as compared with the BaTiO3particles. Fig. 3 shows the variation of grain size determined from the XRD patterns with annealing temperature. As seen in both the BaTiO3nanofibers and BaTiO3particles, the grain size consistently increases with increasing annealing temperature. The grain size of the BaTiO3nanofibers is larger than that of the BaTiO3particles at all temperatures.
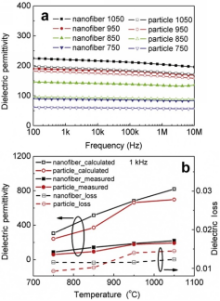
Dielectric behaviors of both the BaTiO3nanofibers and particles are measured from the porous bulk specimen. With the presence of pores in the specimen, the dielectric permittivities of these specimens are rather low, i.e., only w200 even for the specimen that has been annealed at 1050 °C. Two features can be readily observed from the frequency dependence of dielectric permittivities shown in Fig. 4(a). First, the dielectric permittivies remain stable within the frequency range of 100-10 MHz, suggesting no dielectric relaxation processes. Second, the dielectric permittivity increases with increasing annealing temperature for both the BaTiO3nanofibers and particles. In addition, the dielectric permittivities of the BaTiO3nanofibers are consistently higher than their particle counterparts at all temperatures. For the determination of dielectric permittivities of the BaTiO3nanofibers, the porous specimens are considered as composites of BaTiO3nanofibers and air. The dielectric permittivity of the BaTiO3nanofibers can then be calculated by the Maxwell-Garnett equation as[ 18]:
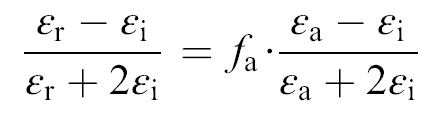 | (1) |
where εr is the apparent dielectric permittivity of the specimen, εi the intrinsic dielectric permittivity of the BaTiO3nanofibers, εa the air dielectric permittivity of ~1. fa =1 - ρa/ρt is the volume fraction of air. The intrinsic dielectric permittivities calculated by the MG equation are plotted as a function of annealing temperatures in Fig. 4(b). In general, higher annealing temperature results in higher dielectric permittivities, both for the BaTiO3nanofibers and particles. Highest dielectric permittivity of ~820 is obtained for the BaTiO3nanofibers annealed at 1050 °C, which is comparable with the dielectric permittivities of the dense BaTiO3ceramic with an average grain size of ~20 nm[ 19]. Given the larger grain size of the BaTiO3nanofibers, the dielectric permittivity of the BaTiO3nanofibers, is still much smaller than the dielectric permittivity of the well sintered BaTiO3ceramics (usually >1000)[ 20]. Two factors have to be considered when discussing these results. The first one is that the BaTiO3nanofibers are treated at temperatures much lower than the sintering temperature. The interface between the BaTiO3nanofibers and air could have adverse effects on the dielectric behavior of the specimen. Moreover, given the rather high volume fraction of air in the porous specimen, the MG equation could underestimate the real dielectric permittivities of the BaTiO3nanofibers[ 18]. The dielectric permittivities thus determined should be considered as the lower limit for the intrinsic dielectric permittivities of the BaTiO3nanofibers.
Fig. 5 shows the polarizationeelectric field (P-E) loop for the BaTiO3nanofiber.The P-E loop exhibits very small hysteresiswith almost linear dependence of P(E), more of the paraelectric behavior than ferroelectric. The strong suppression of macroscopic ferroelectric character for the BaTiO3nanofibers could be attributed to the following causes. First, the frozen domain structure under an external field owing to the effects exerted by the grain boundaries, such as the clamping of the domain walls and the hindrance of polarization switching, plays a key role in the suppression of ferroelectric hysteresis and switching[ 21]. Next, the depolarization field originated by the low permittivity nonferroelectric grain boundaries can cause a significant reduction of polarization[ 22]. It is also worth noting that the PeE loop obtained in this manner only represents the polarization behavior in the direction of the short axle of the BaTiO3nanofibers. With the large differences in the depolarization field along the longitudinal direction and the lateral directions of the BaTiO3nanofibers, as calculated byWang et al.[ 6], the polarization behaviors of the BaTiO3nanofibers along the longitudinal direction might be much different.
 | Fig. 1 SEM images of the BaTiO3nanofibers/particles calcined at 750 °C (a and e), 850 °C (b and f), 950 °C (c and g) and 1050 °C (d and h) for 6 h. |
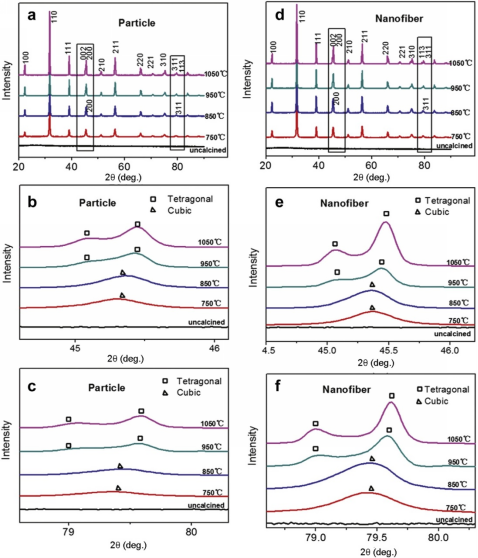 | Fig. 2 X-Ray diffraction patterns for the BaTiO3 nanofibers (a) and the BaTiO3 particles (b) after annealing at different temperatures. The phase transformation from cubic to tetragonal is better distinguished by the splitting of (200) peak into (200)/(002) peaks (c & d) and (311) peak into (311)/(113) peaks (e & f). |
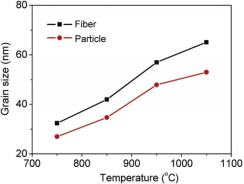 | Fig. 3 Variation of the grain sizes of BaTiO3 nanofibers and particles with annealing temperatures. |
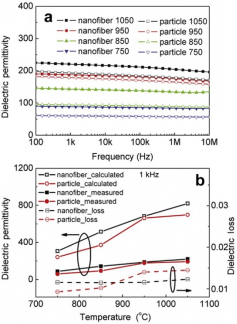 | Fig. 4 (a) Dependences of dielectric permittivity on frequency from 100 Hz to 10 MHz of BaTiO3 nanofibers and particles after annealing at different temperatures. (b) Dielectric permittivities calculated by the MG equation for BaTiO3 nanofibers and particles after annealing at different temperatures at 1 kHz. The variation of dielectric loss with annealing temperatures is also superimposed. |
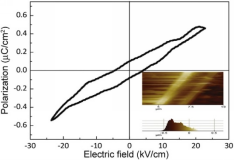 | Fig. 5 Polarizationeelectric field loop for the BaTiO3 nanofiber annealed at 1050 SOHC. The inset shows the topography image of the BaTiO3 nanofiber measured. |
In summary, BaTiO3nanofibers of diameters around 400 nm are synthesized via electrospinning, and their dielectric and ferroelectric properties are investigated. Below 1050 °C, BaTiO3nanofibers maintain its large aspect ratio and still can be regarded as individual fiber. BaTiO3nanofibers are better crystallized as compared with the BaTiO3particles after the same heat treatments. The dielectric permittivities of the BaTiO3nanofibers are calculated with the MG equation by considering the porous bulk specimens as composites of BaTiO3nanofibers and air. The P-E loop measured for the BaTiO3nanofiber exhibits small hysteresis. Further investigation is still needed for the determination of the polarization behavior of the BaTiO3nanofibers along their longitudinal direction.
The authors acknowledge financial supports from the National Basic Research Program of China (No. 2012CB933900), the Key Technologies R&D Program of China (No. 2012BAI07B00), the National High Technology Research and Development Program of China (No. 2011AA030100) and the Foundation for the Authors of National Excellent Doctoral Dissertations of China (Grant No. 201144), Beiing Nova Program (Grant No. XX2013037) and Tsinghua University (Grant No. 20121087925).
| 1. |
|
| 2. |
|
| 3. |
|
| 4. |
|
| 5. |
|
| 6. |
|
| 7. |
|
| 8. |
|
| 9. |
|
| 10. |
|
| 11. |
|
| 12. |
|
| 13. |
|
| 14. |
|
| 15. |
|
| 16. |
|
| 17. |
|
| 18. |
|
| 19. |
|
| 20. |
|
| 21. |
|
| 22. |
|