Structure Heterogeneity in Metallic Glass: Modeling and Experiment
Ke H.B., Zeng J.F., Liu C.T., Yang Y.* 
Structure Heterogeneity in Metallic Glass: Modeling and Experiment |
|
Ke H.B., Zeng J.F., Liu C.T., Yang Y.
|
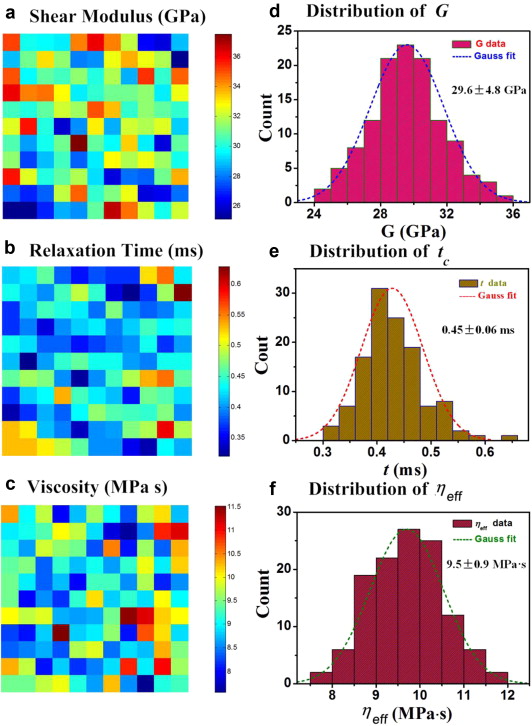
| Fig. 5. Mapping of a local shear modulus, b local relaxation time and c local viscosity of the Zr-based BMG at the indentation load of 800 μN and the scanning space of 100 nm. On the right are the corresponding statistical distribution of d local shear modulus, e local relaxation time and f local viscosity. The dashed lines are the Gaussian fitting to the experimental data. |
| |