Structure Heterogeneity in Metallic Glass: Modeling and Experiment
Ke H.B., Zeng J.F., Liu C.T., Yang Y.* 
Structure Heterogeneity in Metallic Glass: Modeling and Experiment |
|
Ke H.B., Zeng J.F., Liu C.T., Yang Y.
|
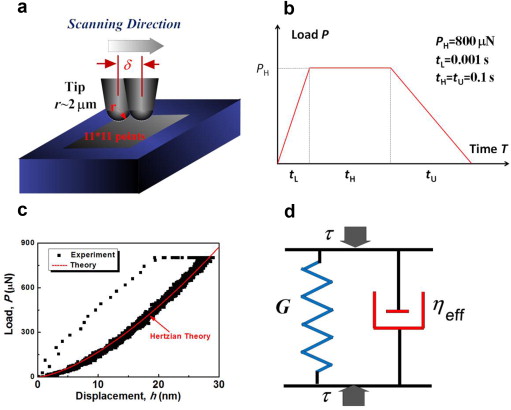
| Fig. 4. a Schematic illustration of the scanning nanoindentation test to map out the structural heterogeneity in a BMG, b the sketch of the indentation load function, c the representative nanoindentation P–h curves obtained at P H = 800 μN, showing the anelastic deformation in the Vit105 BMG. The Hertzian curve red line corresponds to the indenter tip radius of 2 μm, shear modulus of 30 GPa and Poisson's ratio of 0.363 for Vit105, d the sketch of the effective Kelvin model. |
| |