A Diagram for Glass Transition and Plastic Deformation in Model Metallic Glasses
Gao X.Q., Wang W.H.*  , Bai H.Y.
*
, Bai H.Y. 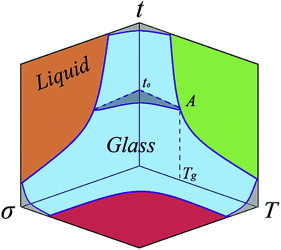
A Diagram for Glass Transition and Plastic Deformation in Model Metallic Glasses |
|
Gao X.Q., Wang W.H.
, Bai H.Y. |
| Fig. 4. Schematic 3D glass transition diagram involved in observation time t , temperature T , and stress σ for MGs. Data from the strain rate induced glass transition in SrCaYbMgLiZnCu MGs are used to construct the phase diagram. This diagram is a compendium of various MG systems. The glass region, near the origin, is enclosed by the depicted concave surfaces. |
| |