A Diagram for Glass Transition and Plastic Deformation in Model Metallic Glasses
Gao X.Q., Wang W.H.*  , Bai H.Y.
*
, Bai H.Y. 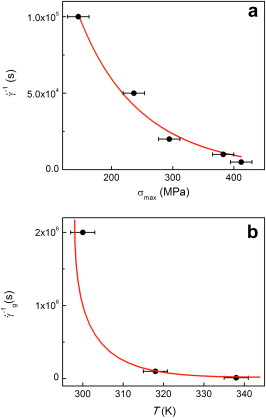
A Diagram for Glass Transition and Plastic Deformation in Model Metallic Glasses |
|
Gao X.Q., Wang W.H.
, Bai H.Y. |
| Fig. 3. a Maximum yield stress vs. the inverse strain rate in the Sr 20 Ca 20 Yb 20 Li 0.55 Mg 0.45 20 Zn 20 MG. b Temperature vs. γ ˙ g for Sr 20 Ca 20 Yb 20 Mg 20 Zn 10 Cu 10 MG. The curves are guide to the eyes. |
| |