A Diagram for Glass Transition and Plastic Deformation in Model Metallic Glasses
Gao X.Q., Wang W.H.*  , Bai H.Y.
*
, Bai H.Y. 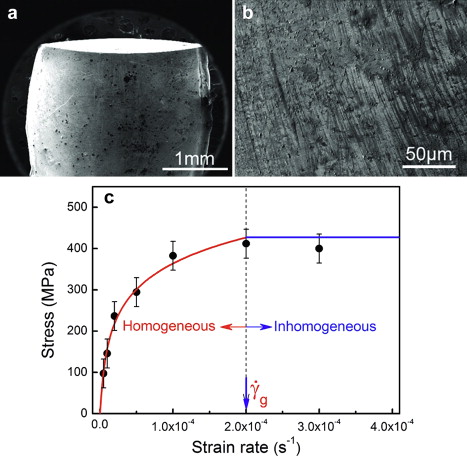
A Diagram for Glass Transition and Plastic Deformation in Model Metallic Glasses |
|
Gao X.Q., Wang W.H.
, Bai H.Y. |
| Fig. 2. a Macroscopic and b microscopic SEM image of about 50% heavily deformed Zn 20 Ca 20 Sr 20 Yb 20 Li 0.55 Mg 0.45 20 MG. No shear bands and micro cracks can be found, indicating the homogeneous deformation of the glass. c The diagram of brittle to homogeneous flow translation induced by strain rate in the MG, plotting the maximum yield stress vs. the applied strain rate during compression. A well-defined transition from supercooled liquid state to glassy state can be found as γ ˙ reached a constant value. And a critical strain rate γ ˙ g , which is equivalent to T g exists. The curves are guide to the eyes. |
| |