A Diagram for Glass Transition and Plastic Deformation in Model Metallic Glasses
Gao X.Q., Wang W.H.*  , Bai H.Y.
*
, Bai H.Y. 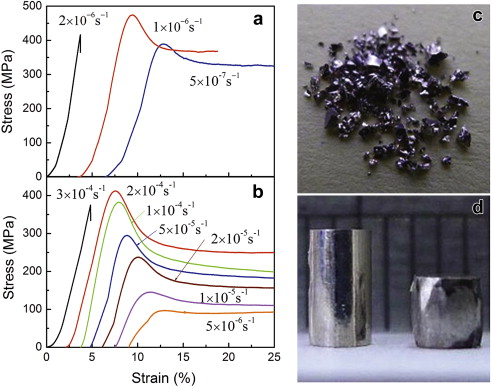
A Diagram for Glass Transition and Plastic Deformation in Model Metallic Glasses |
|
Gao X.Q., Wang W.H.
, Bai H.Y. |
| Fig. 1. Compressive stress–strain curves at different strain rates of a Sr 20 Ca 20 Yb 20 Mg 20 Zn 20 and b Sr 20 Ca 20 Yb 20 Li 0.55 Mg 0.45 20 Zn 20 MGs; c pictures of brittle behavior above γ ˙ g and d homogeneous deformation behaviors about 50% deformed below the critical strain rate for Sr 20 Ca 20 Yb 20 Mg 20 Zn 20 MG. |
| |