


Preparation and Structural Characterization of Rapidly Solidified Al–Cu Alloys
[Lichioiu Iuliana1 , Peter Ildiko2 , Varga Bela1, *  , Rosso Mario
2 ]
, Rosso Mario|
|


Rapidly solidified Al100-
Nowadays, the reductions of energy consumption and emission of greenhouse gasses are very important issues in many applications. The most commonly used light materials for manufacturing components for automotive and aeronautical parts are aluminum, magnesium, and their alloys. The research communities in cooperation with manufacturing industries are oriented toward new products using innovative materials and/or novel procedures. According to the results obtained till today, it has been possible to enlarge the series of the alloys jointly with the manufacturing routes [1], [2], [3], [4] and [5].
At the same time, materials with metastable structures play an important role in the infrastructure of modern civilization [6]. Research in this area has been intensified after 1960, when Duwez et al. [7] discovered the possibility of obtaining metastable structures by applying high cooling rates during the liquid–solid phase transformation. By intensifying the cooling rate, both structure refinement and solubility extension of alloying elements into the matrix have been achieved. Both wrought and foundry Al–Cu alloys have been widely used in such techniques due to their high mechanical properties maintained still after aging treatment application. Al–Cu alloys with higher Cu contents are limited due to the θ-Al2Cu intermetallic phase formation which causes the alloy fragility. Following liquid quenching process, some structural changes have been produced with higher influence on the properties of Al–Cu alloys rich in Cu [8] and [9].
Recent studies have extensively been reported on the investigation of rapidly solidified materials with modified microstructures, compositions and properties [10], [11] and [12].
Melt spinning is a commonly used technique to produce rapidly solidified alloys, developing a fine-grained microstructure with a minor content of segregation. The precipitation of a supersaturated solid solution obtained by melt spinning technique is usually accompanied by the recrystallization stage and influences the aging microstructures and the related properties. In addition to Al-based alloys, the mutual actions between precipitation and recrystallization have also been investigated for Mg, Fe, Cu and Ni-based alloys [13] and [14].
According to some studies on Al–Cu alloys [15], [16], [17] and [18], many processing parameters are very important during the melt spinning procedure. The most important of them are the melting crucible type, the cavity environment, the melt superheat, the diameter of the melt ejection nozzle, the pressure and head of the melt expulsion, etc. The heat transfer between the wheel and the ribbon together with their properties, like thickness, roughness, hardness, structural homogeneities of the ribbons, gas turbulence around the pool, the wheel substrate material, the wheel rotation speed, as a function of the solidification condition play a specific role in the final properties of the obtained material. Other researchers reported the possibility to produce nanoporous copper ribbons starting from Al–Cu bands by free corrosion de-alloying procedure prepared by single-roller melt spinning equipment for precursor samples [19]. Moreover, an expansion of the alloys compositions through the metastable structures formation has been given at industrial levels [6].
In this work, hypo- and hypereutectic Al–Cu alloys have been considered and the experimental results obtained by melt spinning-low pressure (MS-LP) processing are presented and analyzed. Structural changes caused by the solubility extension of Cu in α-Al solid solution after liquid quenching are discussed. The alloys obtained by high cooling rate are studied by X-ray diffraction (XRD) analysis, optical microscopy (OM), scanning electron microscopy (SEM) and energy-dispersive spectroscopy (EDS) technique, dilatometric and differential scanning calorimetry (DSC) measurements followed by the comparison of the data with those obtained by using metallic die.
The chemical composition of the investigated Al–Cu alloys is listed in . Al–35 wt% Cu alloy was acquired as a master alloy, while the other four alloys were obtained in an electric furnace using pure Al (99.5%) and the aforementioned master alloy.
| Table 1. Chemical composition of studied alloys (wt%) |
Different cooling rates were forced by employing two types of pouring methods, namely gravity casting and melt spinning techniques. Gravity casting was realized by employing metallic die (14 mm × 80 mm × 160 mm). The cooling rates from liquid state were measured, based on the cooling curves obtained for each pouring step by gravity method. For recording the cooling curves an EBI-2T-1202-type-K logger was employed: a K-TPN-101 coaxial thermocouple with an outer diameter of 0.6 mm was used as sensor. The cooling rate obtained for this kind of casting method was 32 °C/s.
The liquid quenching of Al–Cu melts was realized by using a self-designed melt spinning device. The estimated cooling rate corresponded to 105–106 °C/s. The cooling rate value ( v) for the modified melt spinning device was estimated based on the relation d = A· v- n [20], where d is the secondary dendrite arm spacing (SDAS), A and n are constants.
The annealing heat treatment ( TO) of the obtained ribbons was carried out for 14 h, including a heating to 500 °C, maintenance at the maximum temperature for 2 h and followed by a cooling at a slow cooling rate in furnace.
Structural and morphological characterizations were performed by OM (NIKON Eclipse MA100) and SEM (LEO 1450VP). Vickers microhardness measurements were performed using an AHOTEC FM-700 device. For each type of alloy, 30–50 measurements were performed using 0.98 mN (for global hardness measurement of gravity cast and ribbons samples) and 0.098 mN (for the determination hardness of α-Al phase from gravity cast samples), for 15 s.
Structural transformation was monitored by DSC (Netzsch Maia F3 200) and dilatometric analysis (DIL, Linseis L75) with a heating rate of 10 °C/min. Both thermal analysis devices were previously calibrated. XRD technique was used by using Brucker diffractometer with a scanning rate of 1°/min and 2 θ of 20°–90° using a Co anode with a wavelength λ = 0.1789 nm.
The liquid quenching was performed by employing an own developed and built melt spinning device. In the following, a short description of the device was realized to identify the differences between the present device and the well-known melt spinning method.
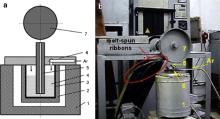
The experimental device ( Fig. 1) has the advantages to combine the cooling technology of the melt jet on spinning disc with the principle of the molds feeding from low pressure casting technology. In the case of low pressure casting technology, the transfer of the liquid metal from the furnace to the die cavity sited on the top of the furnace is ensured by an overpressure which acts on the liquid alloy. In this working method the crucible has to be placed in a hermetically sealed position. Therefore the liquid metal is forced to go vertically through the connecting tube. In the case of the experimental device indicated in Fig. 1, the working gas (Ar) introduced by the cover (6) acts upon the liquid metal (4) from the crucible (3) causing the fused metal raising in the feeding tube (5) followed by the melt placement on the rotating disc. The furnace and port-crucible are denoted by (1) and (2), respectively.
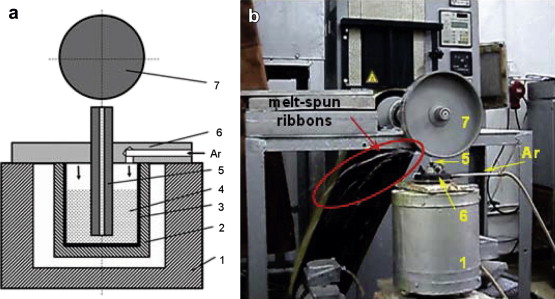 | Fig. 1. Experimental device for obtaining of melt-spun ribbons: (a) schematic plant, 1—furnace, 2—support of the crucible, 3—graphite crucible, 4—liquid metal alloy, 5—connecting part, 6—cover part, 7—spinning disk, (b) melt spinning-low pressure (MS-LP) device during processing. |
The diameter of the feeding tube (5) is 1 mm and the distance to the disc is 5 mm. The disc rotation speed is 2600 r/min and the working gas pressure is 1.5 bar (1.5 × 10⁵ Pa). The aforementioned parameters have an important role, since they establish the thickness of the ribbons.
The cooling rate was assessed previously during the processing of Al–Si and Al–Cu alloy systems, for which the coefficients n and A from the Eq. are as follows [20] and [21]:
where d is the secondary dendrite arm spacing (SDAS, μm), vis the cooling rate (°C/s).
The value of the cooling rate is within the limits of 105–106 °C/s. Al100- x–Cu x ( x = 5, 10, 15, 25, 35 wt%) alloys were prepared using the MS-LP device. Ribbons with thickness of 30–70 μm, width of 4–5 mm and length of 0.03–2 m were obtained ( Fig. 2). For the Al–5 wt% Cu alloy, samples with 3 cm in length were obtained.
 | Fig. 2. Obtained melt-spun ribbons. |
Compared to the well-known melt spinning technique, the MS-LP device presents some advantages as follows: (a) the feeding of the liquid metal from the bottom is easier to be realized; (b) the overheating of the melt can be realized; (c) the size of the nozzle under the rotating disc can be modified easier; (d) the presence of the tube immersed in the liquid alloy offers the possibility to obtain the alloy with no contamination, i.e. metallic and/or non-metallic solid inclusions; (e) from economical point of view, such a process represents a low-cost manufacturing option.
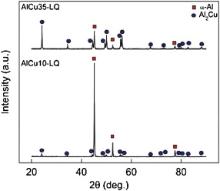
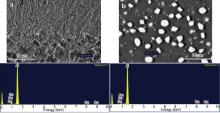
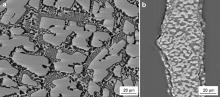
Fig. 3 shows the XRD patterns for Al100- x–Cu x ( x = 10, 35 wt%) alloys ribbons. MS-LP processing did not cause the appearance of new phases compared to those indicated in the Al–Cu diagram. Only XRD profiles for Al–Cu alloys with extreme concentration were reported. In this case, the microstructure consists of two phases, i.e. α-Al and Al2Cu phases. The Al–5 wt% Cu alloy is characterized only by a supersaturated α-Al solid solution. Structural characterization performed on the Al–10 wt% Cu ribbon alloys obtained by MS-LP method, indicates the grain refinement, as shown in Fig. 4. The SDAS value is about 25 μm ( Fig. 4(a)), for as-cast Al–10 wt% Cu alloy. For the as-ribbon alloy, the same parameter has an average value of 0.06 μm. By considering the SDAS parameter for the as-cast Al–10 wt% Cu alloy, the value of n exponent from Eq. is 0.33, being in a good agreement with literature [22]. The morphology of θ phase evolves to a globular shape after TO annealing heat treatment; the dimension of such phases varies between 2 and 3 μm as indicated in Fig. 4(b). The structures of 15 and 25 wt% Cu alloys are similar to the Al–10 wt% Cu, but with a higher amount of the Al2Cu phase. The size of Al2Cu particles does not exceed 4 μm after the annealing process. Compositional analysis carried out on the alloys with 10 wt% Cu indicates an increase of Cu solubility in the matrix till to 3.38 wt% ( Fig. 5(a)). For Al–10 wt% Cu melt-spun ribbons subjected to annealing treatment, the concentration of Cu in α-Al decreases to about 1.74 wt% ( Fig. 5(b)).
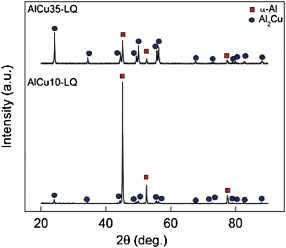 | Fig. 3. XRD profiles of the ribbons obtained by MS-LP for Al100- x–Cu x ( x = 10, 35 wt%). |
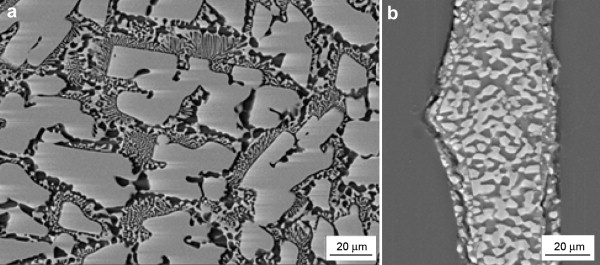
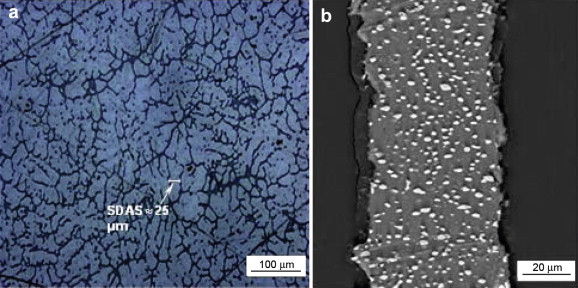 | Fig. 4. Al–10 wt% Cu alloy structure: (a) as-cast in metallic die (OM), (b) ribbon after TO annealing treatment (SEM). |
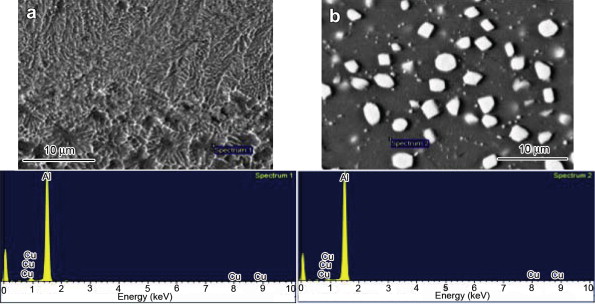 | Fig. 5. SEM images and EDS spectra of Al–10 wt% Cu alloy: (a) ribbon obtained by MS-LP technique, (b) annealed melt-spun ribbon at TO condition. |
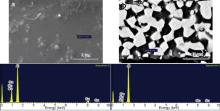
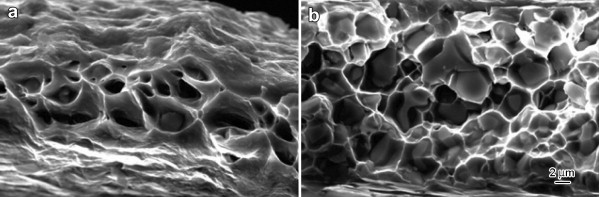
Microstructural observation performed on Al–35 wt% Cu melt-spun ribbons reveals both qualitative and quantitative transformations, as shown in Fig. 6. Investigation of Al–35 wt% Cu melt-spun ribbons obtained by a liquid quenching technique highlights the presence of elongated structural formations. This structural change, compared to the same alloy obtained by gravity casting technique ( Fig. 6(a)), is also confirmed by fracture surface analysis. The fractographs shown in Fig. 7(b) are in accordance with the observations verified in literature [6]. The development of these types of crystals requires high growth rates in certain crystallographic directions, which avoids the reorganization of the alloying elements during the phase transformation. After annealing of 35 wt% Cu melt-spun ribbons, the dimensions of the intermetallic particles (Al2Cu) are 4–5 μm, as shown in Fig. 6(b). In addition, due to the elongated morphology of these crystals obtained by MS-LP, the brittleness of Al–35 wt% Cu melt-spun ribbons is higher than that of 10 wt% Cu melt-spun ribbons, as indicated in Fig. 7(a) and (b), being in according to the statement in literature [9].
 | Fig. 6. SEM images of Al–35 wt% Cu alloy structure: (a) as-cast in metallic die, (b) ribbon after TO annealing treatment. |
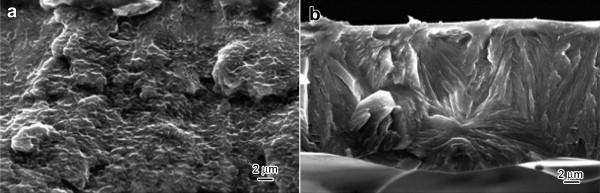 | Fig. 7. SEM fractographs of Al–Cu alloys obtained by MS-LP: (a) Al–10 wt% Cu, (b) Al–35 wt% Cu ribbons. |
Comparisons of the as-obtained melt-spun ribbons and the annealed samples were carried out. EDS analysis of Al–35 wt% Cu melt-spun ribbons indicates a concentration of 25.51 wt% Cu in the α-Al solid solution ( Fig. 8(a)). For the following annealing treatment a clear evidence of the Al2Cu particles is observed with a decrease of Cu in α-Al to a value of 2.48 wt% ( Fig. 8(b)).
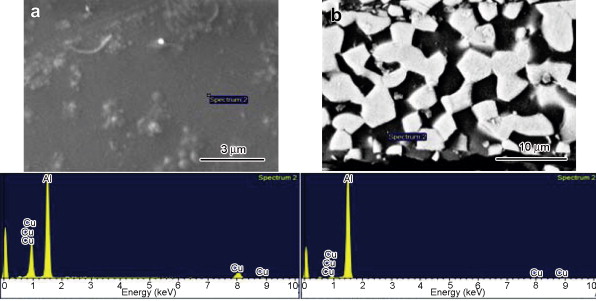 | Fig. 8. SEM images and EDS spectra of Al–35 wt% Cu alloy: (a) ribbon obtained by MS-LP technique, (b) annealed melt-spun ribbon at TO condition. |
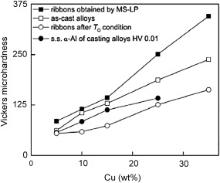
Microhardness measurements ( Fig. 9) provide additional information to the structural characterization of the obtained alloys. The microhardness values were obtained after 50 measurements for each sample. In the case of the α-Al phase of the as-cast alloys in metallic die 30 indentations were performed. The average value of microhardness for the intermetallic phase θ (Al2Cu) is 410 HV and seems to be independent on the manufacturing conditions. The microhardness value of α-Al depends on the concentration of Cu retained in the solid solution.
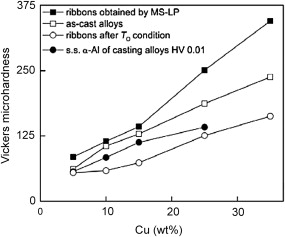 | Fig. 9. Microhardness evolution in Al–Cu alloys. |
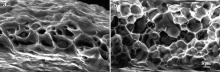
Composite type structures (intermetallic compound θ embedded in α-Al matrix) were obtained after annealing heat treatment of the melt-spun ribbons and they have good plasticity properties demonstrated from the fracture surface morphology ( Fig. 10). The fractographs highlight a ductile type of the fracture contrary to those obtained by MS-LP method ( Fig. 7).
 | Fig. 10. SEM fractographs of Al–Cu alloys after TO annealing of ribbons: (a) Al–10 wt% Cu, (b) Al–35 wt% Cu. |
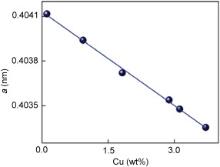
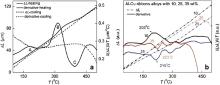
During the heat treatments of Al–Cu alloys a variation of the Cu concentration in α-Al solid solution takes place, having a direct effect on the lattice constant for the elementary cell of Al as shown in Fig. 11<xref ref-type="bibr" rid="R23">[23]. By dilatometric analysis the evolution of the above mentioned structural transformation can be evaluated. Dimensional changes caused by the alloying element are clearly highlighted on the derivative curves of length expansion or contraction. In Fig. 12(a), dilatation–contraction curves and their derivatives for as-cast Al–10 wt% Cu alloy are presented. The analyses were carried out on the samples of 10 mm in length. The contraction curve was registered at a cooling rate of 5 °C/min. Precipitation stages in Al–Cu alloys are as follows: supersaturated solid solution (SSS) → GP zones → θʺ → θʹ → θ, where GP zones are Cu Guinier-Preston zones, θʺ and θʹ are Al2Cu metastable phases, and θ is the equilibrium phase [22], [24] and [25].
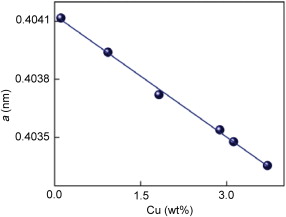 | Fig. 11. Lattice parameter at 25 °C depending of the Cu concentration in Al. |
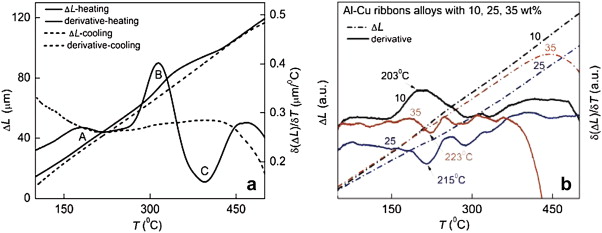 | Fig. 12. DIL analyses: (a) dilatation–contraction curves and their derivatives for Al–10 wt% Cu alloy as-cast in metallic die, (b) dilatation curves and their derivatives for Al–Cu alloys with 10, 25, 35 wt% Cu obtained by MS-LP. |
In Fig. 12(a), the peak at about 180 °C, labeled as A, corresponds to the formation of the metastable precipitate θʺ. This precipitate within the α-Al phase has a determinant role to enhance the mechanical properties by artificial aging [24] and [26]. Furthermore, the peak at about 320 °C, labeled as B, corresponds to the formation of θʹ precipitate, while the peak at about 400 °C (C) corresponds to the formation of the stable θ phase that occurs at the solid solution crystals limit. On the derivative contraction curve no significant peaks can be observed, therefore during the cooling of the alloy no important phase transformation occurs. For dilatometric analysis, the melt-spun ribbons were placed in two sintered alumina cylinders with diameter of 6 mm and length of 8 mm. The dilatometric curves and their derivatives for Al-based alloy with 10, 25, 35 wt% Cu are shown in Fig. 12(b). Due to the working conditions, the y-axis in Fig. 12(b) is presented without value. Due to the high cooling rate in the case of Al–10 wt% Cu melt-spun ribbons, a decrease from 320 to 203 °C is observed which corresponds to the formation of θʹ precipitate. For the alloys containing more Cu, i.e. 25% and 35 wt%, respectively, the peaks on the derivative heating curves at about 220 °C correspond to the decomposition of the supersaturated solid solution with the formation of stabile Al2Cu phase.
DSC analysis results for the melt-spun ribbons with 15, 25, 35 wt% Cu are shown in Fig. 13. The temperature and transformation type for the precipitation stages of Al–25 wt% Cu melt-spun ribbons (curve 1 from Fig. 13) are shown in . In the case of the Al-based alloys with 15 and 35 wt% Cu (curves 3 and 2 from Fig. 13) only the peaks corresponding to Al2Cu stable phase formation are recorded.
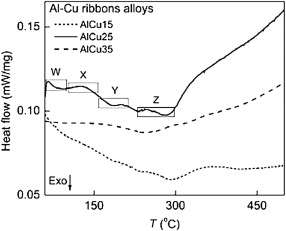 | Fig. 13. DSC curves of Al–Cu alloys with 15, 25, 35 wt% Cu obtained by MS-LP. |
| Table 2. Precipitation stages in Al–25 wt% Cu melt-spun ribbons |
Significant structural changes, namely appearance of α phase, were obtained in hypereutectic Al–Cu alloy produced by MS-LP technology. Applying a liquid quenching technique on in-house realized MS-LP equipment, increased solubility of Cu in Al matrix to a value of 25.51 wt% in the case of Al–35 wt% Cu. After annealing treatment applied to melt-spun ribbons for the considered Al–Cu alloys, the coarse separations of the intermetallic phase (Al2Cu) were observed which were embedded into the Al matrix with high plasticity and low content of Cu. Due to a grain refined structure of the melt-spun ribbons, Al2Cu incoherent phase was uniformly distributed in the annealed ribbons.
This work was supported by the Sectoral Operational Programme Human Resources Development (SOP HRD), ID59321 financed from the European Social Fund and by the Romanian Government.
| 1. |
|
| 2. |
|
| 3. |
|
| 4. |
|
| 5. |
|
| 6. |
|
| 7. |
|
| 8. |
|
| 9. |
|
| 10. |
|
| 11. |
|
| 12. |
|
| 13. |
|
| 14. |
|
| 15. |
|
| 16. |
|
| 17. |
|
| 18. |
|
| 19. |
|
| 20. |
|
| 21. |
|
| 22. |
|
| 23. |
|
| 24. |
|
| 25. |
|
| 26. |
|