


Ce-substituted Lithium Ferrite: Preparation and Electrical Relaxation Studies
[Mohanty Viswarupa, Cheruku Rajesh, Vijayan Lakshmi, Govindaraj G.*  ]
]
]
|
|


Ce-substituted lithium ferrite, Li0.5Ce
The field of ferrites is very significant due to their various potential applications and interesting physics involved in it. Among the ferrites, Inverse spinel lithium ferrite Li0.5Fe2.5O4 has drawn the attention from a long time due to its prolonged applications in various microwave devices and memory core systems [1]. Along with high Curie temperature, square loop properties, high saturation magnetisation, thermal stability and safety of lithium ferrite make this material suitable for application in Li-ion batteries as a cathode material [2] and [3]. Recently, a lot of progress has been seen to understand various physical phenomena involved in mixed ferrites, particularly in mixed lithium ferrites [4], [5], [6], [7], [8] and [9]. It has been reported that properties such as thermal and electrical conductivity and electromagnetic behaviour could be enhanced by substituting them with rare earth elements [10] like La3+, Gd3+, Nd3+ etc. The lithium ferrite spinel contains reducible iron ions and lithium ions and therefore, it is expected that this material exhibit both electronic and ionic conductivities.
Solution combustion technique is a versatile method for preparation of nano-crystalline materials at low temperature with a single pure phase [11]. In the present work, we have focused on the preparation and electrical relaxation studies of Ce-substituted lithium ferrite by the solution combustion technique. Literature survey has confirmed that there is no information available on the synthesis, characterization and electrical properties of inverse spinel type Ce-substituted lithium ferrite systems. Recently some workers have reported about the microwave and dielectric properties of the Ce-substituted lithium ferrite [12] and [13]. The phase composition and microstructure of Li0.5Ce xFe2.5- xO4 were characterized by X-ray diffraction (XRD) analysis and Fourier transform infrared spectroscopy (FTIR). A thorough study on electrical properties has been reported in terms of impedance and modulus. Since there is no dispersive feature below 200 °C in the frequency window of 102–107 Hz, the electrical properties has been reported in terms of impedance and modulus in the temperature range of 473–573 K only. The results so obtained have been discussed and the various conclusions drawn have also been presented.
Self propagating, simple and cost effective solution combustion process is a potential technique for preparation of a variety of phase pure nano-crystalline materials. This method provides an easy alternative for the preparation of nano-crystalline materials at low temperature and in a short time, i.e. homogeneous single phase can be obtained at low temperature [11].
According to stoichiometric composition of Li0.5Ce xFe2.5- xO4 ( x = 0.0, 0.05 and 0.1), specified molar amount of nitrates LiNO3, Fe(NO3)3·9H2O and Ce(NO3)3·6H2O were dissolved in a citric acid aqueous solution under stirring. In the present case, fuel (F) to oxidizer (O) ratio is maintained unity i.e. 1 = O/(- n)F, where n is molar fraction of fuel, in order to maximize the energy released during the combustion process [14], [15] and [16]. Here, all metal nitrates act as oxidizing agent and the fuel citric acid as a reducing agent for the combustion reaction. Hence, the stoichiometric composition of the redox mixture requires n = 2.2 mol of citric acid [17]. After a homogeneous transparent solution was achieved within few minutes, an appropriate amount of ammonia hydroxide solution was added to the solution to adjust the pH value to about 8 to avoid precipitate formation. After the formation of viscous liquid, it was kept in a heating mantel and evaporated to produce sample in powder form. The overall reaction for the sample is:
The thermal decomposition processes of the powder were characterized using thermogravimetry–differential thermal analysis (TG–DTA) instrument (Model: Q600 SDT) from TA instruments under nitrogen flow. The XRD patterns of 900 °C sintered pellets were obtained for the sample using X'pert PANalytical X-ray diffractometer with monochromatic Cu- Kα radiation at glancing angles in the range of 2 θ from 10° to 80° in a step size of 0.02°. FTIR were recorded using Thermo Nicolet made spectrometer (Model: 6700). The spectrum was recorded between 400 cm-1 and 1300 cm-1 using KBr as the diluting agent. Before carrying the electrical measurements, the pellets were sintered at 900 °C for 12 h. The densities of the compositions were measured by Archimedes principle and the parallel and opposite sides of the pellets were painted with silver paint. The electrical properties were measured using a Material Mates Impedance Analyzer 7260, in the temperature range of 473–623 K, measuring the real and the imaginary part of the sample impedance in the frequency range of 102–107 Hz.
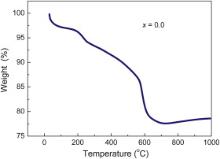
The samples by autocatalytic combustion process of the prepared sample were investigated by thermal gravimetric analysis (TGA). Fig. 1 shows the TGA result conducted on the powder of prepared samples for x = 0.0. From the analysis of TG data, three obvious mass losses were observed with a total weight loss of 23%. An extremely weak mass loss of around 3% is observed before 100 °C due to the evaporation of water vapours. In the second step of weight loss, the weight loss is around 10% ascribed to the decomposition of organic fuel/complexing agent and nitrates at 250–580 °C. In the third step, weight loss is found to be around 10% due to phase formation of the material at 580 °C because of decomposition of nitrates into oxides. A subsequent minor weight loss occurred after this range and then it became constant due to the phase formation. That means that the precursor generates a stable phase after the heat-treatment at higher than 600 °C. Also, from the TGA curve, it is seen that after 700 °C, there is a little increase in weight observed (∼1%) upto 1000 °C. This little increase might be due to the oxidation process involved at particular temperature [17]. Similar behaviour has been seen for x = 0.05.
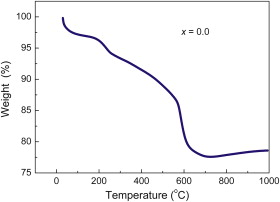 | Fig. 1. Typical thermogram for Li0.5Ce xFe2.5- xO4. |
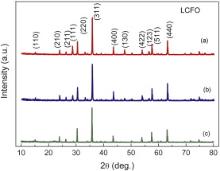
Fig. 2 illustrates the XRD patterns of the different compositions of the Li0.5Ce xFe2.5- xO4 sintered at 900 °C. The samples show all the characteristic reflections of ferrite material with the most intense (311) peak, which confirms the formation of cubic inverse spinel structure. The results obtained by XRD are indexed using JCPDS reference code 01-088-0671. The phase pure crystallites are formed in a stable cubic structure of space group p4332 and lattice parameter was found with a refinement from celref3 software. We have calculated quantities such as lattice parameters, unit cell volume of all the materials and these are provided in . It can be observed explicitly from XRD patterns that Ce is completely substituted into lithium ferrite for cerium concentration Ce = 0.05. But in the case of Ce = 0.1, the second phase of CeO2 was also observed. The second phase peaks (111) and (123) appeared in Ce = 0.1 [12]. The lattice constant of Li0.5Ce xFe2.5- xO4 ( x = 0.05) is a = 0.83386 nm, which is slightly larger than that of Li0.5Fe2.5O4 ( a = 0.83295 nm). This increase in lattice constant may be attributed to the replacement of smaller Fe3+ (0.0645 nm) ions by the larger Ce3+ (0.1034 nm) ions in the Li0.5Ce xFe2.5- xO4 system. This reveals that the doping by Ce does not change the cubic structure of Li0.5Fe2.5O4, and Ce was substituted into the crystal lattice.
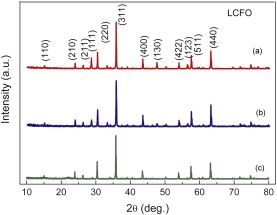 | Fig. 2. XRD patterns of 900 °C Li0.5Ce xFe2.5- xO4 system: (a) x = 0.0, (b) x = 0.05, (c) x = 0.1. |
| Table 1. Cell parameters and density of two samples Li0.5Ce xFe2.5- xO4, where x = 0 and 0.05 |
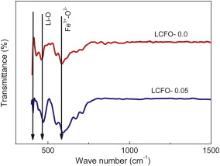
Fig. 3 shows the FTIF spectra of Li0.5Ce xFe2.5- xO4 system. The FTIR spectrum of pure lithium ferrite ( x = 0) indicates the presence of splitting in the absorption bands. The first primary band ( ν1) at 592 cm -1 has a structure consisting of three subsidiary bands ν1(1), ν1(2), ν1(3) at 709.8, 677 and 546 cm-1, respectively. The second primary band ( ν2), which should be at 400 cm-1, is characterized by different splitting bands. It has been shown by Potakova et al. [18] that splitting is observed on absorption bands due to presence of Fe2+ ions in ferrites. The Fe2+–O2- vibrations will come below 400 cm-1 range. In other words, this band can be assigned to the divalent metal ion–oxygen complexes on octahedral sites, which cannot be shown here. The band at ν2(1) = 470 cm-1 and the weak one at ν2(2) = 407 cm-1 can be attributed to Li–O vibrations. The spectra of Li0.5Ce xFe2.5- xO4 system show a change and shift in the absorption bands when Ce3+ ions are introduced. For x = 0.05, there is no more shift in the band or intensity.
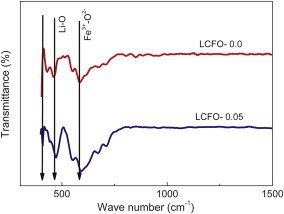 | Fig. 3. FTIR spectra of Li0.5Ce xFe2.5- xO4 system for x = 0.0 and 0.05. |
The density of sample bits with free of air bubbles and cracks upon visual examination, was determined by the Archimedes principle. The density of the samples under study was determined by using specific gravity bottle, Shimadzu single pan balance for weight measurements and xylene as the inert liquid. Density was obtained by employing the relation: ρ = Wa ρl/( Wa - Wl), where ρ is the density of the sample, Wa is the weight of the sample in air, Wl is the weight of the sample when being fully immersed in liquid and ρl is the density of liquid used. The error in the density measurements is within ±(0.04) g/cm3. The calculated and measured densities of all the materials are given in .
3.5.1. Impedance studies
The parallel conductance G and capacitance C of the samples were measured at varies angular frequency ω = 2π f, f being the frequency. The real Z′( ω) and the imaginary Z″( ω) parts of the complex impedance Z∗( ω) are calculated with measured G and C by using the relations:
Z′(ω)=G/(G2+ω2C2) (2)
Z″(ω)=Cω/(G2+ω2C2) (3)
Since the early days of Cole–Cole, considerable progress has been made in utilizing complex plane plots and frequency explicit plots to explain the electrical conductivity of a wide range of solid state materials. The equivalent circuit, which is modelled by the Cole–Cole function, is given by:
Z*=R/[1+(jωτ)1-α] (4)
where τ= RC and 0 ≤ α<1 characterizes the distribution of the relaxation times and for an ideal Debye relaxation α= 0.
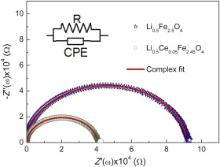
Fig. 4 shows the complex impedance plot for Li0.5Fe2.5O4 (LCFO-0.0) and Li0.5Ce0.05Fe2.45O4 (LCFO-0.05) at 280 °C and the solid lines are the best fit to Eq. . The curves start at the origin, and hence there is no need of resistance in series to model the sample. The shape of the curve suggests that the electrical response is completely dominated by the bulk properties of the material. As per the plots, the semicircles have their centres located slightly away from the real axis, which indicates departure from ideal Debye behaviour [19]. It is seen that the semicircular arcs are shifted towards the origin, indicating the increase in conductivity of all samples as the temperature increases. As temperature increases, the radius of the arc corresponding to bulk resistance of the material decreases, which indicates an activated conduction mechanism. The results suggest that the non-Debye model is suitable for representing the samples and the impedance data are fitted by the resistance–constant phase elements (R–CPE) circuit [20].
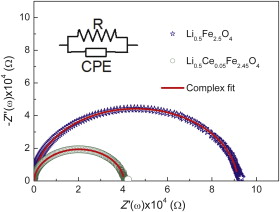 | Fig. 4. Complex impedance spectra of Li0.5Ce xFe2.5- xO4 system at 280 °C. |
AC impedance data are explained based on the well known concept of CPE and is given by:
ZCPE=1/(Y0n(iω)) (5)
where 0 ≤ n≤ 1. When n= 0, Y0becomes 1/ R and CPE behaves as a pure resistor and for n= 1, Y0becomes C and CPE behaves as a pure capacitor with reactance value 1/( Cω). If the value of nis between 0 and 1, CPE takes the value of neither the capacitance nor the resistance; but it is a combination of resistance and capacitance. The CPE is used to describe (a) distribution of the value of some physical property of the system and (b) microscopic (non-Debye) process. The electrical properties of an ion conductor can be described by an equivalent circuit consisting of a parallel combination of a resistor Rand a capacitor C. The complex impedance diagram of such a circuit gives a semicircle, centred on the Z′ axis at ( R/2, 0). However, in most cases the experimental data reveal a significant deviation from simple R– Cbehaviour, and it is apparent in terms of depressed semicircle in complex impedance. A common phenomenological approach describes these broadened/dispersed semicircles by a parallel connection of an Ohmic resistor Rand a constant phase element (CPE). In Fig. 4, the bulk property is represented by the equivalent circuit (R–CPE), where Rand CPE are parallel and CPE accounts for depressed semicircle. The elements of an equivalent circuit model represent various (macroscopic) processes involved in transport of mass and charge. A more general non-linear least square (NLLS) fit program based on Levenberg–Marquardt algorithm has been used to extract the impedance parameters using Origin 8 software. The magnitudes of Rand CPE at 553 K are given infor different compositions. On separating real and imaginary parts of Eq.we obtained:
| Table 2. Equivalent circuit and the parameter values for different compositions at 553 K |
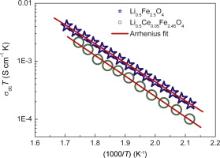
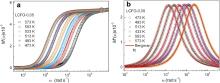
Fig. 5(a) and (b) shows plots between Z″ vs ω at various temperatures for the prepared ferrites. The peak that is exhibited by Z″ shifts towards higher frequencies with the increase in temperature. The curves are broader than ideal Debye curve and asymmetric. These features indicate that the relaxation time τ is not single valued but it is the average value of distribution of relaxation time τm = 1/ ωp, where ωp is the peak frequency [19]. As temperature increases, the magnitude of Z″ peak maxima decreases and the peak frequency shifts to the higher temperature values [21]. Solids lines in Fig. 6(a) and (b) are the fitted curves to the experimental results according to Eq. . It is clear that the experimental data are closely fitted using Eq. in the entire range of frequencies. The dc conductivity is obtained by using the formula: σdc = L/ RA, where L is thickness and A is area of cross section of the sample. Generally conductivity in this kind of material follows Arrhenius relation as
σdcT= σ0exp(-Eσ/kB) (8)
where σdc is the dc conductivity, σ0 is the pre-exponential factor, T is the temperature in K, Eσ is the dc conductivity activation energy and kB is the Boltzmann's constant. The Arrhenius plot for temperature dependence of dc conductivity of different compositions is shown in Fig. 6. The activation energy for the conduction process is calculated from the slope, which is given in. The insets of Fig. 6(a) and (b) show dependence of relaxation time on the reciprocal temperature. It was also found that the reciprocal temperature dependence of hopping frequency, ωPshows Arrhenius behaviour as
ωP=ωoexp(-EP/kBT) (9)
where ωo is pre-factor, EP is activation energy for relaxation. The solid lines in the inset of Fig. 6(a) and (b) figures are the linear fit to experimental data according to Eq.. The activation energy calculated for hopping frequency is found to be almost same with the activation energy calculated from conductivity, which is shown in.
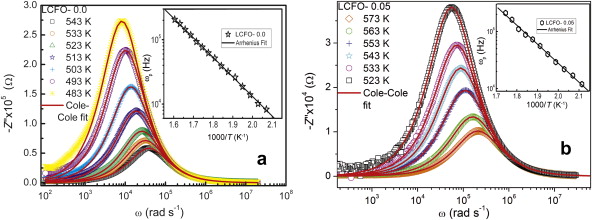 | Fig. 5. Variation of imaginary part of impedance Z″ with frequency at different temperatures for: (a) LCFO-0.0, (b) LCFO-0.05, Inset: activation energy plot for hopping frequency. |
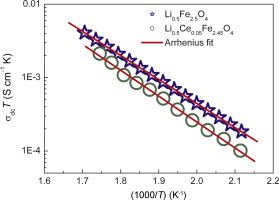 | Fig. 6. Arrhenius plot of ( σdc T) vs reciprocal of temperature. |
| Table 3. Activation energies obtained from Arrhenius plots and dc conductivity values from different representations |
From the experimental data it has been seen that, the activation energy increases with the increase of cerium proportion. The increase in activation energy may be explained in terms of ionic radii of Ce3+ and Fe3+. The larger Ce3+ (0.1034 nm) ions substitution in octahedral B site having smaller Fe3+ (0.0645 nm) ions in the Li0.5Ce xFe2.5- xO4 system. The ionic radius of the Ce3+ is almost twice that of Fe3+ ionic radius and it may causes the oxygen (O2-) anion distortion. The distorted anion may trap the Li+ and it needs more energy to conduct. This could be the reason to increase the activation energy in the Ce doped lithium ferrite [22].
3.5.2. Electric modulus
An alternative approach to investigate the electrical response of materials is given by complex electric modulus M∗( ω)
M*(ω)=M′(ω)+jM″(ω) (10)
where M′( ω) and M″( ω) are real and imaginary, respectively and they are given by:
M′(ω)=ωɛ0AZ″(ω)/L (11)
M″(ω)=ωɛ0AZ′(ω)/L (12)
where L is thickness and A is area of cross section of the sample. Electric modulus representation M*( ω) = 1/ ɛ*( ω) was developed by Provenzano et al. [23] and it is one of the methods to understand the electrical relaxation process of hopping charge carriers in ion/electron conducting materials, where the low frequency electrode polarization effects are suppressed [24].
The dielectric relaxation process, in general, can be represented by the numerical Laplace transform of Kohlraush–Williams–Watts (KWW) decay function φ( t) = exp[-( t/ τ) β], where the exponent β characterizes the degree of non-Debye behaviour and τ is the conductivity relaxation time as:
where

and M∞= 1/ ɛ∞ is the inverse of the high-frequency dielectric permittivity and the function φ( t) is the time evolution of the electric field within the dielectric, the exponent β characterizes the degree of non-Debye behaviour and is related to the full width at half maximum of M″( ω) vs ω curve.
Later on Bergman [25] modified the KWW function fitting approach, allowing direct analysis in the frequency domain. In the frequency domain the imaginary part of the M″( ω) has been approximated as (for β ≥ 0.4)
Where
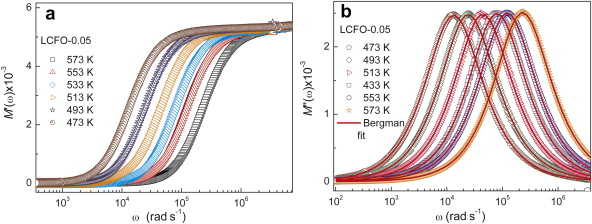 | Fig. 7. Variation of real (a) and imaginary (b) part of electric modulus with frequency for LFCO-0.05 respectively at different temperatures. |
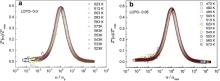
The M″( ω) shows a slight asymmetric peak at each temperature as seen in Fig. 7(b). The low frequency wing of the peak represents the range of frequencies, in which the charge carriers can move over long distances, i.e. they can perform successful hopping from one site to the neighbouring site. On the other hand, corresponding to the high-frequency wing of the M″( ω) peak, the charge carriers are spatially confined to their potential wells and the charge carriers can make only localized motion within the well. The peak is positioned at around the centre of the dispersion. The peak frequency shifts towards higher frequencies with temperature. The M″( ω) is related to the energy dissipation taking place in the irreversible conduction process. This is due to the reason that the dielectric relaxation observed in these systems does not correspond to a single relaxation time function. Similar behaviour has been seen for Li0.5Fe2.5O4 sample. The peak maximum Mmax, peak frequency ωmax = 1/ τ and stretching exponent β are obtained from M″( ω) data by using Eq. for the materials and typical fitted curves are shown in Fig. 8.
 | Fig. 8. Arrhenius plot of ωmax for the compositions from electric modulus. |
Cross over frequency from conductivity relaxation time τ = 1/ ωmax obtained from Bergman fitting approach for x = 0.0 and 0.05 materials is plotted as a function of reciprocal temperature 1000/ T in Fig. 8. The ωmax = 1/ τ is temperature dependent and is found to obey the Arrhenius equation given in Eq.(9). The activation energy EP has been obtained as shown in Table 2.
For both the samples, the imaginary part of modulus M″ has been scaled by
where symbols have their usual meaning. The nearly overlapping nature of the data for all temperatures into a single master curve indicates the same thermal activation energy at different frequencies [29], [30] and [31]and the dynamical process is temperature independent, which is shown in Fig. 9(a) and (b).
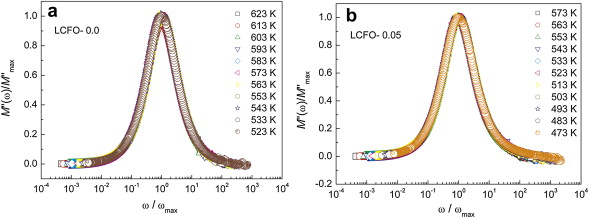 | Fig. 9. Scaled modulus plots for (a) LCFO-0.0 and (b) LCFO-0.05, where modulus axis M″( ω) is scaled by |
Similarly, each imaginary part of impedance data is scaled by
where symbols have their usual meaning. These results are shown in Fig. 10(a) and (b). Here the scaled impedance spectra collapsed into a single master curve. The ability to scale different data sets so as to collapse to a master curve indicates that the process can be separated into a common physical mechanism modified only by thermodynamic scales. This master curve gives the dimensionless impedance and modulus as a function of dimensionless frequency [32] and [33]. The existence of such a master curve is referred to as time temperature superposition principle.
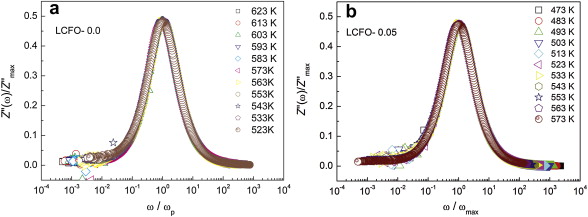 | Fig. 10. Scaling plots for the impedance spectra of LCFO-0.0 (a) and LCFO-0.05 (b), where the impedance and frequency axis are scaled by the maximum peak impedance and hopping frequency respectively. |
Ce-substituted lithium ferrite system Li0.5Ce xFe2.5- xO4, ( x = 0.0 and 0.05) were successfully prepared by solution combustion method. XRD results showed the confirmation of the crystalline nature of the materials with cubic inverse spinel structure for x = 0.0 and 0.05. Finally, density measurements showed that there is an increase in the density with increase of cerium concentration. The impedance and modulus studies have been carried out and the data were fitted to the Cole–Cole and Bergman functions respectively to analyse the relaxation process. The shape of the imaginary part of the modulus suggests that the relaxation processes in these ferrites are of non-Debye in nature. The Eσ, and EP obtained from impedance analysis and modulus analysis are found to be equal for the prepared compositions and activation energy from dc conductivity is found to be 0.64 and 0.69 eV, whereas activation energy from cross over frequency is found to be 0.59 and 0.65 eV for x = 0.0 and 0.05, respectively. It was found that with the insertion of cerium, the activation energy increases and dc conductivity decreases for x = 0.05 as compared to x = 0.0. The scaling is used to understand the electrical relaxation behaviour of the compositions. The ωp scaling suggests the time temperature superposition principle of relaxation process.
Financial support from the UGC-SAP is gratefully acknowledged. Authors would like to thank Central Instrumentation Facility (CIF), Pondicherry University for DTA–TG, FT-IR facilities.
| 1. |
|
| 2. |
|
| 3. |
|
| 4. |
|
| 5. |
|
| 6. |
|
| 7. |
|
| 8. |
|
| 9. |
|
| 10. |
|
| 11. |
|
| 12. |
|
| 13. |
|
| 14. |
|
| 15. |
|
| 16. |
|
| 17. |
|
| 18. |
|
| 19. |
|
| 20. |
|
| 21. |
|
| 22. |
|
| 23. |
|
| 24. |
|
| 25. |
|
| 26. |
|
| 27. |
|
| 28. |
|
| 29. |
|
| 30. |
|
| 31. |
|
| 32. |
|
| 33. |
|