


CaCO3/TiO2 Nanoparticles Based Dye Sensitized Solar Cell
[Kaur Manveen*  , Verma N.K.]
, Verma N.K.]
|
|


In this communication, the synthesis and structural, morphological, optical, and photo-electrochemical properties of TiO2 and CaCO3/TiO2 nanoparticles as well as their applications in dye sensitized solar cells (DSSCs), have been reported. In an X-ray diffraction pattern of CaCO3/TiO2 nanoparticles, the peak at 29.41° of CaCO3 has been detected, demonstrating its coating on the surface of TiO2, which is further verified using high resolution-transmission electron microscopy, energy dispersive X-ray spectroscopy and Fourier transform infrared spectroscopy. The strong quenching in photoluminescence emission, in the case of CaCO3/TiO2 nanoparticles, has been attributed to the decrease in recombination rate of photo-generated electron–hole pairs. In the case of UV–visible reflectance spectra, the absorption edge for CaCO3/TiO2 nanoparticles has slightly been found to be blue-shifted as compared to bare TiO2 nanoparticles, which corresponds to an increase in energy band gap of the former. The dye desorption studies reveal that CaCO3/TiO2 electrodes adsorbed more dye than the bare TiO2 electrode. CaCO3/TiO2 based DSSC show improved photo-electrochemical properties compared to the bare TiO2 based DSSC as CaCO3 coating on TiO2 forms an energy barrier, and, consequently suppressing the charge recombination, and, thus, improving the overall energy conversion efficiency (
The threat of depletion of the natural resources is driving us to identify alternative sources of energy that are environment friendly. Solar energy has been considered as one of the most important energy source as it is abundant, clean and environment friendly. Solar cells based on dye-sensitization of semiconductor electrodes are regarded as a regenerative and low-cost alternative to conventional solar cells [1]. Since their discovery in 1991, various high surface area electrodes of wide band gap semiconductors such as TiO2 [2], SnO2 [3], ZnO [1], Nb2O5, SrTiO3 [4] have been reported as photoanode in dye sensitized solar cells (DSSCs). Apparently, TiO2 has been known to be the best semiconductor electrode material because of its chemical stability and excellent charge transport ability [2].
However, under light illumination, the electron in the conduction band of TiO2 can either de-excite to the highest occupied molecular orbital (HOMO) level of dye (recombine with oxidized dye molecule) or recombine with the electrolyte ions (redox species) present in the system [5] and [6]. This interfacial charge recombination still remains one of the major limiting factors to the efficiency of DSSC. However, suppression of charge recombination at semiconductor/dye/electrolyte interface can be achieved by coating a higher band gap oxide layer on TiO2, which allows the electrons generated upon photo-excitation of the dye to tunnel through the coating to TiO2, retarding the back transfer of electron to the electrolyte solution [7]. Coating of a number of high band gap materials such as ZnO [8], SnO2 [9], Al2O3 [10], Eu2O3 [11] on TiO2 have been done and their effect on the performance of DSSC has also been investigated. Wang et al. used TiO2 nanocrystalline electrode coated with CaCO3, sensitized with N719 as photoanode in DSSC, and revealed an improvement of 14.4% in efficiency as compared to that of bare TiO2 based DSSC, using an antireflective film on the cell surface [12]. Lee et al. reported the optical and electrical investigations on CaCO3 coated TiO2 nanoparticles and the energy conversion efficiency of CaCO3 coated TiO2 based DSSC improved by 24.4% as compared to that of TiO2 based DSSC [13] and [14]. In the present study, CaCO3 has been selected as the coating layer, due to its high band gap (6.0 eV), and isoelectric point (IEP) i.e. 8.3, which assists dye adsorption [12].
In this study, TiO2 nanoparticles have been synthesized by sol–gel method and coating of CaCO3 on TiO2 has been done by hydrothermal method. Structural, morphological and optical properties of the synthesized nanoparticles have been investigated and their successful application in DSSCs has been reported.
Fluorine doped tin oxide (FTO) glasses were purchased from Pilkington, Hongkong. Analytical grade reagents of titanium isopropoxide (Ti(OCH(CH3)2)4), isopropyl alcohol ((CH3)2CHOH), lithium iodide (LI), iodine (I2), 4-tert-butylpyridine (TBP), and tetrabutylammonium iodide (TBAI), hexachloroplatinic acid hexahydrate (H2PtCl6·6H2O), sodium carbonate (Na2CO3) and calcium chloride (CaCl2) were procured from Sigma Aldrich and used without further purification. Millipore water was used for synthesizing the samples.
The TiO2 nanoparticles were synthesized via sol–gel process using the hydrolysis and the condensation of titanium isopropoxide in an anhydrous alcohol medium [15]. In a typical experiment, titanium isopropoxide was dissolved in 150 mL of anhydrous isopropyl alcohol. A second solution was prepared in which measured quantity of water was dissolved in 150 mL of anhydrous isopropyl alcohol. Both the solutions were covered and stirred rapidly using a magnetic stirrer to obtain the homogeneous solutions. The water solution was then added to the alkoxide solution under continuous stirring for 5 h. As a result of hydrolysis of titanium isopropoxide, white colored precipitates were formed. The precipitates were filtered, washed using deionized water and dried at 70 °C to get the TiO2 powder. The powder obtained was calcined at 450 °C for 2 h.
Firstly, TiO2 nanoparticles were ultrasonically dispersed in ethanol. In another beaker, Na2CO3 and CaCl2 were added in water and stirred for 15 min. Now, this solution was added drop-wise to the dispersed TiO2 nanoparticles. In this technique, the primarily synthesized TiO2 nanoparticles act as nucleation sites for the CaCO3 coating. To allow the coating to uniformly form on the particles, and prevent the coating material from being produced separately from the particles, the coating solution was added drop-wise. Further, the above mixture was transferred to Teflon container and autoclaved for 4 h at 100 °C. The particles were washed and filtered. The particles thus obtained were calcined at 300 °C for 1 h, to obtain crystalline nanoparticles.
Photoelectrodes were prepared on FTO glasses via doctor blade technique with a glass slide and scotch tape as spacer. To make homogeneous slurry, synthesized nanoparticles were mixed with water, acetylacetone and Triton-X 100 in pestle and mortar. Using this slurry, thin films of area 1.0 cm × 1.0 cm were prepared, dried at room temperature, followed by sintering at 450 °C for 30 min. For sensitization, the fabricated electrodes were dipped in 0.3 mmol/L ethanolic solution of N719 dye for 24 h. The counter electrode was made by spin coating 5 mmol/L H2PtCl6·6H2O in isopropyl alcohol on FTO glass and sintering it at 385 °C for 15 min. For the complete fabrication of DSSC, the sensitized electrode and the counter electrode were assembled and a few drops of electrolyte, comprising of LI, I2, TBP, and TBAI, in acetonitrile, were injected in between the electrodes.
In order to compare the amount of dye adsorbed on the electrode fabricated using TiO2 and CaCO3/TiO2 nanoparticles, UV–visible absorption study has been performed of the N719 dye desorbed from both the fabricated electrodes. To completely desorb the dye molecules from the electrodes, they are soaked in 0.1 mmol/L aqueous NaOH solution for 2 h.
The nanoparticles have been structurally characterized through X-ray diffraction (XRD) by PANalytical X'PertPRO MRD with Cu- Kα ( λ = 0.154 nm) radiation and scanned for 2 θ values from 20° to 80°. For morphological study, transmission electron microscopy (TEM) has been carried out using a Hitachi H-7500. High resolution-transmission electron microscopy (HR-TEM; TEM 2100F, JEOL) and selected area electron diffraction (SAED), attached with HRTEM, have been used to confirm the coating of CaCO3 on TiO2 nanoparticles and to determine the crystalline nature of CaCO3/TiO2, respectively. The quantitative elemental composition analysis has been carried out by energy dispersive X-ray spectroscopy (EDAX; OXFORD analytical). UV–visible spectrophotometer (Ocean Optics) has been used to measure diffuse reflectance of the nanoparticles (pressed into a thin pellet). Photoluminescence (PL) spectra of the TiO2 and CaCO3/TiO2 nanoparticles have been recorded using a xenon lamp equipped with a Perkin–Elmer fluorescence spectrometer at an excitation wavelength of 325 nm. Fourier transform infrared spectroscopy (FTIR) measurements have been performed with a Perkin–Elmer Paragon 500 Spectrometer in the mid infrared area, ranging from 400 cm-1 to 4000 cm-1. UV–visible absorption spectra of the desorbed dye solutions have been recorded to compare the extent of dye adsorbed on the surface of the electrodes using a Perkin–Elmer Lambda 45 Spectrophotometer. Photocurrent density–voltage ( J– V) characteristics have been measured using a standard AM 1.5 solar simulator (Newport, Model 96000) with Xe lamp, and source meter (Keithley, Model 2400).
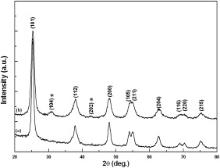
TiO2 exists in three phases: anatase, rutile and brookite. Pure brookite phase is unstable and difficult to synthesize. Pure rutile phase has limited photoactivity, and, therefore, is less photo-efficient than anatase phase. For application of TiO2 in photocatalysis and DSSC, anatase phase of TiO2 is considered to be more active [16]. The phase present in the synthesized samples has been determined by XRD ( Fig. 1), showing the presence of anatase TiO2 with tetragonal structure (JCPDS card No.: 84-1286). The XRD pattern of CaCO3/TiO2 nanoparticles shows peaks at 29.41° and 42.60° (marked as * in Fig. 1), which correspond to CaCO3 with hexagonal structure and rhomb-centered phase (JCPDS card No.: 85-0849). The crystallite size of the samples, calculated using Debye–Scherrer formula [17], has been found to be 10.52 nm and 8.23 nm for bare and CaCO3/TiO2 nanoparticles, respectively; the crystallite size of the latter being smaller than that of the bare TiO2 nanoparticles. From XRD analysis, the crystallite sizes of TiO2 and CaCO3/TiO2 nanoparticles have been found to be 10.52 and 8.23 nm, respectively. The growth mechanism for the bare TiO2 nanoparticles involves the spreading of the domain structure throughout the grain up to grain boundaries whereas in the case of coated TiO2 nanoparticles, this spread of domain structure is restricted due to the surface coating. This results in decrease in the crystallite size of coated TiO2 nanoparticles [11] and [18]. The presence of CaCO3 over TiO2 nanoparticles can be concluded from the XRD analysis.
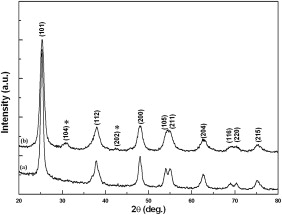 | Fig. 1. X-ray diffractogram of (a) TiO2 and (b) CaCO3/TiO2 nanoparticles. |
Further to corroborate the XRD results, EDAX analysis of TiO2 and CaCO3/TiO2 nanoparticles has been shown in Fig. 2. The EDAX spectra of TiO2 nanoparticles ( Fig. 2(a)) reveal the presence of Ti and O elements with atomic percentage 23.86% and 76.14%, respectively. The EDAX spectrum of CaCO3/TiO2 nanoparticles ( Fig. 2(b)), reveals the presence Ca, C, O and Ti elements with atomic percentage 0.30%, 25.86%, 56.76% and 17.08%, respectively. It confirms the CaCO3 coating on the surface of TiO2 nanoparticles, observed in XRD patterns as well ( Fig. 1).
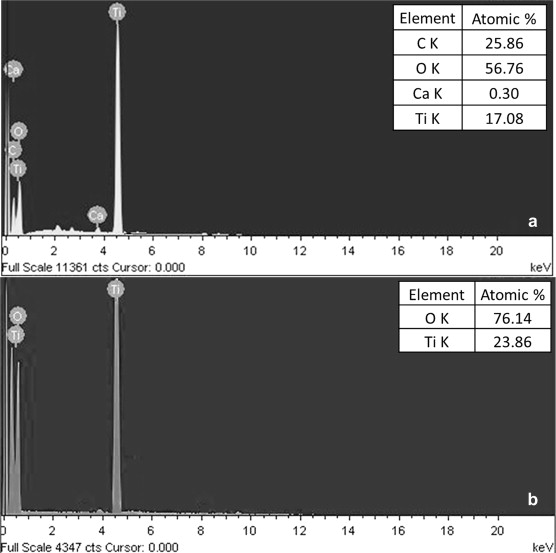 | Fig. 2. EDAX spectra of (a) CaCO3/TiO2 and (b) TiO2 nanoparticles. |
To confirm the chemical interactions of TiO2 with CaCO3, FTIR study has been done and compared with the FTIR spectra of uncoated TiO2 nanoparticles, as shown in Fig. 3. The spectra of TiO2 and CaCO3/TiO2 show a band observed at around 3421 cm-1 characteristic of non-hydrogen bonded hydroxyl groups; this is because the hydroxyl group and adsorbed water dominate the surface chemistry of TiO2 [19]. The peak observed in both the spectra at 1632 cm-1 is attributed to the bending modes of adsorbed water [20]. The characteristic vibrations of the inorganic Ti–O stretch have been observed in the range 400–900 cm-1. The FTIR spectrum confirms the existence of C–O in3CO2- in the range of 1600 cm-1 to 1300 cm-1 due to antisymmetric stretching as well as by the band at 800 cm-1 to 600 cm-1 due to the out of plane bending [21]. Overlap occurs between the stretching modes of the Ti–O and the out of plane bending modes of the3CO2- band. Two peaks, 1497 cm-1 and 1380 cm-1, corresponding to the asymmetric and symmetric stretching vibrations of O–C–O have been observed in the spectrum of CaCO3/TiO2 nanoparticles, which is due to the carboxylate group-Ti bridging structure; this confirms the presence of CaCO3 coating over TiO2 nanoparticles [12]. In general, the electron injection efficiency is reduced by hydroxyl groups and physisorbed water molecules present on the surface of TiO2 nanoparticles. The coating of CaCO3 on TiO2 nanoparticles leads to reduction in surface O–H groups, which is evident from slight decrease in the intensity of the O–H band at 3421 cm-1. Consequently, the increase in the electron injection efficiency from TiO2 to FTO is expected, which enhances the overall conversion efficiency ( η) of DSSC.
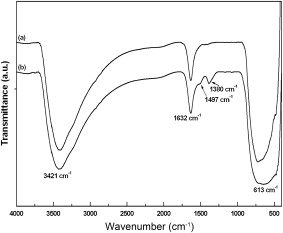 | Fig. 3. FTIR spectra of (a) TiO2 and (b) CaCO3/TiO2 nanoparticles. |
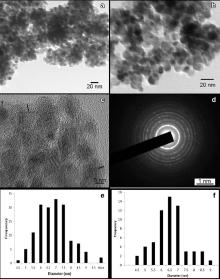
TEM micrographs of TiO2 and CaCO3/TiO2 nanoparticles are shown in Fig. 4(a, b). The histograms of TiO2 and CaCO3/TiO2 nanoparticles, presented in Fig. 4(e) and Fig. 4(f), respectively, show the narrow size distribution of the approximately spherical particles. The average particle size of the bare TiO2 and CaCO3/TiO2 nanoparticles has been found to be 6.60 nm and 7.33 nm, respectively. HRTEM ( Fig. 4(c)) has been used to confirm the coating of CaCO3 on TiO2 nanoparticles. The lattice fringes of TiO2 nanoparticles confirm its crystalline nature. The HRTEM image also confirms the presence of CaCO3 coating over the TiO2 surface (shown by black line in Fig. 4(c)). From Fig. 4(d), the SAED pattern of CaCO3/TiO2 nanoparticles has circular rings of anatase phase of TiO2. The inter-planar spacing from the different rings has been determined to be 0.355 nm, 0.240 nm, 0.192 nm, and 0.169 nm, corresponding to the (101), (103), (200), and (105) planes of TiO2, respectively, which are in agreement with the XRD results ( Fig. 1). Also, the inter-planar spacing of 0.320 nm corresponds to (104) plane of CaCO3, which further verify CaCO3 coating on TiO2 nanoparticles.
 | Fig. 4. (a) TEM image of TiO2 nanoparticles (b) TEM image (c) HRTEM image (d) associated SAED pattern of CaCO3/TiO2 nanoparticles, (e) size distribution histogram of TiO2 nanoparticles (f) size distribution histogram of CaCO3/TiO2 nanoparticles. |
The particle size estimated from TEM has been found to be 6.60 and 7.33 nm for TiO2 and CaCO3/TiO2 nanoparticles, respectively. TEM is used for direct measurement of the particle size and size distribution. Particle size in general refers to phase space, i.e. it tells about the spatial extension of a particular phase, but contains no information regarding the crystalline perfection of the particle (which is revealed by XRD). The increase in particle size is attributed to the Eu2O3 coating on TiO2 nanoparticles.
Crystalline size is determined by Debye–Scherrer formula using XRD and the particle size is determined using TEM. Generally, the size obtained from Scherrer's formula is not the same as the particle size. When the particle size is ultra-small, the size estimated from XRD peak width is sometimes larger than the size measured by TEM. Ultrafine particles with a size less than 7 nm are found to be self-assembled into a “coherent interface” by agglomeration through minimizing the interface energy, so that a large group of particles behave like a large single particle in XRD [22] and [23]. However, mono-dispersed nanoparticles in ethanol are prevented from agglomerating during TEM measurement.
3.4.1. Photoluminescence studies
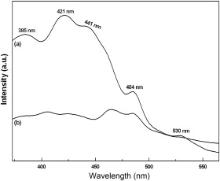
Due to surface modification of TiO2 with CaCO3 ( Fig. 5), an appreciable change in the PL emission spectra of CaCO3/TiO2 nanoparticles has been observed. The emission in nanocrystalline TiO2 is due to the defects resulting from under coordinated Ti4+ ions, oxygen vacancies, chemisorbed surface species, which result in the localized intra-band gap states that serve as electron traps. In the emission spectra of TiO2 nanoparticles, the emission peak, 385 nm, corresponds to a direct band emission of the fundamental band gap (3.2 eV) of anatase TiO2, whereas the emission peak, 441 nm, relates to the emission process of oxygen vacancy defects in TiO2 [24]. The peak, 421 nm, is attributed to the self-trapped excitons [25], and the emission signal, 484 nm, to the charge-transfer from Ti3+ to oxygen anion in a6TiO8- complex, related with oxygen vacancies at the TiO2 surface [26]. The green emission, 530 nm, can be associated with anion vacancies on the surface of TiO2 nanoparticles [27]. In the case of CaCO3/TiO2 nanoparticles, the strong quenching of PL emission is due to the increase in the separation efficiency of the photo-generated electron–hole pairs. The PL emission mainly results from the recombination of excited electrons and holes, and thus the lower PL intensity indicates the decrease in recombination rate. Also, the electron injection efficiency is reduced by the hydroxyl groups and physisorbed water molecules present on the surface of TiO2 nanoparticles (as discussed in Section ). The surface O–H groups are reduced on coating, thus resulting in reduction of the unwanted non-radiative decay pathways thereby increasing the electron injection efficiency. This ensures better performance of CaCO3/TiO2 DSSC as compared to the bare one.
 | Fig. 5. PL spectra of (a) TiO2 and (b) CaCO3/TiO2 nanoparticles. |
3.4.2. UV–visible spectroscopy
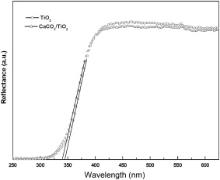
UV–visible diffuse reflectance spectra of TiO2 and CaCO3/TiO2 nanoparticles are shown in Fig. 6. The reflectance of CaCO3/TiO2 nanoparticles is lower implying that their absorbance is greater, as compared to TiO2 nanoparticles. The coating of CaCO3 over TiO2 surface leads to decrease in the diffuse reflectance, which, in turn, increases the light harvesting efficiency thereby making CaCO3/TiO2 nanoparticles a suitable candidate for light trapping layer in DSSC. The absorption edge for CaCO3/TiO2 nanoparticles is slightly blue-shifted as compared to that of the bare TiO2 nanoparticles. The band gaps of TiO2 and CaCO3/TiO2 nanoparticles, calculated from the absorption edge of the reflectance spectra, have been found to be 3.59 eV ( λ = 345.1 nm) and 3.64 eV ( λ = 340.2 nm), respectively. The higher value of the band gap is observed, as compared to that of the bulk TiO2 ( Eg(bulk) = 3.3 eV), due to localization of electrons and holes in the semiconductor nanoparticles [28]. The band gap of CaCO3/TiO2 nanoparticles is found to be 0.05 eV higher than that of the bare TiO2 nanoparticles. Implication of higher band gap material as anode helps to improve the efficiency of DSSC by speeding up the electron transfer rate at the TiO2/dye interface [29]. This also facilitates an increase in the open circuit voltage ( VOC) and the short circuit current density ( JSC) of DSSC, thus, making CaCO3/TiO2 a potential candidate for DSSC.
 | Fig. 6. UV–visible diffuse reflectance spectra of TiO2 and CaCO3/TiO2 nanoparticles. |
3.4.3. Dye desorption studies
Fig. 7 shows the UV–visible absorption spectra of the desorbed dye obtained from both the electrodes. The peaks found near 370 nm and 500 nm correspond to the characteristic absorption of N719 dye. From the desorbed dye spectra analysis, it has been found that the amount of dye adsorbed on the CaCO3/TiO2 photoelectrode is higher than that of bare TiO2 electrode. The higher basicity of the CaCO3 favors the dye adsorption through the carboxylic acid group of the N719 dye [30]. It is less probable for the N719 dye to fully cover the TiO2 surface without the basic CaCO3 coating due to intermolecular electrostatic repulsion. Further, the increased dye adsorption facilitates the enhancement of short circuit current in CaCO3/TiO2 based DSSC; since the current density is influenced by the initial number of photo-generated electron–hole pairs [31]. Thus, CaCO3/TiO2 electrode ensures more efficient photon capturing in the visible region.
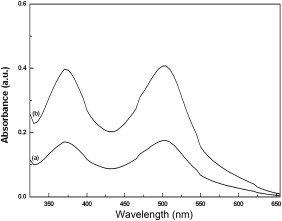 | Fig. 7. UV–visible absorption of desorbed dye from (a) TiO2 electrode and (b) CaCO3/TiO2 electrode. |
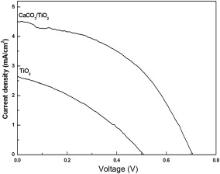
DSSC fabricated using synthesized nanoparticles have been characterized by measuring the current density–voltage ( J– V) behavior while irradiating simulated AM 1.5 sunlight, with a power density of 100 mW/cm2. Fig. 8 shows the typical J– V curves of the DSSC fabricated using TiO2 and CaCO3/TiO2 nanoparticles. summarizes the different parameters calculated from the J– V curve ( Fig. 8) viz. open circuit voltage, short circuit current density; fill factor (FF), and overall energy conversion efficiency. From , it is clear that, the efficiency achieved by DSSC, fabricated using CaCO3/TiO2 nanoparticles, is 1.44%, and, that of TiO2 nanoparticle based DSSC, 0.46%—an increase in efficiency by over 200%. The current density is influenced by the initial number of photo-generated electron–hole pairs and the electron injection efficiency from dye molecules to semiconductor. The increase in dye adsorption of CaCO3/TiO2 electrode leads to an increase in the probability of interaction between the photons and the dye molecules, and, thus, resulting in the generation of more electron–hole pairs. Also, by CaCO3 coating, the surface O–H groups are reduced resulting in reduction of the unwanted non-radiative decay pathways; this increases the electron injection efficiency. Thus the current density of CaCO3/TiO2 based DSSC is 70% higher than that of the TiO2 based DSSC. The CaCO3 being more basic than TiO2 introduces the electrostatic field since it attracts more dye molecules, which can deprotonate the TiO2 nanoparticles [32]. The CaCO3 coating increases open circuit voltage as its high band gap and high IEP result in reduction of electron recombination [32]. Consequently, the open circuit voltage increases due to the increased offset between the quasi Fermi level of TiO2 nanoparticles and the redox level of electrolytes. The fill factor reflects the quality of the electrode and the extent of electrical and electrochemical losses taking place during the operation of the DSSC. The fill factors for TiO2 and CaCO3/TiO2 have been found to be 0.34 and 0.45, respectively. Due to the reduction in recombination between photoexcited carriers in the CaCO3/TiO2 electrode and triiodide ions in the electrolyte, the cell resistance decreases, which, consequently, increases the fill factor [33]. The increase in short circuit current density, open circuit voltage and fill factor in the case of CaCO3/TiO2 based DSSC has led to an increase in efficiency as compared to TiO2 based DSSC.
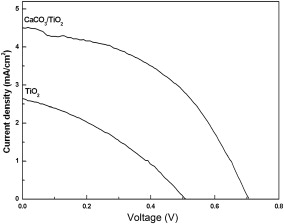 | Fig. 8. J– V curves of the DSSC fabricated using TiO2 and CaCO3/TiO2 nanoparticles. |
| Table 1. Different parameters JSC, VOC, FF and η, as calculated from the J– V curves |
Table 2 shows the comparison of the energy conversion efficiency of CaCO3/TiO2 with other DSSC with different coatings as listed in references [8], [9], [10], [11] and [12]. Though the maximum efficiency achieved from DSSC is 10%–11% that was reported by Gratzel [34], but reports are available on TiO2 based DSSC having very less efficiency, 0.42%, 0.03%, 0.49% and 0.32% [35], [36], [37] and [38]. Moreover, a very small change in the efficiency has been registered by modifying the TiO2 nanoparticles in these cases. Similar observation has been found in our case. Even shows the comparable efficiency, except for the work reported by Wang et al. [12]. In this case, TiO2 particles with different sizes were used in DSSC. The efficiency achieved has been attributed to light scattering phenomenon which significantly increases the light harvesting efficiency.
| Table 2. Comparison of the energy conversion efficiency of CaCO3/TiO2 based DSSC with that of DSSCs reported in references [8], [9], [10], [11] and [12] |
The observed lower efficiency may also be attributed to electrode film characteristics (such as porosity, surface area, agglomeration). The electron transport is directly related to the characteristics of the film [39]. In the present case, the addition of less amount of binder (Triton-X 100) may lead to a decrease in efficiency due to its less aggregative stability. Further work is going on for the optimization of parameters for the fabrication of DSSC to improve efficiency.
The synthesis and characterization of CaCO3/TiO2 nanoparticles for DSSC applications are reported. CaCO3 coating on TiO2 nanoparticles has been successfully synthesized by means of a simple hydrothermal treatment. XRD shows the presence of hexagonal structured CaCO3 on the nanocrystalline anatase TiO2. The presence of CaCO3 coating has been further verified by EDAX, HRTEM and FTIR. The increase in the solar cell performance parameters ( VOC, JSC, and FF) have been observed in the case of CaCO3/TiO2 DSSC. The increase in JSC is attributed to higher dye adsorption of CaCO3/TiO2 electrode as compared to that of the bare TiO2 electrode. The CaCO3 coating has been found to act as an energy barrier at the electrode–electrolyte interface, which decreases the recombination rate and thus increases the efficiency of the DSSC (1.44%), in comparison to TiO2 DSSC (0.46%).
The authors are grateful to the University Grants Commission (UGC) for the research funding vide sanction letter No. F.No. 39-533/2010 (SR) of January 2011.
| 1. |
|
| 2. |
|
| 3. |
|
| 4. |
|
| 5. |
|
| 6. |
|
| 7. |
|
| 8. |
|
| 9. |
|
| 10. |
|
| 11. |
|
| 12. |
|
| 13. |
|
| 14. |
|
| 15. |
|
| 16. |
|
| 17. |
|
| 18. |
|
| 19. |
|
| 20. |
|
| 21. |
|
| 22. |
|
| 23. |
|
| 24. |
|
| 25. |
|
| 26. |
|
| 27. |
|
| 28. |
|
| 29. |
|
| 30. |
|
| 31. |
|
| 32. |
|
| 33. |
|
| 34. |
|
| 35. |
|
| 36. |
|
| 37. |
|
| 38. |
|
| 39. |
|