


Dielectric Relaxation and Conductivity of Ba(Mg1/3Ta2/3)O3 and Ba(Zn1/3Ta2/3)O3
[Hoque Md. Monwar1 , Dutta Alo2 , Kumar Sanjay1, *  , Sinha Tripurari Prasad
2 ]
, Sinha Tripurari Prasad|
|


The frequency dependent dielectric properties of barium magnesium tantalate (BMT), Ba(Mg1/3Ta2/3)O3 and barium zinc tantalate (BZT), Ba(Zn1/3Ta2/3)O3 synthesized by solid state reaction technique have been investigated at various temperatures by impedance spectroscopy. BMT and BZT possess cubic structure with lattice parameter
With the recent progress of microwave integrated circuits and developments in commercial microwave devices, the demand for low dielectric loss materials with high dielectric constant is rapidly increasing. Several types of microwave dielectric ceramics have been developed to meet these requirements [1], [2], [3], [4], [5], [6], [7], [8], [9], [10], [11] and [12]. The majority of dielectric ceramics used in microwave systems have perovskite structure. The perovskite-type oxides have the general formula ABO3, in which A represents a large electropositive cation and B represents a small transition metal ion. The complex perovskite structures with general formula A( B′1/3 B″2/3)O3 and A( B′1/2 B″1/2)O3 having two B type cations ( B′ and B″) are widely studied due to their important technological applications. In recent times, quite a great amount of work has been done on the microwave, radiofrequency and infrared dielectric response of A( B′1/3 B″2/3)O3 type niobates [13], [14], [15], [16], [17], [18], [19], [20], [21], [22], [23], [24], [25] and [26]. Alternating current impedance spectroscopic studies on A( B′1/3 B″2/3)O3 perovskite ceramics (where A = Ba, Sr; B′ = Mg, Zn and B″ = Nb) in a frequency range, 100 Hz to 1 MHz and over a wide temperature range have provided very significant results [21], [22], [23], [24], [25] and [26]. Several issues like the departure of the dielectric response from ideal Debye model, separation of the role of local defects from electrode effects, contribution of grain (bulk) and grain boundary on relaxation phenomena etc. are successfully resolved by examining these results in the framework of different well established models. On the other hand, although microwave dielectric characteristics of tantalum (Ta) based A( B′1/3 B″2/3)O3 perovskite systems are extensively investigated [27], [28], [29], [30], [31] and [32], to the best of our knowledge, there is only one report on low frequency dielectric property of this class of perovskite oxides [33]. In this context, our attention has been focused on the alternating current impedance spectroscopic study of Ba( B′1/3Ta2/3)O3 ( B′ = Mg and Zn) (BBT) compounds in a frequency range of 100 Hz–1 MHz and the temperature range of 393–573 K. The results have also been tested in the framework of different well established formalisms.
According to the literature, the complex perovskite ceramics Ba( B′1/3Ta2/3)O3 ( B′ = Mg and Zn) are usually hexagonal system having lattice parameters a = 0.5782 nm and c = 0.7067 nm for BMT and a = 0.5782 nm and c = 0.7097 nm for BZT [34] and [35]. In contrast, the disordered Ba( B′1/3 B″2/3)O3 has a cubic structure e.g., bulk BZT is a cubic system with lattice parameter a = 0.4093 nm whereas, BZT thin film crystallizes in a cubic structure with lattice parameter a = 0.4192 nm [36] and [37]. During the last few decades, several studies are performed on microwave characteristics (dielectric loss and quality factor) of BMT, BZT, solid solution of BZT with ZrO2 and BaZrO3, BZT thin films on Pt-coated Si substrate, barium substituted Pb(Zn1/3Ta2/3)O3 synthesized by different techniques [27], [28], [29], [30], [31] and [32]. It is noteworthy that according to these studies the tantalum based complex perovskites Ba( B′1/3 B″2/3)O3 exhibit ultra high value of quality factor Q and are very promising material having wide range of application possibilities (from mobile telephone to satellite broadcasting systems). Thus, Ta based perovskites deserve special attention. The investigation on the dielectric properties of BZT in microwave region has revealed that the increase of sintering temperature and additional annealing improve the dielectric parameters (especially dielectric loss) [38]. The quality factor Q of BZT strongly depends upon crystalline structure, cationic order and unit cell distortion [38]. The weak field dielectric (∼1 Vrms/mm) properties of Pb(Zn1/3 B″2/3)O3 (where B″ = Nb, Ta) with lead (Pb) partly/fully substituted by Ba have been widely investigated in the low frequency region (1–1000 kHz) [35] and [36]. The highest values of the dielectric constants in these systems have been obtained for a threshold value of Ba concentration and the maximum values of the dielectric constants for Nb based system are much higher than those in Ta based systems [36].
Recently, the investigations on dielectric properties of Nb based 1:2 ordered perovskite oxides have undergone a rapid growth due to their promising electrical properties. Frequency dependence of the real and imaginary part of the dielectric permittivity of A(Mg1/3Nb2/3)O3 (where A = Ca, Ba and Sr) in the frequency range, 100 Hz–1 MHz and at different temperatures between 303 and 633 K has been explored in detail by Cole–Cole method [20], [21], [22], [23], [24], [25] and [26]. It has been found that the values of most probable relaxation frequencies of these systems obey Arrhenius law. Moreover, the alternating current impedance spectroscopic study (ACIS) suggested that the relaxation frequency of these samples is strongly temperature dependent although relaxation in these samples follows same mechanism. Thus, detailed investigations on 1:2 ordered niobates have provided very interesting results on their dielectric relaxation behavior and conduction mechanism. It may also be noted that the ionic radii of Nb and Ta are reported to be identical (0.064 nm) [27]. It therefore emerges that in spite of several investigations in microwave range, a systematic study on dielectric property and the electrical conductivity of BBTs at low frequencies (100 Hz–1 MHz) and wide temperature range can provide interesting results on their dielectric properties, low frequency relaxation behavior and the electrical conductivity. Though the dielectric properties of barium nickel tantalate (BNT) have been studied very recently in frequency range from 100 Hz to 1 MHz and temperature range from 393 to 573 K [33], to the best of our knowledge, no such studies on BMT and BZT synthesized by solid state reaction technique have been carried out so far. In this background the systematic studies on structural, microstructural, dielectric properties at low frequencies and the electrical conductivity (ac and dc) of BMT and BZT along with comparison of the present outcomes with the results of their previously reported Nb based counterparts appear to be very interesting.
Studies on structural and microstructural properties along with electrical conductivity of ceramic oxides have also provided interesting results [39]. In this context, the ACIS is a very versatile and powerful experimental technique for examining electrical properties of materials. This method enables us to analyze the dielectric properties and obtain the correlation between electrical and structural/microstructural properties of a material. It also gives us the opportunity to separate out the contributions from various regions (i.e., grains, grain boundaries, interfaces, etc.) in the dielectric parameters of polycrystalline materials. The analysis of the dielectric data obtained by ACIS study in different formalisms allows us to extract different features of the material under investigation [20], [21], [22], [23], [24], [25], [26] and [33].
Thus in this paper we report the structural, microstructural, dielectric property, ac and dc conductivity of BMT and BZT synthesized by solid state reaction technique. The dielectric parameters and ac conductivity of the samples have been measured at low frequencies (50 Hz–1 MHz) over a wide range of temperature. The study of dielectric parameters, such as dielectric constant, loss tangent, electric modulus etc. in these oxides over a wide range of frequency and temperature has helped us in assessing their insulating character and application possibilities. The powder X-ray diffraction (PXRD), field emission scanning electron microscopic (FESEM), ACIS and four probe techniques have been employed to achieve our goal.
The polycrystalline BMT and BZT perovskite oxides were synthesized by ceramic route. Powders of BaCO3 (reagent grade), MgO (reagent grade), ZnO (99% in purity) and Ta2O5 (reagent grade) were taken in stoichiometric ratio and blended in an agate mortar for 10 h in the presence of acetone. The blended powder was calcined in a Pt crucible at 1623 K in air for 16 h and then brought to room temperature under controlled cooling at the rate of 100 K h-1.
PXRD patterns of these samples were recorded at room temperature by a Rigaku Miniflex II X-ray powder diffractometer with a scan speed of 2° min-1 at scan step of 0.02° using Cu Kα radiation over a range of Bragg angles 10° ≤ 2 θ ≤ 80°. In the PXRD patterns of the samples, only the characteristic diffraction peaks for perovskite structure have been observed. There is no additional peak corresponding to any of the ingredient used or the probable impurity phases in the PXRD patterns. So, samples obtained after calcinations are single phase perovskite oxides. Now for the sake of better crystallizations the calcined samples were pelletized into a disc using polyvinyl alcohol as binder and then these discs were sintered at 1673 K for 12 h. Afterward, the samples were cooled down to room temperature at the cooling rate of 1 K min-1. These sintered discs were polished thoroughly. The thickness and the diameter of these discs are 2.18 and 10.49 mm, 1.535 and 7.27 mm for BMT and BZT respectively. The electrodes were fabricated on both flat surfaces of these discs by coating them with fine silver paint followed by heating at 473 K for 2 h. The morphological and microstructural characterizations of the samples were performed by FESEM (Hitachi S-4800).
The capacitance ( C) and conductance ( G) were measured using an LCR meter (HIOKI 3532) in the frequency range, 50 Hz–1 MHz and at the oscillation voltage of 1.0 V. The measurements were conducted over the temperature range of 393–573 K. Samples were heated at a rate of 0.5 K min-1 and the data were collected in the heating cycle. The measurement temperatures were kept constant with an accuracy of ±1 K using programmable cooling–heating system. The loss tangent (tan δ = G/( ωC)), the complex impedance ( Z* = 1/( iωC0 ɛ*)) and the ac electrical conductivity ( σ = ωɛ0 ɛ″) were obtained from the temperature dependence of the real ( ɛ′ = C/ C0) and imaginary ( ɛ″ = ɛ′tan δ) components of the complex dielectric constant ( ɛ∗ = ɛ′ - iɛ″), ω is the angular frequency ( ω = 2π ν) and
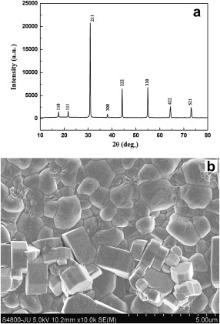
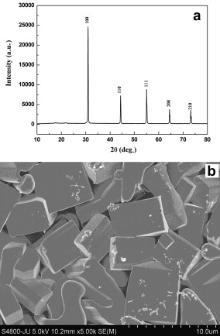
The PXRD patterns of the BMT and BZT are shown in Figs. 1(a) and 2(a), respectively. The PXRD patterns are indexed by the Rietveld based program NTREOR of EXPO2009 package. No unaccounted diffraction peak has been noted in the PXRD patterns of the samples (Figs. 1(a) and 2(a)). The analysis of PXRD pattern suggests that samples are in single phase and they have crystallized in cubic structure, with lattice parameter a = 0.708 nm for BMT and 0.451 nm for BZT. However according to previous reports, BMT is a hexagonal system having lattice parameters a = 0.5782 nm and c = 0.7067 nm whereas BZT possesses cubic structure with lattice parameter a = 0.41 nm [34], [35], [36] and [37]. Thus the results of our PXRD study for BZT corroborate with previous results [36] and [37], but for BMT, the result of present structural study totally disagrees with the result reported previously [34] and [35].
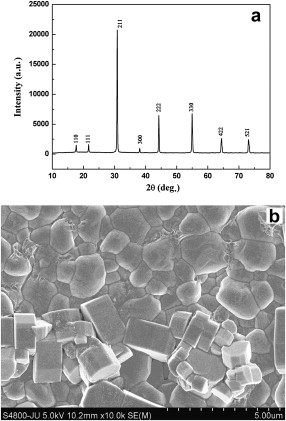 | Fig. 1. XRD pattern (a) and SEM image (b) of Ba(Mg1/3Ta2/3)O3. |
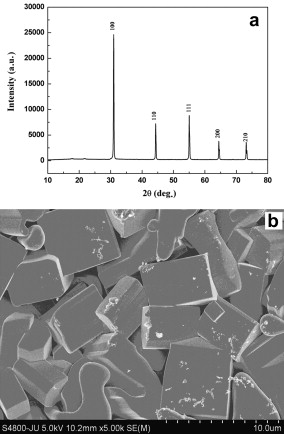 | Fig. 2. XRD pattern (a) and SEM image (b) of Ba(Zn1/3Ta2/3)O3. |
The Goldschmidt's tolerance factor Tf of ABO3 type oxides is given by the formula
(1)
where r A and rO are the ionic radii of A site and O ions, respectively and r B denotes the average radius of ions at B site [40]. It may be noted that Tf is ≈1 for cubic perovskites, while for monoclinic or orthorhombic structures, Tf is usually <1 [33], [40], [41] and [42]. The values of Tf for BMT and BZT are 1.029 and 1.026, respectively, and the closeness of these values of Tf to 1 indicates that both BMT and BZT are cubic perovskite. Thus, the Tf values of the samples strongly support the results obtained by PXRD profile fitting and discard the previous reports on the structural studies of BMT.
The FESEM micrographs of BMT and BZT are presented in the Figs. 1(b) and 2(b), respectively. In the FESEM images, the samples displayed well-defined grains. The grain size is in the range of 0.28–1.76 μm and 1.39–6.67 μm for BMT and BZT, respectively. The grains of BMT and BZT are non-uniform in size. The grains of BMT have irregular shape, whereas the grains of BZT are rectangular in shape.
The logarithmic angular frequency ( ω = 2π υ) dependence of the real part ( ɛ′) of complex dielectric permittivity ( ɛ*) and loss tangent (tan δ) of the samples at some selective temperatures between 393 and 573 K have been depicted in Figs. 3 and 4. The plateaus in the ɛ′ vs log ω curves (Figs. 3(a) and 4(a)) move towards the higher frequency with increasing temperature. The nature of the ɛ′ vs log ω curves for the samples can be elucidated by Debye theory [43]. According to Figs. 3(a) and 4(a): (i) at low frequencies (where ω <<1/ τ, τ is the relaxation time), ɛ′ is almost constant, i.e., ɛ′ ≈ ɛs (the value of the dielectric constant at quasistatic field), so in low frequency range, the dipoles follow the electric field; (ii) in the frequency range where ω <1/ τ, the ɛ′ decreases slightly which implies that in this frequency range dipoles in the samples begin to lag behind the field; (iii) ɛ′ drops very sharply at the characteristic frequency where ω = 1/ τ. Thus our results strongly support the Debye theory of dielectric permittivity [43].
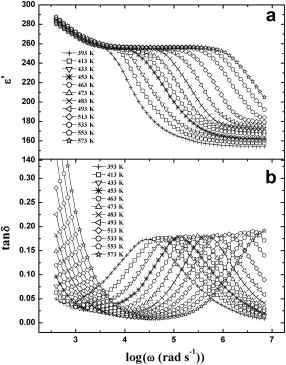 | Fig. 3. Frequency dependence of ɛ′ (a) and tan δ (b) of Ba(Mg1/3Ta2/3)O3 at various temperatures. |
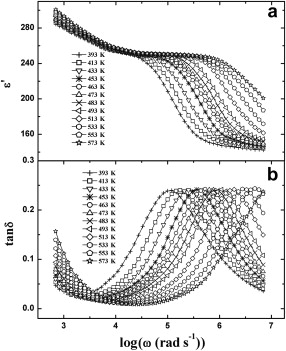 | Fig. 4. Frequency dependence of ɛ′ (a) and tan δ (b) of Ba(Zn1/3Ta2/3)O3 at various temperatures. |
Here, ɛ′ decreases sharply at higher frequencies. It is well known that the rate of polarization formed and the frequency of applied electric field control the dielectric relaxation process. Thus, the sharp decrease in ɛ′ at higher frequencies is thought to be due to the decay in polarization at higher frequencies of the applied electric field. It may be noted that at a particular temperature for a given frequency the values of ɛ′ for BMT and BZT are nearly equal. The reported value of ɛ′ of BNT is greater than that obtained for BMT and BZT. It is noteworthy that the ionic radius are rZn ≈ rMg > rNi. This reveals that the ionic radii of B type cations (alkaline earth element/transition metal) of the sample have an influence on the value of dielectric permittivity of Ba( B′1/3Ta2/3)O3 ( B′ = Ni, Mg and Zn) type oxides.
A peak in tan δ appears when the hopping frequency of the charge carriers is approximately equal to that of the externally applied field, i.e., when ω = 1/ τ. Now, in the present case, a well defined peak is observed in the tan δ vs log ω plots (Figs. 3(b) and 4(b)) of BMT and BZT and tan δ exhibits strong dispersions. These are indicative of the presence of dielectric relaxation in the samples. The peak in tan δ vs log ω curves for both the samples gets shifted towards higher frequency with increasing temperature as the polarization evolved at a high rate at higher temperatures. It is clearly evident from Figs. 3 and 4, the peak in tan δ is centered approximately at the characteristic frequency ( ω = 1/ τ) obtained from the ɛ′ vs log ω curves. This indicates that there is a strong correlation between dielectric behavior and the conduction mechanism of the samples as ɛ′ accounts for the dielectric property while tan δ is connected with the conduction loss. We have adopted the conductivity and electric modulus formalisms to study the relaxation mechanism of BMT and BZT.
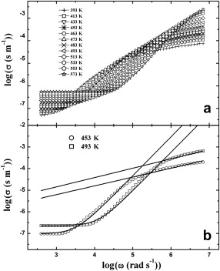
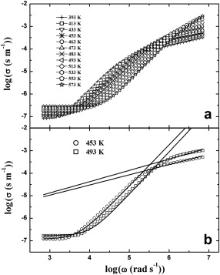
Figs. 5(a) and 6(a) show the frequency dependence of ac conductivity for BMT and BZT at different measuring temperatures, respectively. The real part of ac conductivity ( σ) is given by σ( ω) = ɛ0 ωɛ″. Two distinct plateaus are observed in the Figs. 5(a) and 6(a). The low frequency plateau represents the total conductivity whereas the high frequency plateau represents the contribution of grains to the total conductivity [26]. The presence of both the high and low frequency plateaus in conductivity spectra suggests that the two processes are contributing to the bulk conduction behavior. The total conductivity at a given temperature can be expressed by the power law of frequency,
σ(ω)=σdc+Aωn (2)
where σdc is the dc conductivity (the value of conductivity at the lowest frequency is taken as the dc conductivity of the samples) and A depends both on temperature and frequency.
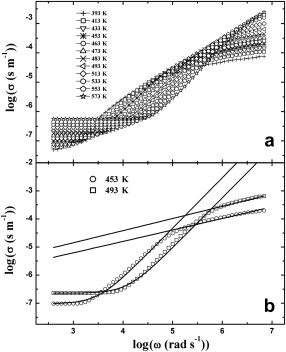 | Fig. 5. (a) Frequency dependence of the conductivity ( σ) for Ba(Mg1/3Ta2/3)O3 at various temperature, (b) fittings of power law for the same at 453 and 493 K shown by solid lines. |
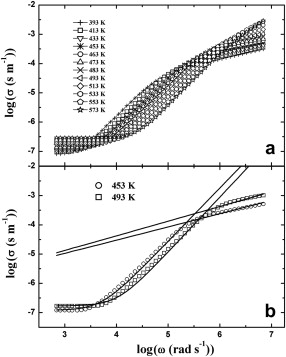 | Fig. 6. (a) Frequency dependence of the conductivity ( σ) for Ba(Zn1/3Ta2/3)O3 at various temperature, (b) fittings of power law for the same at 453 and 493 K shown by solid lines. |
In order to account for the two plateaus, the conductivity spectra are fitted by a pair of power law equations at two selected temperatures and are presented in Figs. 5(b) and 6(b). The basic power law used for this purpose is given by Eq. . The exponent n in the lower frequency region is found in the range of 1.5–1.9 and increases with increasing temperature [27]. In the high frequency region, the values of n are found to be in 0.4–0.6 [44]. The estimated fitting parameters are listed in . The low and high frequency regions represent the non-diffusing and localized diffusing modes, respectively. Based on this proposition, Ishii et al. [45] showed that the exponent n is greater than 1 and tends to attain 2 with increasing temperature in lower frequency region whereas it is less than 1 in the higher frequency region. Our results strongly corroborate this theory.
| Table 1. Various fitted parameters of the conductivity spectra |
The electric modulus formalism offers the best opportunity to analyze the relaxation properties of polycrystalline ceramics [45] and [46]. The electric modulus represents the relaxation of the electric field in the sample when the electric displacement remains constant. It can be used to monitor the electrical properties of the material and is a useful technique to investigate the influences of temperature and frequency on the relaxation processes. The electric modulus M*( ω) is defined by the relation [47]:
where the function Φ( t) gives the time evaluation of the electric field within the dielectric.
The angular frequencies of real ( M′) and imaginary ( M″) parts of the complex electrical modulus as a function of temperature for BMT and BZT are shown in Figs. 7 and 8, respectively. Distinct peaks have been observed in the M″ vs log ω plots for both the samples. These pronounced peaks for M″( ω) clearly indicate that the samples exhibit relaxation phenomena. The peaks in M″( ω) shift towards higher frequencies with increasing temperature, which indicates that the relaxation rate enhances as the temperature increases. The frequency region below peak maximum ( M″m) determines the range in which the charge carriers are mobile at long distances. At frequencies above peak maximum the carriers are confined to potential wells, being mobile on short distances. There may be a slight amount of oxygen vacancy in the present samples as they are synthesized at high temperature of about 1623 K. If vacancies are created then the space available for dipole vibration gets elongated, which in turn facilitates the short-range hopping of the ions and gives rise to strong relaxation. This feature has been noticed in the M″ vs log ω curves of both the samples.
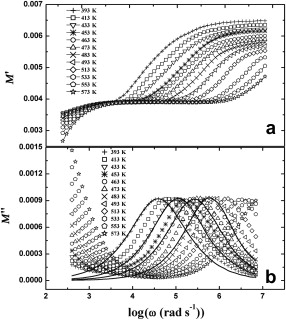 | Fig. 7. Frequency dependence of M′ (a) and M″ (b) of Ba(Mg1/3Ta2/3)O3 at various temperatures where symbols are the experimental points and solid lines are the fitting to Eq. . |
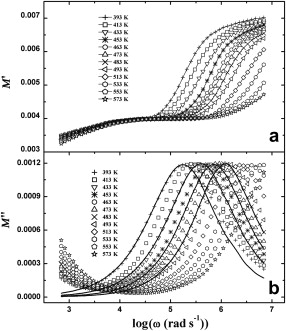 | Fig. 8. Frequency dependence of M′ (a) and M″ (b) of Ba(Zn1/3Ta2/3)O3 at various temperatures where symbols are the experimental points and solid lines are the fitting to Eq. . |
The large width of the loss peaks in tan δ vs log ω plots (Figs. 3(b) and 4(b)) suggests that the relaxation in the sample is polydispersive in nature. To account this effect we have considered a temperature dependent distribution function, g( τ, T) for relaxation time and expressed the imaginary part of complex dielectric permittivity as follows [26]:
where ɛ(0, T) is the low frequency dielectric constant. In the limit of τmin<1/ ω< τmax, the real and imaginary parts of dielectric permittivity are connected by the simple relation [48] and [49]:
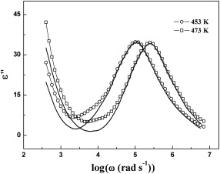
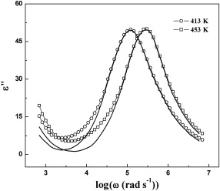
ɛ″ has been numerically calculated from the dispersion of ɛ′ by using Eq. and has been plotted against log ω along with the experimentally obtained values of ɛ″ (= ɛ′tan δ) at different logarithmic angular frequencies. The results are presented in Figs. 9 and 10 for BMT and BZT, respectively. A good matching between the experimentally obtained values of ɛ″ (= ɛ′tan δ) and those calculated by Eq. reveals that the spectrum g( τ, T) is broad in nature, i.e., samples exhibit polydispersive relaxation process. This could be further verified by Cole–Cole approach of electrical modulus formalism.
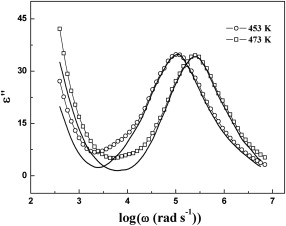 | Fig. 9. Comparison of measured ɛ″ vs log ω for Ba(Mg1/3Ta2/3)O3 with that calculated using Eq. at 453 and 473 K. The open symbols joined with line represent the experimental points and solid lines represent the ɛ″ calculated using Eq. . |
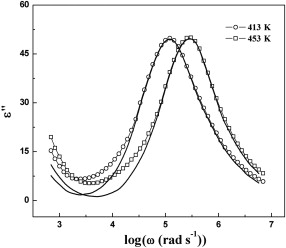 | Fig. 10. Comparison of measured ɛ″ vs log ω for Ba(Zn1/3Ta2/3)O3 with that calculated using Eq. at 413 and 453 K. The open symbols joined with line represent the experimental points and solid lines represent the ɛ″ calculated using Eq. . |
We already have shown that the relaxation exhibited by the samples is polydispersive in nature. To crosscheck our previous finding we have fitted the experimental electric modulus spectra of BMT and BZT with the Cole–Cole expression [50]:
where
A=[1+2ωt1-αsin(απ/2)+ωt2(1-α)]1/2 (7)
and
Φ=tan-1{(ωt)1-αcos(απ/2)/[1+(ωt)1-αsin(απ/2)]} (8)
where M″ is the imaginary part of complex electric modulus. The polydispersive nature of the dielectric relaxation can be examined very easily by the Cole–Cole model. The Cole–Cole constant α will be positive but less than one (i.e., 0< α<1) when the dielectric relaxation in the sample is polydispersive in nature [51]. The solid lines in Figs. 7(b) and 8(b) represent the fitting of Cole–Cole functions. The estimated values of fitting parameters ( M∞, Msand α) at different temperatures are presented in. A very nice matching between the experimental and fitted results with 0< α<1 indicates that the relaxation in the samples is polydispersive in nature.
| Table 2. Various Cole–Cole fitted parameters of the modulus formalism |
The activation energy of BMT and BZT has been estimated from the temperature dependence of dc conductivity ( σdc), most probable relaxation frequency obtained from tan δ vs log ω plots and M″ vs log ω plots. The reciprocal temperature dependence of σdc (which is measured by four probe method) for BMT and BZT is shown in Fig. 11. The σdc of both the samples follows Arrhenius law, σdc=σ0exp(-Eσ/(kbT)) with activation energy E σ = 0.54 eV and 0.41 eV for BMT and BZT, respectively. Again the value of σdc for both the samples increases with increasing temperature. Thus the results of dc conductivity study clearly indicate that BMT and BZT exhibit semiconducting behavior.
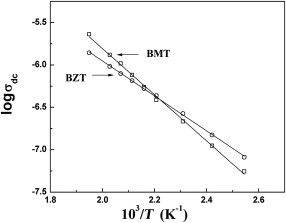 | Fig. 11. Temperature dependence of dc conductivity for Ba(Mg1/3Ta2/3)O3 and Ba(Zn1/3Ta2/3)O3, respectively. Symbols are experimental points and solid lines are least squares straight-line fit. |
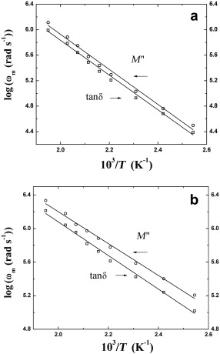
A well defined peak has been obtained in the tan δ vs log ω plots and M″ vs log ω plots of all the samples at each of the measurement temperatures. The most probable relaxation frequency ( ωm) can be obtained from the relation ωm τm = 1, where τm is the most probable relaxation time. Fig. 12 depicts the log ωm vs 103/ T plots of BMT and BZT, where log ωm has been determined from the peak position of loss tangent and electrical modulus spectra (Figs. 3(b), 4(b), 7(b) and 8(b)) of the respective samples. A numerical fitting of the log ωm vs 103/ T plots for BNT and BZT has been carried out ( Fig. 12) and it has been found that the most probable relaxation frequency follows the Arrhenius law:
where ω0 is the pre-exponential factor and Ea is the activation energy of the corresponding process. The activation energies of BMT and BZT for tan δ are 0.54 and 0.40 eV, respectively and for M″ are 0.55 and 0.38 eV, respectively. These values match very well with the activation energies obtained from the Arrhenius plot of dc conductivity data. Thus, our results strongly suggest that all the samples are semiconducting in nature.
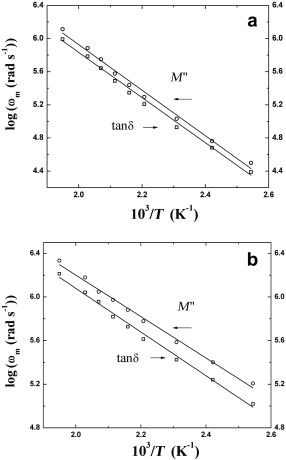 | Fig. 12. Temperature dependence of the most probable relaxation frequency obtained from the frequency dependent plots of tan δ and M″ for Ba(Mg1/3Ta2/3)O3 (a) and Ba(Zn1/3Ta2/3)O3 (b), respectively. The symbols are the experimental points and the solid lines are the least squares straight-line fit. |
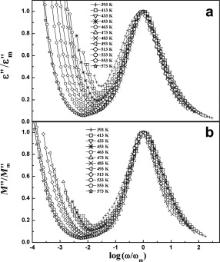
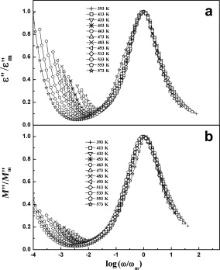
We have scaled each ɛ″ by ɛ″m and M″ by M″m, where ɛ″m and M″m are the peak values of the imaginary part of dielectric permittivity and electrical modulus, respectively. Similarly, each frequency is scaled by ωm ( ωm corresponds to the frequencies of the peak positions of ɛ″ and M″ in the ɛ″ vs log ω plots and M″ vs log ω plots, respectively). Figs. 13 and 14 display the scaling behavior of ɛ″ and M″ at various temperatures for BMT and BZT. The perfect overlapping of these curves (excepting the low frequency region) recorded at different temperatures implies that the relaxation in the samples obeys the same mechanism at different temperatures in BMT and BZT [27]. The results of dielectric permittivity study indicate that for the present samples dipoles follow the applied field at low frequencies (where ω <<1/ τ) because the scaled curves do not overlap at low frequencies.
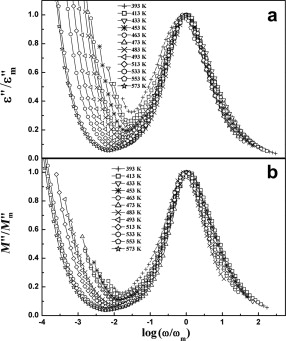 | Fig. 13. Scaling behavior of ɛ″ (a) and M″ (b) at various temperatures for Ba(Mg1/3Ta2/3)O3. |
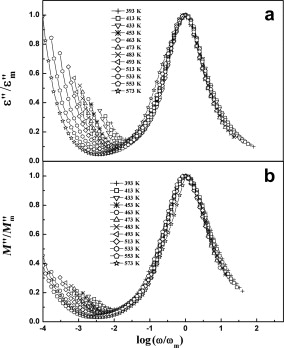 | Fig. 14. Scaling behavior of ɛ″ (a) and M″ (b) at various temperatures for Ba(Zn1/3Ta2/3)O3. |
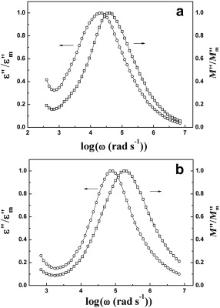
The frequency dependence of normalized peaks of ɛ″/ ɛ″m and M″/ M″m vs log ω for BMT and BZT has been plotted ( Fig. 15). This formalism helps us to elucidate the nature of relaxation process. The overlapping of peak positions is the evidence of long-range (ionic or electronic) conduction process, on the other hand, peaks will not overlap for localized (defect) relaxation [30] and [33]. As in BMT and BZT both long-range and localized relaxation are present, therefore perfect overlapping between the normalized peaks does not occur.
 | Fig. 15. Frequency dependence of normalized peaks of ɛ″/ ɛ″m and M″/ M″m vs log ω for Ba(Mg1/3Ta2/3)O3 at 393 K (a) and Ba(Zn1/3Ta2/3)O3 at 393 K (b). |
It may be noted that at each temperature of measurement, a plateau has been observed in the ɛ′ vs log ω (Figs. 3(a) and 4(a)) and M′ vs log ω (Figs. 7(a) and 8(a)) plots of both the samples. This plateau shifts to the higher frequency with increasing temperature. The plateau observed in the ɛ′ vs log ω plot at 483 K ranges between 100 Hz and 700 Hz for BMT ( Fig. 3(a)) and from 100 Hz to 4.4 kHz for BZT ( Fig. 4(a)). For M′ vs log ω (Figs. 7(a) and 8(a)) plot at 483 K, the plateaus are observed within the same frequency ranges. Further to note that for BMT and BZT, the peak in tan δ vs log ω plot at 483 K is centered about 70 kHz ( Fig. 3(b)) and 146 kHz ( Fig. 4(b)), respectively while in the M″ vs log ω plot of BMT and BZT at 483 K, the peaks are observed at 100 kHz ( Fig. 7(b)) and 170 kHz ( Fig. 8(b)), respectively. Thus the characteristic frequency of BZT is greater than that of BMT. The temperature dependences of σdc and ωm obtained from tan δ vs log ω plots obey the Arrhenius law. The ωm obtained from M″ vs log ω plots also obeys the Arrhenius law. According to Arrhenius plots of σdc, the activation energies of BMT and BZT are 0.54 and 0.41 eV, respectively. The activation energies determined by using ωm obtained from tan δ vs log ω plots are 0.54 and 0.40 eV, while that estimated by using ωm obtained from M″ vs log ω plots are 0.55 and 0.38 eV, respectively for BMT and BZT. The nearly same activation energy for dc conductivity and dielectric relaxation as obtained from the temperature dependence of most probable relaxation time for tan δ indicates that the same charge carriers are responsible for dielectric relaxation and conductivity of the samples.
According to our previous study on A(Ni1/3Ta2/3)O3 (where A = Ba, Ca and Sr) systems, the dielectric permittivity is the highest for barium nickel tantalate and the lowest for calcium nickel tantalate. It may be noted that the ionic radius are rBa > rSr > rCa. Taking account of our present and previous studies [33], we can conclude the dielectric permittivity of BNT > BMT ≈ BZT and the ionic radius of Zn ≈ Mg > Ni. It is therefore clear that in the case of complex perovskite oxides with general formula A( B′ B″)O3, ionic radii of both A and B cations have significant influences on their dielectric properties. The dielectric permittivity of BMT and BZT are better than that of the A(Mg1/3Nb2/3)O3 (where A = Ba, Ca and Sr) systems [25], [26] and [27]. The dielectric permittivity and the loss tangent are also comparable to that for A(Ni1/3Ta2/3)O3 (where A = Ba, Ca and Sr) systems [36]. Our study also indicates that the dielectric properties of these compounds are improved significantly with increasing ionic radii of A cations but with decreasing ionic radii of B cations. The loss tangents of BMT and BZT are low. Therefore the samples may be utilized in various technological applications like capacitors, resonators, filters and integrated circuits.
The structural characterization of complex perovskite oxide BMT and BZT has been performed along with the field dependence of dielectric response and the conductance of the samples are investigated in a frequency range of 50 Hz to 1 MHz and in a temperature range of 393–573 K. The compounds show significant frequency dispersion in their dielectric properties. According to PXRD study, BMT and BZT are single phase cubic perovskite oxides. The grain size lies 0.28–1.76 μm and 1.39–6.67 μm for BMT and BZT, respectively. The logarithmic angular frequency (log ω) dependence of the real part of complex dielectric permittivity and loss tangent (tan δ) reveal that the compounds exhibit significant frequency dispersion in their dielectric properties. It has been shown that the relaxation in the samples is polydispersive in nature. Both localized and long-range relaxations are present in the samples. The temperature dependence of ωm obtained from tan δ vs log ω plots follows the Arrhenius behavior. The most probable relaxation frequency ( ωm) obtained from M″ vs log ω plots also obeys the Arrhenius law. According to Arrhenius plots of σdc, the activation energies of BMT and BZT are 0.54 and 0.41 eV, respectively. The activation energies determined by using ωm obtained from tan δ vs log ω plots are 0.54 and 0.40 eV, while that estimated by using ωm obtained from M″ vs log ω plots are 0.55 and 0.38 eV, respectively for BMT and BZT. These results are in good agreement with each other and suggest that both the samples are semiconducting in nature. The frequency-dependent conductivity spectra follow a power law. The relaxation mechanism of the samples in the framework of electric modulus formalism is modeled by the Cole–Cole equation. The scaling behavior of ɛ″ and M″ shows the temperature-independent nature of the relaxation mechanism.
This work is financially supported by the Defence Research Development Organization, Government of India, New Delhi, FIST and PURSE programs of Department of Science and Technology, Government of India.
| 1. |
|
| 2. |
|
| 3. |
|
| 4. |
|
| 5. |
|
| 6. |
|
| 7. |
|
| 8. |
|
| 9. |
|
| 10. |
|
| 11. |
|
| 12. |
|
| 13. |
|
| 14. |
|
| 15. |
|
| 16. |
|
| 17. |
|
| 18. |
|
| 19. |
|
| 20. |
|
| 21. |
|
| 22. |
|
| 23. |
|
| 24. |
|
| 25. |
|
| 26. |
|
| 27. |
|
| 28. |
|
| 29. |
|
| 30. |
|
| 31. |
|
| 32. |
|
| 33. |
|
| 34. |
|
| 35. |
|
| 36. |
|
| 37. |
|
| 38. |
|
| 39. |
|
| 40. |
|
| 41. |
|
| 42. |
|
| 43. |
|
| 44. |
|
| 45. |
|
| 46. |
|
| 47. |
|
| 48. |
|
| 49. |
|
| 50. |
|
| 51. |
|