
A Comparativein vitro Study on Biomedical Zr–2.5X (X = Nb, Sn) Alloys
[Zhou F.Y.1 , Qiu K.J.1 , Bian D.2 , Zheng Y.F.1, *  , Lin J.P.
3 ]
, Lin J.P.|
|


Nb and Sn are major alloying elements in Zr alloys. In this study, the microstructure, mechanical properties, corrosion behavior, cytocompatibility and magnetic resonance imaging (MRI) compatibility of Zr–2.5
Ti and Ti alloys have been widely used in biomedical applications owing to their superior corrosion resistance, biocompatibility and osseointegration [1], [2] and [3]. Zr and Ti have similar chemical properties and Zr is also non-toxic and biocompatible [4] and [5]. The use of Zr and its alloys as implants in traumatology, orthopedics and stomatology has been previously reported [6] and [7]. A dense and cohesive oxide film (namely ZrO2) spontaneously forms on the surface of Zr metal in various electrolytes, which not only resists to corrosion of the substrate, but also determines the degree of its biocompatibility and osseointegration. In addition, in comparison with Ti, Zr does not form calcium phosphate (main component of human bone) but Zr phosphate on its surface in Hank's solution [8]. Thus, Zr has been considered to be more suitable for removable bone fixation devices than Ti, as the former may minimize the assimilation with bone, reducing the risk of refracture during removal operation. However, when good fusion with bones is required, for instance with endosseous implants, several novel techniques of surface modification have been developed for improving the osseointegration ability, such as alkaline treatment [9] and [10], the sol–gel method [11], anodization [12] and micro-arc oxidation [13].
Currently, magnetic resonance imaging (MRI) has become a powerful diagnostic tool in orthopedics and brain surgery and its use is on the rise. However, MRI diagnosis is inhibited with presence of metallic implants in the body because they become magnetized in the intense magnetic field of the MRI machine, which may produce image artifacts and therefore prevent the exact diagnosis [14] and [15]. Additionally, another potential risk of metallic implants is the displacement under the force and torque produced by the magnetic field [16]. To overcome these drawbacks, medical devices with low magnetic susceptibility ( χ) are required. Compared to stainless steel, Co–Cr alloys and Ti, Zr has lower magnetic susceptibility and is more suitable for implants than the others within an MRI system [17]. Therefore, developing novel Zr alloys with excellent biocompatibility and MRI compatibility is highly of interest.
Nb and Sn are the major alloying additions for Zr alloy utilized in the nuclear industry. Besides, they are non-toxic elements and have been introduced into the biomedical metals [18]. The addition of Nb to Zr has been demonstrated to sufficiently improve its mechanical strength and corrosion resistance [19] and [20]. Because of its favorable mechanical properties, corrosion resistance and biocompatibility, the wrought Zr–2.5Nb alloy for orthopedic implant application has been written into ASTM standard [21]. In addition to the wrought-annealed condition, the as-cast Zr–3Nb and Zr–20Nb alloys with excellent mechanical properties and low magnetic susceptibility have been recommended for the medical devices used in MRI [19]. Moreover, previous study has shown that a cold-rolled Zr–14Nb alloy is also a promising alloy from the perspective of MRI compatibility [22]. In addition to excellent biocompatibility and MRI compatibility, another unique feature of Zr alloy is that they can undergo surface thermal oxidation at elevated temperature to form a hard, dense, cohesive and abrasion-resistant ceramic oxide layer [23]. The surface oxidized Zr–2.5Nb alloy has been commercially used as artificial knee and hip joints owing to its superior wear resistance [24] and [25]. Meanwhile, it is also pointed out that oxidized Zr–Sn alloy shows great potential for oral implantology application [26].
In this study, a comparative study of biomedical Zr–2.5 X ( X = Nb, Sn) alloys in terms of their microstructure, mechanical properties, corrosion performance and in vitro cytocompatibility is carried out. Their magnetic susceptibilities are also measured for assessing the MRI compatibility. The objective of this study is to investigate the influence of alloying addition (Nb and Sn) on the properties of the Zr–2.5 X ( X = Nb, Sn) alloys and provide basic information for alloying design in the future.
The binary Zr–2.5 X ( X = Nb, Sn) alloys with the nominal composition of 2.5 wt% were prepared in a non-consumable arc melting furnace under an Ar atmosphere. Each alloy ingot was re-melted six times by inversion to improve the chemical homogeneity. The actual chemical compositions of prepared Zr–2.5 X alloys were determined by energy dispersive spectrometry (EDS) and the results are listed in . The obtained ingots were then hot-rolled to ∼1.5 mm thick sheets at 750 °C. After that, the rolled sheets were annealed at 500 °C for 1 h. Pure Zr was also prepared in the same method and measured for comparison.
| Table 1. Chemical compositions of Zr–2.5 X alloys analyzed by EDS (in wt%) |
The constituent phase of Zr–2.5 X ( X = Nb, Sn) alloys was analyzed using an X-ray diffractometer (XRD) with a Ni filtered Cu Kα radiation. The microstructure of the alloys was examined by optical microscopy (OM). The samples for the OM were mechanically polished via a standard metallographic procedure and then etched in a solution of HF, HNO3 and H2O (1:4:5 in volume).
The uniaxial tensile test was performed with an initial strain rate of 5 × 10⁻⁴ s-1 on a mechanical tester (Instron3365) at room temperature. The 0.2% offset yield strength (YS) and ultimate tensile strength (UTS) were obtained from the stress–strain curve. For each alloy, five duplicate specimens were tested. The hardness of Zr–2.5 X ( X = Nb, Sn) alloys was determined by a digital Vickers microhardness tester (HMV-2T) with a 1.961 N load and 15 s dwell time.
Electrochemical corrosion tests were carried out in a three-electrode system at a constant temperature of 37.0 ± 0.5 °C in a water bath. A saturated calomel electrode (SCE) and a palladium foil were used as reference electrode and counter electrode, respectively. The electrolyte used to simulate human body condition was normal saline with neutral pH value. The open-circuit potential (OCP) of the tested sample was continuously monitored for 2 h in normal saline solution. After the 2 h exposure, the potentiodynamic polarization measurement was conducted from −0.8 V to 1.2 V (vs SCE) with a scan rate of 1 mV/s. In order to characterize the chemical state of elements and the composition of the passive film, the tested sample after potentiodynamic polarization was examined by X-ray photoelectron spectroscopy (XPS). XPS analysis was performed with an Axis Ultra spectrometer using mono AlKα radiation at vacuum pressure of 10-9 bar (10-4 Pa), 15 kV and 15 mA. The binding energy was calibrated using C 1s hydrocarbon peak at 284.8 eV.
The cytotoxicity test was carried out based on the instruction of ISO 10993-12:2007 [27]. Murine fibroblast cells (L-929) and human osteosarcoma cells (MG 63) were chosen to evaluate the cytotoxicity of pure Zr and Zr–2.5X ( X = Nb, Sn) alloys in their extracts. L-929 cells and MG 63 cells were cultured in Dulbecco's modified Eagle's medium (DMEM) and minimum essential medium (MEM), respectively. Each medium was supplemented 10% fetal bovine serum (FBS), 100 U/ml penicillin and 100 μg/ml streptomycin. For the preparation of extracts, serum free culture medium was used as the extraction medium. For each 3 cm2 of material, 1 ml of culture medium was used and then incubated for 72 h. The amount of metal ions released into the extracts was measured by an inductively coupled plasma atomic emission spectrometry (Profile ICP-AES). In addition, the culture medium was used as a negative control, and the medium containing 10% dimethylsulfoxide (DMSO) as a positive control. All the culturing was kept at 37 °C in a humidified atmosphere of 5% CO2 in an incubator. Cells were seeded in 96-well cell culture plates at an initial density of 5 × 10³ cells/100 μl medium and incubated for 24 h to allow attachment. After that, the culture medium was substituted by the extract obtained from the studied material, and then incubated for 1, 3 and 5 days, respectively. After the culture period, 10 μl 3-(4, 5-Dimethylthiazol-2-yl)-2,5-diphenyltetrazolium bromide (MTT) was added to each well, followed by 4 h incubation in darkness. Then 100 μl formazan solubilization solution (10% SDS in 0.01 mol/l HCl) was added overnight in the incubator. The spectrophotometrical absorbance of the product in each well was measured by microplate reader (Bio-RAD680) at 570 nm with a reference wavelength of 630 nm.
The magnetic properties of pure Zr and Zr–2.5 X ( X = Nb, Sn) alloys were studied using a SQUID-VSM (superconducting quantum interference device-vibrating sample magnetometer) at room temperature. The magnetization (M) of sample as a function of applied magnetic field ( H) was measured and recorded, and its magnetic susceptibility, X = M/H, was obtained from the slope through linear fitting of the data. H was set from −15000 to +15000 Os. For each metal or alloy, three duplicate specimens were prepared and tested. In addition, pure Ti (Grade 2) and Ti–6Al–4V alloy were obtained and evaluated for comparison.
Statistical analysis was performed with SPSS 18.0 software. Differences between groups were analyzed using one-way analysis of variance (ANOVA), followed by post-hoc Tukey's test.
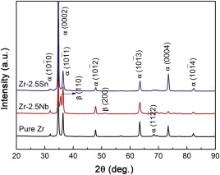
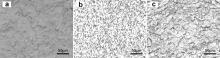
Fig. 1 shows the XRD patterns of pure Zr and Zr–2.5 X ( X = Nb, Sn) alloys. Only the peaks originated from α phase (hexagonal close packed) are observed in pure Zr. For Zr–2.5Nb alloy, peaks for the second phase β (body centered cubic) are visible except for the peaks from α phase. Moreover, the addition of Sn does not change the structure of Zr and only α phase is confirmed in Zr–2.5Sn alloy. Fig. 2 shows optical micrographs of pure Zr and Zr–2.5 X ( X = Nb, Sn) alloys. An equiaxed grains structure is observed in pure Zr. The Zr–2.5Nb alloy has a typical duplex microstructure which consists of second phase (dark) in a matrix of α phase, as shown in Fig. 2(b). In addition, the Zr–2.5Sn alloy exhibits a single phase structure.
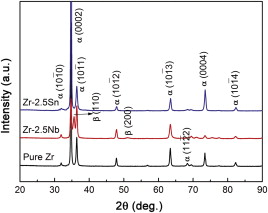 | Fig. 1. XRD patterns of pure Zr and Zr–2.5 X ( X= Nb, Sn) alloys at room temperature. |
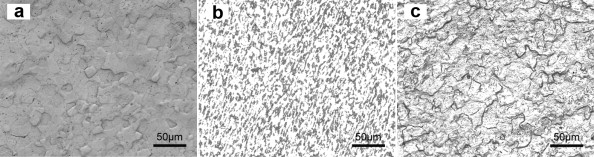 | Fig. 2. Optical micrographs of: (a) pure Zr, (b) Zr–2.5Nb alloy, (c) Zr–2.5Sn alloy samples. |
It is evident that the microstructure of Zr–2.5 X ( X = Nb, Sn) alloys differs from the various alloying elements of Nb and Sn. The element Nb was a β-stabilizer for Zr alloy and over 20% concentration β phase could be fully retained by quenching from the β phase field [28]. Zr–2.5Nb alloy is a typical two-phase alloy consisting of hexagonal α phase and cubic β phase. At the temperature below 600 °C, βZr phase will eventually transform into αZr (less than 0.6 wt% Nb) and βNb (~95 wt% Nb) under the equilibrium condition [29]. However, this transformation is very slow and the duplex microstructure consisting of αZr and metastable βZr (~20 wt% Nb) is usually obtained at room temperature. When hot working in (α+β) field, Zr alloys are subjected to dynamic recovery and dynamic recrystallization [30]. Their microstructure, including the phase constitution, distribution and volume fraction is strongly influenced by the process parameters as well as the following cooling. In this study, for the hot-rolled Zr–2.5Nb alloy plate material, discontinuous β phases present at the junction of the elongated α unites. According to Zr–Sn binary phase diagram, Sn raises the α–β transformation temperature and it has a solid solubility of 8.3 wt% in α-Zr [31]. So the addition of Sn with the amount of 2.5 wt% does not change the structure of Zr and Sn is fully dissolved into α-Zr matrix.
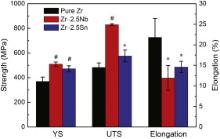
The mechanical properties of pure Zr and Zr–2.5 X ( X = Nb, Sn) alloys are shown in Fig. 3. It can be found that both the 0.2% offset yield strength (YS) and ultimate tensile strength (UTS) of Zr–2.5 X ( X = Nb, Sn) alloys are significantly higher than those of pure Zr. However, the increment in strength is much different for the various alloying elements. It is clearly shown that the strengthening effect produced by addition of Nb is stronger than that produced by addition of Sn. Moreover, the elongations of Zr–2.5 X ( X = Nb, Sn) alloys are significantly lower than that of pure Zr, whereas Zr–2.5Sn alloy shows larger elongation compared to Zr–2.5Nb alloy. The Vickers hardness of pure Zr, Zr–2.5Nb alloy and Zr–2.5Sn alloy is 249.8 ± 3.2, 310.4 ± 4.7 and 296.2 ± 6.2 HV, respectively. It can be seen that with 2.5 wt% addition, the hardness of alloys notably increases compared to pure Zr. In comparison with that of Zr–2.5Sn alloy, the higher hardness of Zr–2.5Nb alloy might be explained by the stronger hardening effect of Nb than that of Sn, as with the observed higher strength of this alloy.
 | Fig. 3. Mechanical properties of pure Zr and Zr–2.5 X ( X = Nb, Sn) alloys at room temperature. *indicates p < 0.05 when comparing with pure Zr while # indicates p < 0.01 when comparing with pure Zr. |
With the addition of Nb and Sn into Zr, the increase in strength and hardness could be mainly attributed to the solid solution strengthening effect and second phase strengthening effect. The solid solution strengthening is caused by substitutional solute atoms in α-Zr lattice and the extent is strongly dependent on the difference between solute atom and parent atom. The solute atoms usually act as obstacles to the motion of dislocations and resistance to the propagation of dislocations [32]. By comparison, the atomic radius difference between Nb and Zr (8.1%) is greater than that between Sn and Zr (1.3%) [33]. So Nb should be more effective in strengthening Zr than Sn in a comparable amount. Besides, Zr–2.5Nb alloy is two-phase alloy and the contribution of β phase to the material strength could not be ignored. In most cases, β phase is recognized as being softer than α phase in Zr alloys. However, in the work reported by Cai et al. [29], the strength of β phase was found to be higher than that of α phase in a hot-rolled Zr–2.5Nb alloy, which was attributed to the significant solid solution strengthening triggered by the segregation of Nb in β phase, as well as its small grain size. In this study, whether the β phase is stronger or weaker than α phase, α/β boundaries act as a barrier for dislocations, so the alloy strength is increased.
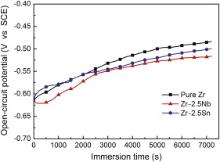
Open-circuit potential (OCP) is the potential of working electrode relative to reference electrode without any applied current, indicating the thermodynamic equilibrium at the interface of metal and solution. Fig. 4 shows the OCP variation of pure Zr and Zr–2.5 X ( X = Nb, Sn) alloys with immersion time in normal saline solution at 37 °C. Their average OCP values (after 2 h immersion) are listed in Table 2. As shown in Fig. 4, the OCPs change slowly towards noble potentials and reach relatively stable values for pure Zr and Zr–2.5 X ( X = Nb, Sn) alloys during 2 h exposure in normal saline solution. The continuous increase of OCP implies that the passive film spontaneously is formed on the metallic surface, which is resistant to metal dissolution. By comparing the OCP values in Table 2, after alloying with Nb and Sn, these alloys show slightly decreased OCPs compared to pure Zr, which suggests that these alloys show a higher corroding tendency compared to pure Zr.
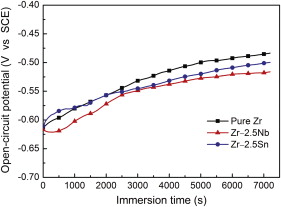 | Fig. 4. Open-circuit potential vs time curves of pure Zr and Zr–2.5 X ( X = Nb, Sn) alloys tested in normal saline solution. |
| Table 2. Corrosion parameters of pure Zr and Zr–2.5X alloys obtained from electrochemical measurements |
Potentiodynamic polarization curves of pure Zr and Zr–2.5 X ( X = Nb, Sn) alloys tested in normal saline are shown in Fig. 5. These studied materials show quite similar polarization characteristic of the formation and growth of a passive film on the surface, followed by the occurrence of transpassivation indicating the breakdown of passive film and rapid growth of pitting. The corrosion parameters, including corrosion current density (Icorr) and corrosion potential (Ecorr), are determined by the Tafel extrapolation method. Their average values are summarized in Table 2. Zr–2.5 X ( X = Nb, Sn) alloys exhibit lower corrosion current densities compared to pure Zr, which suggests that alloy addition of Nb or Sn improves the corrosion resistance of Zr. Moreover, corrosion current density of Zr–2.5Nb alloy is lower than that of Zr–2.5Sn alloy. As shown in Fig. 5, a passive region is observed on the anodic branch of polarization curve before transpassivation occurrence, indicating the thickening and growth of passive film (metal oxide). It is evident that current plateaus of Zr–2.5 X ( X = Nb, Sn) alloys are uniformly lower than that of pure Zr, which suggests that the alloying increases the passivity of Zr. At more positive potentials, the passive films break down and the current densities increase rapidly. The breakdown potentials (Etran) for pure Zr and Zr–2.5 X ( X = Nb, Sn) alloys are also listed in Table 2. By comparison, the breakdown potential of Zr–2.5Nb is higher than that of pure Zr, indicating an enhanced pitting resistance. However, Zr–2.5Sn shows decreased breakdown potential compared to pure Zr, suggesting a reduced pitting resistance.
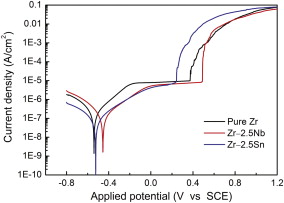 | Fig. 5. Potentiodynamic polarization curves of pure Zr and Zr–2.5 X ( X = Nb, Sn) alloys tested in normal saline solution. |
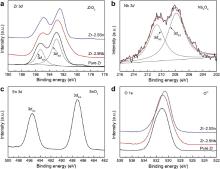
The XPS spectra from pure Zr and Zr–2.5 X ( X = Nb, Sn) alloys after polarization corrosion are displayed in Fig. 6. The Zr 3d spectra measured from pure Zr, Zr–2.5Nb alloy and Zr–2.5Sn alloy samples are found to consist of the 3d3/2 and 3d5/2 electrons peaks, which are assigned to Zr4+ oxide state [34] and [35]. For Zr–2.5Nb alloy, the Nb 3d spectrum exhibits a similar profile to the 3d3/2 and 3d5/2 electrons peaks, which corresponds to Nb5+ oxide state [35]. The Sn 3d spectrum for Zr–2.5Sn alloy is dominated by two main peaks at 495.5 and 487.1 eV, which is representative of Sn4+ oxide state [36]. The peaks at binding energy region of 530.5–531.0 eV in O 1s spectra are assigned to O2- oxide state [36]. Thus, the major components on the corroded surface of Zr–2.5Nb alloy are ZrO2 and Nb2O5. And the anodic oxide formed on Zr–2.5Sn alloy are ZrO2 and SnO2.
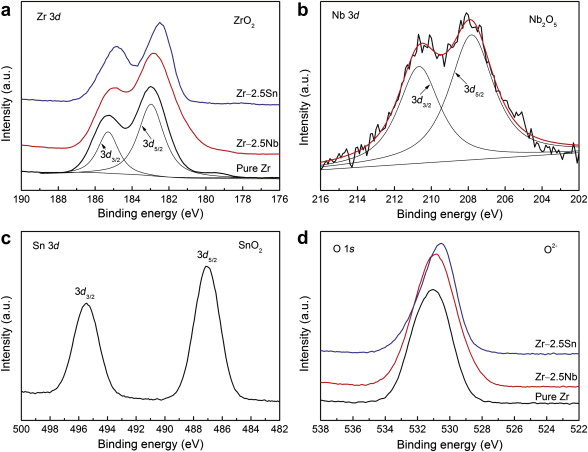 | Fig. 6. XPS spectra of: (a) Zr 3d for pure Zr and Zr–2.5 X ( X = Nb, Sn) alloys, (b) Nb 3d for Zr–2.5Nb alloy, (c) Sn 3d for Zr–2.5Sn alloy, (d) O 1s for pure Zr and Zr–2.5 X ( X = Nb, Sn) alloys after potentiodynamic polarization in normal saline solution. |
Zr metal displays an outstanding corrosion resistance arising from the spontaneous formation of passive film in air or aqueous solutions, which is also proved by this study. After alloying with Nb and Sn with the amount of 2.5 wt%, the corrosion resistance increases (the decreased Icorr), which could be attributed to the change in eventual composition or structure of passive film. Instead of pure ZrO2, the mixed oxides of ZrO2–Nb2O5 and ZrO2–SnO2 are formed on the surfaces of alloys. The embedded X-oxide ( X = Nb, Sn) appears to increase the resistance of the passive film, which is responsible for increased corrosion resistance of these alloys. However, the oxide film breaks down at a certain potential, and pure Zr and Zr–2.5 X ( X = Nb, Sn) alloys suffer pitting corrosion. The stability of anodic film is related not only to the electrochemical reaction with the aggressive ions, but also to mechanical stress or dielectric properties of the film [37]. The breakdown potential is sensitive to the conditions of film formation and impurities (or defects) [37]. Palit and Elayaperumal [38] suggested that the pitting resistance of Nb was higher than that of Zr in Cl– containing solution. This may account for improvement on pitting resistance for pure Zr with addition of Nb. However, the alloying addition of Sn lowers the pitting resistance of Zr, which is coincident with the conclusion of Knittel and his co-worker [39].
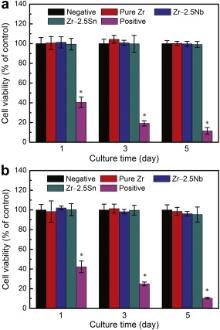
In order to examine substances released into the culture medium by tested material, the amount of metallic ions in extracts was measured by the ICP-AES. All the metal ions (Zr, Nb and Sn) are not detectable, namely under the minimal detection limit of the machine (1 ng/ml). Fig. 7(a) illustrates the relative viability of murine fibroblast cells (L-929) expressed as a percentage of the viability of cells grown in the negative control after culturing in pure Zr and Zr–2.5 X ( X = Nb, Sn) alloys extracts for 1, 3 and 5 days, respectively. It could be seen that the cell viability in extracts of pure Zr and Zr–2.5 X ( X = Nb, Sn) alloys is almost the same as that of negative control regardless of culture time. The statistic analysis indicates that there was no difference between the material group and the control group (p > 0.05). It is suggested that the extracts of pure Zr and Zr–2.5 X ( X = Nb, Sn) alloys samples basically show no toxicity to L-929 cells. Fig. 7(b) shows the relative viability of human osteosarcoma cells (MG 63). After 1 day and 3 days culture period, the cell viabilities of pure Zr and Zr–2.5 X ( X = Nb, Sn) alloys are almost the same as that of negative group. After a prolonged culturing period (5 days), MG 63 cell viabilities decrease in the following sequence: pure Zr > Zr–2.5Nb alloy > Zr–2.5Sn alloy. However, the lowest value of cell viability is still higher than 95% (of control), approximately equivalent to level of non-cytotoxicity. In conclusion, the indirect cytotoxicity test shows that the experimental Zr–2.5 X ( X = Nb, Sn) alloys do not release any toxic component which inhibits the growth and proliferation of fibroblast cells and osteoblast-like cells, indicating a good in vitro cytocompatibility.
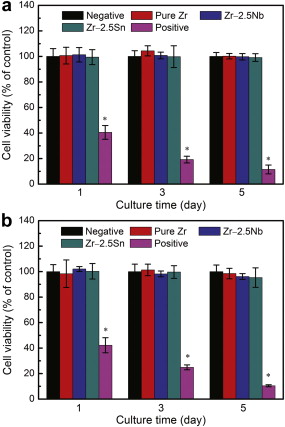 | Fig. 7. Cell viability expressed as a percentage of the viability of cells in negative control after culturing in extraction mediums of pure Zr and Zr–2.5 X ( X = Nb, Sn) alloys for 1, 3 and 5 days: (a) L-929 cell line, (b) MG 63 cell line. |
Zr is non-toxic and biocompatible as a stable oxide film formed on its surface, which can effectively inhibit the release of metal ions. Meanwhile, the oxide itself shows low solubility and bio-inertness [40] and [41]. In addition, Nb has excellent corrosion resistance and Nb5+ demonstrates low cytotoxicity in vitro [42]. Matsuno et al. [43] carried out the animal implantation test of Nb wire in rats and the result showed that Nb had good biocompatibility and osteoconductivity. In vitro cell test suggested that the cellular response of crystalline Nb, including the proliferation, mitochondrial activity, cell morphology and volume, was somewhat superior to those of Ti and 316 L stainless steel [40]. As a biocompatible element, Nb has been incorporated into Ti alloys for replacing Al or V. And in all cases it indicates that the short-term or long-term biocompatibility of the alloys is excellent [44], [45] and [46]. In this study, the amount of Zr and Nb ions released into the culture medium is less than 1 ng/ml, which is approximately equivalent to 1 × 10⁻⁵ mmol/l. Previous studies demonstrated that below 0.1 mmol/l, neither Zr nor Nb is toxic to osteoblasts and fibroblasts [47]. Besides, the toxicity and biocompatibility of Sn have been investigated in numerous literature. Some Sn is deposited in lung and bone [48]. It has been reported that metallic Sn and its inorganic compounds appear to be nearly harmless [48] and [49]. Moreover, as an alloying element for Ti, Sn has been recognized to be non-toxic and non-allergic [18]. Additionally, Sn oxide coating has been previously reported to show a good cytocompatibility [50]. In this study, the in vitro biocompatibility of Zr–2.5 X ( X = Nb, Sn) alloys is primarily evaluated in terms of fibroblast cell and osteoblast-like cell viability and the positive results are expectantly obtained.
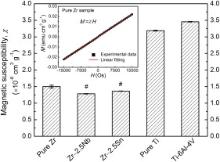
The magnetization ( M) variation of pure Zr vs the applied magnetic field ( H) at room temperature is shown in Fig. 8. Similar to pure Zr, Zr–2.5 X ( X = Nb, Sn) alloys, pure Ti and Ti–6Al–4V alloy show uniformly a linear variation between magnetization and applied magnetic field; therefore these curves are not given here. This fact indicates that the alloying with 2.5 wt% element addition does not change the paramagnetic nature of Zr metal. The magnetic susceptibilities of the studied materials, determined by the slope through linear fitting of the data, are also summarized in Fig. 8. It is evident that Zr–2.5 X ( X = Nb, Sn) alloys show decreased magnetic susceptibility compared to pure Zr. Moreover, the magnetic susceptibility of Zr–2.5Nb alloy is lower than that of Zr–2.5Sn alloy. By comparison, the magnetic susceptibilities of Zr–2.5 X ( X = Nb, Sn) alloys are nearly one-third of those of pure Ti and Ti alloy, indicating better MRI compatibility.
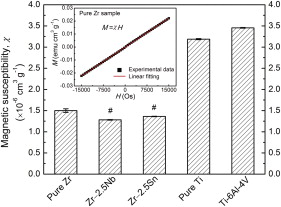 | Fig. 8. Magnetic susceptibilities of pure Zr and Zr–2.5 X ( X = Nb, Sn) alloys together with pure Ti and Ti–6Al–4V alloy. The detail view shows the magnetization of pure Zr as function of applied magnetic field and the corresponding linear fitting. #Indicates p < 0.01 when comparing with pure Zr. |
The paramagnetic property of Zr metal is caused by the presence of unpaired electrons in 4d sub-orbit and it has a positive magnetic susceptibility. The total magnetic susceptibility can be decomposed into contributions of Pauli susceptibility (spin) and orbital susceptibility [51]. The former is much affected by crystal structure while the latter is primarily dependent on the band structure (the width of d-band and the number of electrons). In this study, regardless of adding paramagnetic Nb [52] or diamagnetic Sn [52], Zr–2.5 X ( X = Nb, Sn) alloys show uniformly reduced magnetic susceptibilities compared to pure Zr. However, the total magnetic susceptibility of the alloy could not be simply determined by addition of magnetic susceptibility of Zr and its constituent metal. The results imply that electronic interactions are quite complex and in-depth band structure calculation and experiments are needed to clarify the influence of alloying on magnetic property of Zr. Besides, the imperfection of crystal structure (such as vacancies, dislocations and internal stresses caused by the defects) may have an influence on magnetic susceptibility of the alloys [53]. The major advantage of biomedical Zr alloy is their lower magnetic susceptibility in comparison with the traditional metallic biomaterials, such as stainless steel, Co–Cr alloys and Ti alloys. The lower magnetic susceptibility of metallic implants will result in less magnetic field disruption and therefore reduces the image artifacts. The magnetic susceptibility of Zr–2.5 X ( X = Nb, Sn) alloy is nearly one-seventh of that of Co–Cr alloy and one-third of that of Ti–6Al–4V alloy [17], which could be used for implant devices in MRI environment.
Binary Zr–2.5X alloys (X = Nb, Sn) were prepared and their microstructure, mechanical properties, corrosion behaviors, cytotoxicity and magnetic susceptibility are comparatively investigated. Zr–2.5Nb alloy has a duplex structure while Zr–2.5Sn alloy consists of single α phase. The strength and hardness of Zr–2.5X alloys are higher than those of pure Zr and the addition of Nb is more effective in strengthening Zr than that of Sn. The alloy addition of Nb and Sn increases the corrosion resistance of Zr represented by decreased corrosion current densities. The addition of Nb increases the pitting potential of Zr, whereas the addition of Sn lowers the pitting potential of Zr. In addition, Zr–2.5 X ( X = Nb, Sn) alloys do not present significant cytotoxic effect on fibroblast cells and osteoblast-like cells, showing good in vitro cytocompatibility. The magnetic susceptibility of Zr–2.5 X ( X = Nb, Sn) alloy is far lower than those of Co–Cr alloy and Ti–6Al–4V alloy, which means that these alloys could be used for implant devices in MRI environment. By comparing two kinds of individual alloying addition for Zr, Nb is a more attractive alloying element than Sn.
This work was supported by the National Basic Research Program of China (973 Program) (Grant Nos. 2012CB619102 and 2012CB619100), State Key Lab of Advanced Metals and Materials (Grant No. 2011-ZD01), National Science Fund for Distinguished Young Scholars (Grant No. 51225101), Natural Science Foundation of Heilongjiang Province, China (Grant No. ZD201012).
| 1. |
|
| 2. |
|
| 3. |
|
| 4. |
|
| 5. |
|
| 6. |
|
| 7. |
|
| 8. |
|
| 9. |
|
| 10. |
|
| 11. |
|
| 12. |
|
| 13. |
|
| 14. |
|
| 15. |
|
| 16. |
|
| 17. |
|
| 18. |
|
| 19. |
|
| 20. |
|
| 21. |
|
| 22. |
|
| 23. |
|
| 24. |
|
| 25. |
|
| 26. |
|
| 27. |
|
| 28. |
|
| 29. |
|
| 30. |
|
| 31. |
|
| 32. |
|
| 33. |
|
| 34. |
|
| 35. |
|
| 36. |
|
| 37. |
|
| 38. |
|
| 39. |
|
| 40. |
|
| 41. |
|
| 42. |
|
| 43. |
|
| 44. |
|
| 45. |
|
| 46. |
|
| 47. |
|
| 48. |
|
| 49. |
|
| 50. |
|
| 51. |
|
| 52. |
|
| 53. |
|