


A Modified Cellular Automaton Model for the Quantitative Prediction of Equiaxed and Columnar Dendritic Growth
[Rui Chen, Qingyan Xu , Baicheng Liu]
, Baicheng Liu]
|
|


Since the characteristic of dendrite is an important factor determining the performance of castings, a two-dimensional cellular automaton model with decentered square algorithm is developed for quantitatively predicting the dendritic growth during solidification process. The growth kinetics of solid/liquid interface are determined by the local equilibrium composition and local actual liquid composition, and the calculation of the solid fraction increment is based on these two compositions to avoid the solution of growth velocity. In order to validate the developed model, quantitative simulations of steady-state dendritic features over a range of undercooling was performed and the results exhibited good agreement with the predictions of LGK (Lipton-Glicksman-Kurz) model. Meanwhile, it is demonstrated that the proposed model can be applied to simulate multiple equiaxed dendritic growth, as well as columnar dendritic growth with or without equiaxed grain formation in directional solidification of Al-Cu alloys. It has been shown that the model is able to simulate the growth process of multi-dendrites with various preferential orientations and can reproduce a wide range of complex dendritic growth phenomena such as nucleation, coarsening of dendrite arms, side branching in dendritic morphologies, competitive growth as well as the interaction among surrounding dendrites.
Solidification of metals is a key process determining the final properties to a large extent[1], [2] and [3], and studying the formation mechanism of solidification microstructures and controlling them as designed, have been widely concerned[4]. Dendritic morphology is probably the most common microstructure observed during solidification process, which has a significant effect on the final properties. Due to the invisibility of the melt, it is difficult to real-timely observe the dendritic formation process. Although the synchrotron X-ray radiography technology developed in recent years makes direct observation be possible, the difficulty in preparing samples and the high requirements for equipments are also the challenges that the researchers need to face.
In recent decades, with the advancements of computer technology, numerical modeling and simulation have been widely used as a powerful tool to make a better understanding of dendritic evolution[5], [6] and [7]. At present, various kinds of deterministic and stochastic models have been developed to simulate the evolution of dendritic morphologies during solidification, among which, phase field (PF) and cellular automaton (CA) methods have been employed extensively. PF method, based on a set of thermodynamically-based partial differential equations, deals with the solid/liquid (S/L) interface by introducing a smooth transition variation of order parameter φ , thus avoiding the explicit tracking of S/L interface [8] and [9]. PF models have been successfully applied to simulate binary or ternary alloys in two or three dimensions and to investigate the growth kinetics and Gibbs energy [10], [11] and [12]. However, PF models require complex calculations and high computational resources, restricting the application of the models to small regions. CA method, as another computational approach, can reveal a wide range of micro-meso scale dendrite/grain evolution phenomena such as columnar-to-equiaxed transition (CET) [13] and deflection behavior of the dendritic growth in a flowing melt [14]. The simulated results of CA model are similar to those of PF method and it has a higher computational efficiency [15]. Therefore, CA method is rapidly emerging as a choice of simulating the dendritic formation in solidification process [15], [16], [17] and [18]. A two-dimensional CA model coupled with finite element (FE) to obtain the non-uniform temperature field, originally proposed by Gandin and Rappaz [19], was developed to simulate grain nucleation and growth during solidification. This model is capable of predicting the mesoscopic scale grain structure with a random orientation by adopting the decentered square growth algorithm, which was later successfully extended for simulations in three dimensions [20]. However, due to the fact that the model does not take the solute diffusion into account, it is unable to simulate the micro-scale dendritic features. Nastac [21] proposed a comprehensive stochastic CA model including time-dependent calculation of temperature field, solute redistribution both in solid and liquid, interface curvature as well as the growth of anisotropic parameters. This model is capable of explicitly tracking the S/L interface and simulating the evolution of dendritic crystals during solidification. Sanchez and Stefanescu [22] developed a CA model with the ability to simulate quantitatively most of the dendritic features observed experimentally. This model gave a detailed introduction of a new solution for the calculation of interface local curvature instead of using empirical formula [21], which reduced the artificial anisotropy caused by meshes to a certain extent. Sun et al. [23] developed a coupled CA model for the simulation of dendritic growth in the presence of forced and natural melt convection. The melt flow, solute transport and thermal transport were calculated by adopting a kinetic-based lattice Boltzmann method (LBM). Recently, with some certain assumptions, CA models have not been limited to only binary alloys, and many attempts have been made to extend CA models to predict the microstructure of multi-component systems [8] and [24].
Unfortunately, as a result of artificial anisotropy induced by the CA mesh and the corresponding neighborhood configuration and capture rules, most of the CA models are mesh dependent and can only simulate the dendrites growing aligned with the grid or in 45° orientation. To deal with the problem, the decentered square/octahedron algorithm originally proposed by Rappaz et al., was later modified by Wang et al.[7], through coupling the finite difference model to solve the solute diffusion equations. The algorithm eliminated the effect of grid anisotropy and was adopted by many workers to describe the dendritic growth with arbitrary preferential orientation[3], [8], [25] and [26]. On the basis of this technique, the solutal interaction within an advancing columnar dendritic network and columnar-to-equiaxed transition of Al-Cu alloys were investigated by Dong and Lee[13], and the stray grain formation mechanism in the platform region of turbine blades was revealed by Yang et al.[27]. Sanchez and Stefanscu[5] improved their previously developed CA model[22] by using virtual front tracking (VFT) of the shape S/L interface and made the model valid for simulating dendrites growing at an arbitrary crystallographic orientation. Later, Zhu and Stefanescu[6] adopted the virtual front tracking method and calculated the solid fraction increment through the difference between the local equilibrium composition and the local actual liquid composition, rather than by solving the solute conservation equation at the S/L interface to obtain the growth velocity. Wei et al.[17] and [28] developed a model to reduce the mesh-induced anisotropy by adopting new random zigzag capture rules for interface cells and presented a modified interface curvature calculation method simultaneously. John et al.[29] also investigated the influence of the presence of artificial anisotropy on growth kinetics induced by CA mesh and developed a modified cellular automaton-finite volume model, in which the grid dependent anisotropy was reduced by adjusting the addition of solid fraction and the redistribution of the solute rejected.
Although a lot of efforts has been made to develop CA models for dendrite simulation, the work on this aspect is still far from satisfaction and further efforts are needed. In the current paper, a two-dimensional cellular automaton model is presented to simulate the dendritic growth with different preferential orientations during the solidification process, by adopting the decentered square algorithm to eliminate the mesh-induced anisotropy. The model is compared with the well-established Lipton-Glicksman-Kurz (LGK) analytical model for dendritic tip features of Al-Cu alloys. In particular, a series of simulations including multi-equiaxed dendrites in undercooled melt and columnar dendrites in directional solidification, are conducted to examine the characteristics and capabilities of the model, and the simulated results are compared with the experimental observations published in other papers by in situ and real-time synchrotron X-ray radiography technique.
CA model for simulating dendrites is a set of algorithms used to describe the evolution of discrete time and space. In the present model, a two-dimensional rectangular calculation domain is uniformly divided into an orthogonal arrangement of square cells with the size of Δ x in Cartesian coordinate, and each cell is assigned a pair of integer number (i, j). Each of the spatial cells possess several variables, such as temperature (T), solute content (CL and CS), solid fraction (fS), and crystallographic orientation (θ ). According to the solid fraction, the state of the cells can be identified as solid (fS = 1), liquid (fS = 0) and interface (0 < fS < 1). The calculation starts with all the cells in the liquid state. The state transformation from liquid to interface can be achieved through the following ways: stochastic nucleation event, artificially setting certain cell's state as interface or captured by its neighboring solid cells. For partition coefficient k0 < 1 alloys, due to the fact that the local interface equilibrium composition ( 
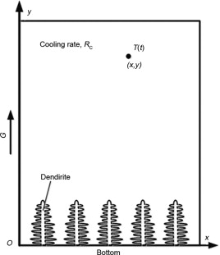
Since the heat diffusivity is several orders of magnitude larger than solute diffusivity, it is reasonable to assume that the heat diffusion has reached an equilibrium state at the scale of dendrite. Therefore, simple and well-defined thermal conditions are applied in the calculation domain. For directional solidification conditions, a schematic illustration is shown in Fig. 1. For an adiabatic boundary condition on both sides, the whole simulation domain cools at a cooling rate RC with a fixed temperature gradient G. At solidification time t, the temperature T(t) at the point (x, y) can be simply expressed as
equation(1)
T(t)=Tliq(C0)+G· y-RC· tT(t)=Tliq(C0)+G· y-RC· t 
where Tliq(C0) is the liquidus temperature at initial composition C0. If the value of G equals zero, the temperature in the domain is uniform.
 | Fig. 1 Schematic illustration of the thermal field calculation. |
The growth process is mainly controlled by solute redistribution during solidification. Initially, the computational domain begins at a uniform composition, and as the solidification proceeds, the growing cells reject excess solute to its neighboring liquid cells. Solute diffusion within the entire domain is then calculated based on the following equation without considering nature and forced convection influence:
equation(2)

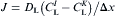
where C is the composition with its subscript i denoting solid or liquid, D is the solute diffusion coefficient and k0 is the equilibrium partition coefficient. The last terms on the right hand denotes the amounts of solute rejected due to the increment of solid fraction at the S/L interface. In order to overcome the problem of composition discontinuity at the S/L interface when dealing with the solute diffusion Eq. (2), the diffusion coefficients vary with the status of neighboring cells [6], and the flux of solute J is calculated differently according to the state of the two cells [30]. Taking cell I and K for example, the solute flux is:
both I and K are liquid:
equation(3)

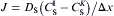
I or K is interface and the other one is liquid:
equation(4)


both I and K are interface:
equation(5)


For one of the cells is solid:
equation(6)

where superscript ν denotes cell I or cell K, σ IK is a function of the solid fraction of cell I and K, and the value is obtained by σ IK = 0.5( 

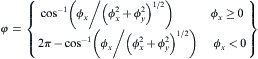
During solidification process, the solute diffusion plays an important role in determining the dendritic growth and microstructural characteristics. Note that the local interface equilibrium composition 

equation(7)
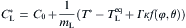

where mL is the liquidus slope, T * is the actual interface equilibrium temperature calculated by Eq. (1), 
Since the average counting method[21] for curvature calculation suffers from significant mesh dependent, resulting in the deviation of the curvature evaluation, the work uses the following equation to calculate the local interface curvature κ of a cell with solid fraction fS (0 < fS < 1) [22]:
equation(8)
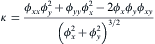

where ϕ x, ϕ y represent the first order partial derivative of solid fraction fS to x and y, respectively, and ϕ xx, ϕ yy, ϕ xy are the second order partial derivatives. This equation is capable of reproducing the physically realistic growth kinetics of dendrites.
The anisotropy function f(φ , θ ) is calculated as follows
equation(9)


where ε denotes the anisotropy coefficient, and for cubic crystals, δ is taken as 4. The normal growth angle can be calculated from the gradient of the solid fraction at the S/L interface cells by the following equations [31]
equation(10)

The evolution of local equilibrium composition 
equation(11)


where CL is calculated from Eq. (2) and 
Nucleation process is described by a continuous Gaussian nucleation distribution model. In this model, the nucleation density is related to the updated undercooling, and the nucleation distribution dn/d(Δ T) is used to express the relationship between grain density increment dn and increase in the undercooling d(Δ T), and the total density of nuclei n(Δ T) at a given undercooling Δ T can be expressed as follows [13] and [32]
equation(12)
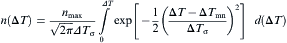

where nmax is the maximum grain density, Δ Tσ is standard deviation of undercooling, Δ Tmn is the mean nucleation undercooling. According to Eq. (12), the total grain density can be obtained at any undercooling Δ T. Accordingly, the density of new nuclei with the volume of the melt δ n=n(Δ T+δ (Δ T))-n(Δ T)δ n=n(Δ T+δ (Δ T))-n(Δ T) during one time step is known. The newly formed nuclei are randomly distributed in the domain and once the cell is nucleated, the index of the cell is changed to “ growing” associated with a random preferential growth direction θ .
The governing Eq. (2) used for calculating solute diffusion is solved with the explicit finite difference (FD) scheme. Thus the time step δ t, is determined by the solute diffusion coefficient and the mesh size, which can be expressed as
equation(13)


where Δ x is the cell size. Evidently, δ t chosen according to Eq. (13) is sufficiently small to ensure the stability for solute field calculation.
2.5. Description of decentered square algorithm
In CA models, the nearest four cells orthogonally (Von Neumann neighborhood) and the next nearest four cells diagonally (Moore neighborhood) are generally regarded as the neighboring cells, whose states will be changed with the parent cell in the center. Traditionally, the capture process for a cell begins only when the cell is totally solidified, that is to say only when the cell's state is solid, it will alter its surrounding liquid neighbors into interface state. Once a cell is captured, it will begin to grow by changing its solid fraction. However, this kind of CA growth and capture rules will make the dendrite tend to grow along the axis (the nearest four cells are neighborhood) or grow in the diagonal direction (the around eight cells are regarded as neighborhood) independent of the original crystallographic orientation. Two reasons may account for this situation. One is the inherent configuration of the orthogonal CA mesh and the other one is the growth and capture rules. In order to eliminate the influence of grid anisotropy on CA models, decentered square growth algorithm was first developed by Gandin and Rappaz[19] and [20], and modified by Wang et al.[7] later through coupling the finite difference model to explicitly solve the solute diffusion equation and to make the solid fraction of interface cell continuously and smoothly change from 0 to 1.
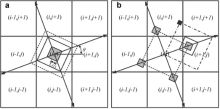
Fig. 2 shows the two-dimensional sketch of the decentered square growth algorithm adopted in the present model, and illustrates for the case of cubic crystal alloys, which have four preferential growth directions and four-fold symmetry. A grain in the cell (i, j) with the preferential angle θ nucleates at the center and the cell turns into interface and begins to grow diagonally into a square shape, which is indicated by the gray square in Fig. 2(a). The diagonal of the square corresponds to the preferential growth direction. At each time step, the evolution of the half width of the square L(t) is related to the increment of solid fraction Δ fS and can be calculated based on the following equation:
equation(14)
L(t+Δ t)=L(t)+Δ x· Δ fSL(t+Δ t)=L(t)+Δ x· Δ fS 
 | Fig. 2 Illustration of the modified cell capture and growth algorithm for cubic crystal alloys used in the model: (a) shows the growth process and capturing rules of cell (i, j) within a decentered square, (b) shows the growth and capturing process of cell (i+1, j) |
Once the square grows large enough and the corners of the square touch any of the neighboring liquid cells (indicated by solid line square in Fig. 2(a)), the touched cell will be changed to interface cell and a new square is created with the same preferential orientation as the original one. The nuclei of the captured cells ((i-1, j), (i+1, j), (i, j-1), (i, j+1)) respectively located at the corners of the dotted line square ( Fig. 2(b)), which will start to grow in accordance with the change of the solid fraction in their own cells (the gray squares in Fig. 2(b)). Take cell (i+1, j) for example to illustrate its growth process. With the increase of the solid fraction, the square will touch the cell (i+1, j+1) (indicated by the solid line square in Fig. 2(b)) and turn the state of cell (i+1, j+1) into interface. The nucleus position of cell (i+1, j+1) is located in cell (i, j+1) (black square in Fig. 2(b)), while it is not in its own cell. If a cell is completely solidified (fS = 1), any of its surrounding liquid cells are captured into interface cells.
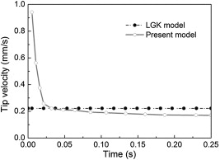
Model validation was carried out in this section by comparing the simulated results with the classic LGK analytical model, which is used to describe the growth behavior of freely growing dendrite at a given melt undercooling. The thermophysical parameters of Al-Cu alloys used in the following simulations are presented in Table 1. The computational domain (0.6 mm × 0.6 mm) used was large enough to eliminate the effects of domain boundary on the concentration field and to ensure the concentration of the melt far away from the dendritic tip remaining constant. A single solid seed with initial composition k0C0 and a crystallographic orientation of 0° with respect to the x-axis was set at the center of the domain. Fig. 3 shows the evolution of dendritic tip velocity over the solidification time at a constant melt undercooling Δ T = 6 K for Al-10 wt% Cu alloy. It can be seen that at the early stage of solidification, the dendrite grows at a high velocity, and then the tip velocity declines rapidly. This mainly results from the solute accumulation at the interface. After an initial transient period, the solute concentration at the interface tends to a stable value and the solidifying dendrite tends to grow under a steady-state and the tip velocity stabilizes around 0.17 mm/s after approximately 0.15 s, which lies below the value of 0.22 mm/s predicted by LGK model (solid dot line). This phenomenon is consistent with the observations in other literature [6], [9] and [17].
| Table 1 Thermophysical properties of Al-Cu alloys used in the paper |
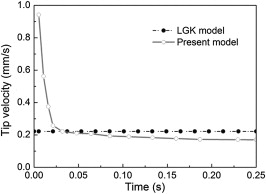 | Fig. 3 Calculated tip velocity of freely growing dendrite as a function of solidification time of Al-10 wt% Cu alloy at a constant undercooling Δ T = 6 K. |
Fig. 4 illustrates the simulated dendritic tip velocity and tip radius at steady-state alongside with the values calculated by LGK model with the stability parameter σ * ≈ 0.025 for different level of undercooling. Both of the model predictions follow the same trend and these values appeared to be a reasonable agreement. As expected, the tip velocity increases, while the tip radius decreases with increasing the undercooling. Note that the simulated tip velocity shows a considerable deviation at high undercooling, which may result from the latent heat release under higher tip velocity. The relatively higher difference at low undercooling for tip radius mainly comes from the discretization of dendritic tip, which produces an inaccurate representation of the tip radius and deviates from the parabolic shape, thus resulting in a larger measuring error[15] and [33].
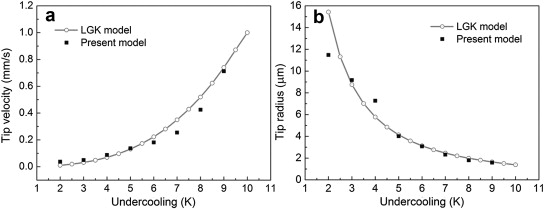 | Fig. 4 Comparison of the steady-state dendritic tip velocity (a), tip radius (b) simulated by present model with the theoretical LGK predictions as a function of undercooling for Al-10 wt% Cu alloy. |
To illustrate the abilities of the proposed CA model, the model was tested with multi-equiaxed dendritic growth in undercooled melt with a constant cooling rate and columnar dendritic growth in directional solidification with continuously varying cooling rates with or without equiaxed dendritic formation of Al-Cu binary alloys.
Multi-equiaxed dendrite simulation was carried out for Al-10 wt% Cu alloy by the model in a domain consisting of 1000 × 2700 cells with the cell size of 5 μ m. Prior to simulation, the nucleation parameters in Eq. (12) were initialized. Mean nucleation undercooling (Δ Tmn) was approximately set to be 5 K with a standard deviation (Δ Tσ ) of 0.5 K. The maximum grain density (nmax) was set to be 1.0 × 10¹² m-3 [13]. Initially, the temperature of the calculation domain was kept at the liquidus temperature with a homogeneous composition C0. Solidification simulation was triggered by applying a constant cooling rate of 0.5 K/min, which was the same as experimental conditions [34]. Fig. 5 shows the comparison between the simulated results of multi-equiaxed dendritic growth sequences and the experimental results from literature [34]. Firstly, with the lowering of temperature T(t) from liquidus temperature, it leads to an increase in the undercooling Δ T and nucleation occurs when the undercooling Δ T reaches a certain value ( Fig. 5(a1) and (b1)). The nucleated grains are randomly distributed in the domain and the preferential growth orientations are randomly given ranging from 0° to 90° . After nucleation, the dendrite arms develop along their crystallographic orientations; in the meantime, grains keep nucleating from the undercooled melt during the early stages of solidification ( Fig. 5(a2), (a3), (b2) and (b3)). Considering that the undercooling, which is the driving force of grain growth, is defined as the difference between the equilibrium liquidus temperature TL(t) at the composition CL(t) and the actual temperature of the melt T(t), the undercooling can be expressed as Δ T=TL(t)-T(t)=TM+mLCL(t)-T(t)Δ T=TL(t)-T(t)=TM+mLCL(t)-T(t), where TM is the melting point of pure aluminum. As can be seen in the early stage of solidification, the number and the size of the dendrites are relatively small, and it can be deduced that the solute composition ahead of the dendritic tips is not high relatively, and thus the driving force is mainly coming from the thermal undercooling. At the same time, the dendrites are far from each other with less interaction limitation. For these reasons, the dendrites can freely grow into four-fold symmetry morphologies along their preferential growth directions ( Fig. 5(b1)-(b3)). As solidification proceeds, the solute rejected into the melt increases, and the interaction effects of the solute field between the adjacent dendrites are intensified, so the tip growth of dendrites sufficiently slows down, leading to the coarsening of the dendrite arms and forming of secondary dendrite arms. Meanwhile, mechanical impingement of dendritic tips also progressively hinders the growth of dendrite arms ( Fig. 5(b4) and (b5)). Although the further dendritic growth process is not presented here, it should be noticed that further solidification will occur within the existing equiaxed dendrites, especially coarsening the secondary dendrite arms, and causing an increase of solid fraction until it is completely solidified. For the experimental results, it must be noted that the dendritic morphologies observed in Fig. 5(a1)-(a5) is asymmetric and the difference between simulation and experiment results is attributed to the non-uniform solute distribution in growing tips. In the experiment, under the influence of gravity, the solute rejected is sinking as copper is heavier than aluminum, hindering the downstream dendritic tips growing. In the subsequent investigation, gravity factor will be taken into account in the dendritic growth model.
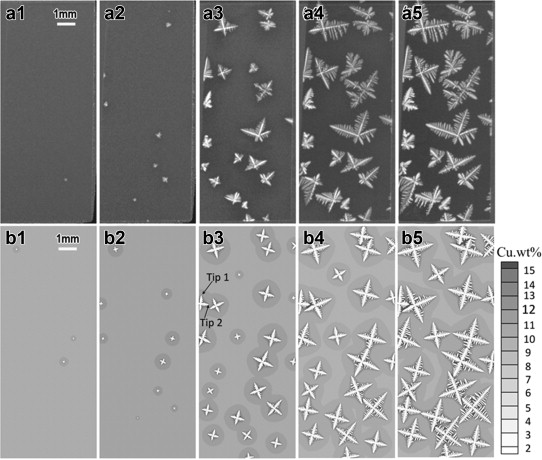 | Fig. 5 Simulated growth process of multi-equiaxed dendrites of Al-10 wt% Cu alloy under a cooling rate of 0.5 K/min. The first row (a1-a5) is the experimental results obtained by in situ and real-time synchrotron X-ray radiography technique[34]. Second raw (b1-b5) shows the simulated results with different solid fraction 0.06%, 0.5%, 6.2%, 12.4%, 24.5%, respectively. |
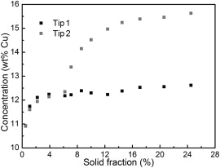
In order to investigate the influence of solute enrichment on dendritic growth, Fig. 6 displays the evolution of average solute contents ahead of tip 1 and tip 2 for the dendrite as shown in Fig. 5(b3). As can be seen in Fig. 6, during the early stage of solidification, the solute contents both for tip 1 and tip 2 are not very high and the difference is negligible. Therefore, the dendrite can freely grow in all of the preferential growth directions in addition to the side contacting the mold. When the dendrite on the right grows to a certain size, the solute rejected by tip 2 cannot be diffused out smoothly and accumulated in the liquid ahead of the dendritic tip 2. This is indicated by Fig. 6 that when the solid fraction reaches approximately 7%, the solute content ahead of tip 2 increases dramatically while it remains constant ahead of tip 1. The enriched solute hinders the growth of tip 2, resulting in the shorter dendrite arm compared with the freely growing dendrite arm.
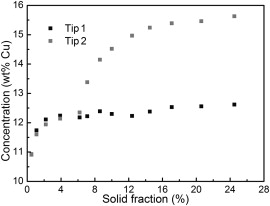 | Fig. 6 Average concentration evolution ahead of dendritic tip 1 and tip 2 with the increased solid fraction |
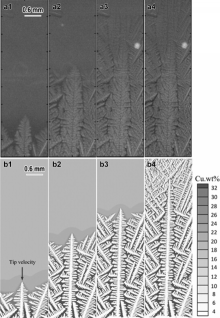
The proposed model was applied to simulate the growth of the columnar dendrites of Al-20 wt% Cu alloy under directional solidification with a constant thermal gradient of 15 K/mm. The sample was solidified at three stages with different cooling rates, sequentially applied by 0.15 K/s, 0.7 K/s, and 3 K/s. The calculation domain contained 320 × 1100 cells and the cell size was set as 5 μ m. At the beginning of simulation, four nuclei were uniformly set at the bottom of the calculation domain with the crystallographic orientation of 30° , 88° , 15° , 70° , respectively. Fig. 7 shows the comparison between our simulated results and the experimental results obtained by Murphy et al.[35] using in situ X-ray radiography technique. As shown in Fig. 7, the present model can reproduce dendritic features during directional solidification and very good agreement can be observed between them. As can be seen in Fig. 7(b1)-(b3), the dendrites maintain their growth along their preferential growth directions, and after initial competition, three dendrites survive. In this simulation, the dendrite with a growth orientation 15° (the third one from left) is blocked by its left neighbor, whose orientation is closer to the heat flux direction/vertical temperature gradient. The growth of the dendrites with orientation of 30° , 70° on both sides are also shut off due to their collisions with mold or with the second dendrite. However, both of the dendrites continue to grow along their orientations through branching secondary, ternary and even higher order dendrite arms, which mainly be attributed to the sufficient spacing ahead of the dendrites. It can be noted that the dendritic morphologies at the cooling rate of 0.15 K/s ( Fig. 7(b1) and (b2)) are similar to that of 0.7 K/s ( Fig. 7(b3)). This is because the rejected solute in front of dendrites has enough time to diffuse for both of the cooling rates. When the cooling rate is increased to 3 K/s, the solute get accumulated in front of S/L interface, which causes the interface become unstable, and the dendrite grows with more complicated side branching ( Fig. 7(b4)). Because of the chosen alloy Al-20 wt% Cu with a high amount of composition, as the solidification proceeds, the growing dendrites reject excess solute element out, which gets enriched in the interdendritic region, increasing the concentration of the residual melt to the eutectic composition immediately (dark gray region in Fig. 7(b1)-(b4)). Therefore, the dendrite arms have no enough time to coarsen and present fine.
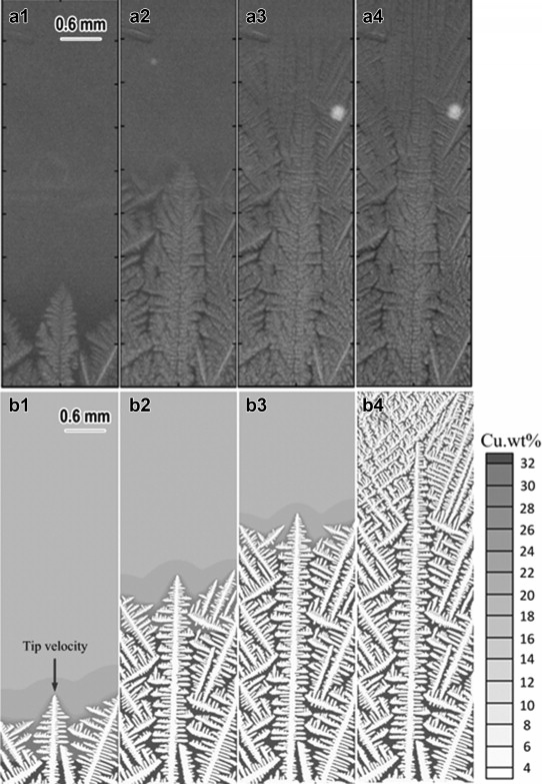 | Fig. 7 (a1-a4) the evolution of dendritic morphologies at different solidification stage with different cooling rate (0.15 K/s, 0.7 K/s, 3 K/s) of Ale20 wt% Cu alloy, with a temperature gradient of 15 K/mm[35]; (b1eb4) show the respective growth process by simulation with the same cooling rates as experimental. |
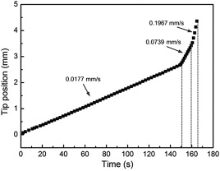
In front of the dendrite tips, the solute concentration is not very high (light gray color) due to the sufficient diffusion, and thus the dendrite tips can grow along the vertical direction with less limitation. In order to measure the growth velocity of the dendrite tip indicated in Fig. 7(b1), based on the simulated images, the accurate position of the dendrite tip as a function of solidification time was measured and then the data was fitted into a linear curve as shown in Fig. 8. It can be clearly seen that the fitted continuous curve has three sections with different slopes and each of the section is corresponding to the different solidification stage with different cooling rates. The average growth rates (curve slope) are 0.0177 mm/s, 0.0739 mm/s, 0.1967 mm/s, respectively. The values are in agreement with the experimental results (0.0161 mm/s, 0.0631 mm/s) in low cooling rates (0.15 K/s, 0.7 K/s) while a relatively large deviation appears for high cooling rate 3 K/s (0.2829 mm/s)[35].
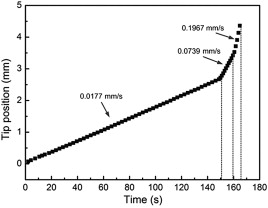 | Fig. 8 Evolution of the dendrite tip position as a function of solidification time simulated by the present model and the deduced tip velocities for the three successive cooling rates. |
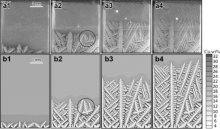
As it is known, the columnar dendritic growth is mainly controlled by temperature gradient ahead of growth front and solidification velocities. If the controlled parameters are improper, new dendrite is likely to nucleate ahead of columnar front. In this section, the columnar growth combined with equiaxed grain nucleated halfway was simulated and the simulated results were compared with the experimental observations by Nguyen-Thi et al.[36] (Fig. 9(a1)-(a4)). Simulation was performed on the calculation domain of 4.5 mm × 7.5 mm with a mesh size of 5 μ m. The cooling rates continuously applied at different solidification stages were 0.15 K/s and 0.7 K/s, and the constant temperature gradient was 15 K/mm. To illustrate how the microstructure evolves, the typical growth images obtained by simulation are shown in Fig. 9(b1)-(b4). At the beginning of solidification, several nuclei with different orientations appear, and their tips begin to grow along the opposite to heat flow direction. After a while, the dendrites with disordered pattern appear at the bottom of the field of view (Fig. 9(a1) and (b1)). As shown by the circle in Fig. 9(a2) and (b2), an equiaxed grain nucleates at the groove region in front of growing dendrites. As we know, the nucleation process is determined by the local undercooling if the heterogeneous nucleation is ignored, and the undercooling distribution can be seen in Fig. 10 (i.e., the undercooling of dendrite and interdendritic region was set below to 2 K). The dendrite groove region shows a greater undercooling than the columnar dendritic tips. The greater undercooling at the groove region makes it a favored location for the nucleation of equiaxed grains. This simulated result is consistent with the investigation of Dong and Lee[13]. The tip growth of the equiaxed dendrite is stuck on the ambient columnar dendrite arms (Fig. 9(a2) and (b2)) and the following growth continues through branching (Fig. 9(a3) and (b3)), and then finally merges into the columnar microstructure (Fig. 9(a4) and (b4)). As the cooling rate increased to 0.7 K/s (Fig. 9(a3) and (b3)), a much finer microstructure was obtained with more side branching (Fig. 9(a4) and (b4)).
 | Fig. 9 .olumnar dendritic growth along with equiaxed dendrite formation of Ale20 wt% Cu alloy at a constant temperature gradient of 15 K/mm and two different cooling rates. (a1-a4) is the experimental results[36] and (b1eb4) is the simulated. (a1) and (a2), (b1) and (b2) solidified at a cooling rate of 0.15 K/s, and in (a3) and (a4), (b3) and (b4), the cooling rate was increased to 0.7 K/s. |
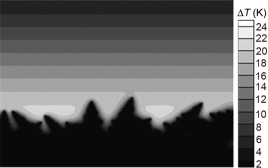 | Fig. 10 Predicted local undercooling distribution ahead of dendritic front corresponding to the moment prior to the formation of the equiaxed grain. |
In this work, a two-dimensional CA model for quantitatively predicting the dendritic growth during solidification processes is developed. The growth kinetics of S/L interface cells are determined from the difference between the local interface equilibrium composition 
The abilities of the model have been illustrated by simulating multi-equiaxed dendritic growth with a constant cooling rate, as well as columnar dendritic growth with or without equiaxed dendrite formation in directional solidification with varying cooling rates of Al-Cu alloys. The concentration evolution ahead of different dendritic tips is underlined to explain the asymmetric growth. The predicted tip velocities reveal the accuracy of the model in the range of low cooling rates. The nucleation of the equiaxed dendrite is interpreted by the local undercooling distribution. The simulated results indicate that the model is able to simulate multi-dendritic with various orientations and can reproduce a wide range of complex dendritic growth phenomena such as nucleation, coarsening of dendrite arms, side branching in dendritic morphologies, competitive growth as well as the interaction among neighboring dendrites.
The authors have declared that no competing interests exist.
| [1] |
|
| [2] |
|
| [3] |
|
| [4] |
|
| [5] |
|
| [6] |
|
| [7] |
|
| [8] |
|
| [9] |
|
| [10] |
|
| [11] |
|
| [12] |
|
| [13] |
|
| [14] |
|
| [15] |
|
| [16] |
|
| [17] |
|
| [18] |
|
| [19] |
|
| [20] |
|
| [21] |
|
| [22] |
|
| [23] |
|
| [24] |
|
| [25] |
|
| [26] |
|
| [27] |
|
| [28] |
|
| [29] |
|
| [30] |
|
| [31] |
|
| [32] |
|
| [33] |
|
| [34] |
|
| [35] |
|
| [36] |
|