


Geometrical Scale-Sensitive Fatigue Properties of Ti-6.5Al-3.5Mo-1.5Zr-0.3Si Alloys With α/β Lamellar Microstructures
[B. Zhang1 , Z.M. Song2 , L.M. Lei3 , L. Kang1, 2 , G.P. Zhang2  ]
]
]
|
|


Fatigue properties of the Ti-6.5Al-3.5Mo-1.5Zr-0.3Si alloy sheets containing different numbers of α/β Widmanstätten colonies in the thickness direction of the sheets were investigated by tension-tension fatigue testing. It is found that fatigue properties of the Ti alloy either in low- or high-stress amplitude regimes become more sensitive to the sheet thickness of the Ti alloy as the sheet thickness is comparable to the length scale of the Widmanstätten colonies. The basic mechanism of such length scale-sensitive fatigue properties in the Ti alloy was elucidated.
α /β Ti alloys with Widmannstä tten colonies consisting of α /β lamellas have the good fracture toughness and large resistance to fatigue crack propagation[1], [2], [3], [4] and [5]. These titanium alloys not only have been widely applied to aerospace and automobile industries due to their low density, high specific strength and good corrosion resistance, etc.[1] and [6], but also have recently been used as micro-components in micro-electromechanical systems (MEMS) devices[7]. Since the geometrical dimensions of the Ti alloy micro-components are usually in a range from micrometers to sub-micrometers, even nanometers, being comparable to the microstructural scales, such as grain size or colony size, the design of mechanical reliability of such small-scale Ti alloy components may not be evaluated directly from the data of their bulk counterparts[8]. Although a number of investigations on fatigue behaviors of bulk Ti alloys with different microstructures have been carried out considering some external factors[3], [9], [10], [11] and [12], few studies are conducted to examine effects of geometrical scale on fatigue properties of α /β Ti alloys as the dimensions of the alloys approach the scale of several colonies[13], [14] and [15].
For pure metals, size effects on fatigue properties of polycrystalline metal foils/wires[16], [17], [18], [19], [20], [21], [22], [23], [24], [25], [26], [27] and [28] were paid more attention in recent decades. Fatigue resistances of the micrometer-thick metal foils/wires are found to be dependent on both scales of materials (geometrical and microstructural scales) and loading modes (stress and strain control mode). Especially, when the foil thickness of the pure metals is comparable to the grain size, the effects of the geometrical scale on fatigue properties become unignorable[26], [27], [29] and [30].
Under stress control, Hofbeck et al.[16] investigated for the first time the fatigue strength of the Cu and Au wires with bamboo-type-structures (the wire diameter being smaller than the grain size) and found that the fatigue strength increased with decreasing wire diameter, an evident diameter-dependent size effect. This size effect is mainly associated with the large yield stress of the thinner wires, and physically is attributed to the short slip distance available in thin wires and the absence of PSBs caused by the image force in the thin (but not in thick) wires. This behavior named as “ the smaller, the stronger” was subsequently confirmed in the Cu foils[18] and wires[28]. Judelewicz et al.[18] reported that the thinner foils were almost free of extrusions and contained only occasionally a few grains with a low density of faint slip bands, indicating that the microstructure development toward failure is somehow delayed for the thinner samples. However, Hong and Weil[31] found that there was no appreciable difference in fatigue properties between the 33 μ m-thick foil with about two grains in the thickness direction (TD) and the bulk wrought Cu, while the fatigue resistances of the electroplated 25 μ m-thick Cu foils containing about 25 grains in the TD were evidently higher than that of the bulk wrought Cu due to the small grain size and the high densities of twins and dislocations in the foils. This result indicates that the grain size rather than the foil thickness dominates fatigue strength.
Although there are a few investigations on size effects on fatigue in pure metals, less work is conducted on fatigue of engineering alloys with micron-scale microstructures. In this paper, we present an experimental investigation on fatigue properties of α /β lamellar-structured Ti alloy sheets with different thicknesses ranging from 2 mm to 0.1 mm, which is corresponding to having about twelve colonies to one colony or less in the TD of the specimens. Evident size effects on fatigue strength are found, and the corresponding mechanism is examined.
In this study, as-received Ti-6.5Al-3.5Mo-1.5Zr-0.3Si alloy, namely TC11, was firstly subjected to the heat treatment at 1040 ° C for 30 min in vacuum and then cooled in the furnace. The previous characterization of the microstructure in the alloy by scanning electron microscopy (SEM) and transmission electron microscopy (TEM)[5] has shown that the alloy had a typical α /β lamellar structure (Widmannstä tten structure) and the average size of prior β grains is 715 μ m. Within such a large prior β grain, there are at least three or more α /β colonies with different lamellar orientations. The colony with an average size of 171.06 μ m consists of α and β laths with average width of 1.71 μ m and 0.22 μ m, respectively.
Tensile and fatigue specimens with different thickness ranging from 0.1 mm to 2 mm were machined from the bulk alloy by an electrical discharging machine, as shown schematically in Fig. 1(a). Since the average size of the colony is about 171 μ m, the specimens may contain different number of colonies in the TD. For example, the 0.1 mm-thick specimen may have only one colony (Fig. 1(b)), while the 0.6 mm-thick one contains 3-4 colonies in the TD (Fig. 1(c)). Before testing, all the specimens were first mechanically ground and then electropolished to have smooth surfaces.
 | Fig. 1 (a) Schematic illustration of geometrical scales of Ti alloy specimen for tensile and fatigue tests, (b) and (c) electron backscattering images of the 0.1 and 0.6 mm-thick specimens, respectively |
Tensile tests of the specimens containing different numbers of α /β colonies were performed in an Instron® 8871 testing machine at a strain rate of 1 × 10⁻³ s-1. Tensile engineering stress-strain curves were obtained through the tensile tests by using at least two samples for each thickness alloy. Stress-controlled fatigue tests were conducted with the same machine as tensile testing. The stress ratio is 0.1 and load frequency is 25 Hz. Fracture morphology was examined by scanning electron microscopy (SEM, LEO Super 35).
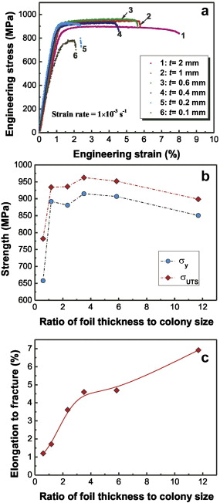
Fig. 2(a) presents engineering stress-strain curves of the specimens with different thickness, revealing different tensile properties of the specimens. Fig. 2(b) shows that both of the yield (σ y) and the ultimate tensile strengths (σ UTS) do not change more until the ratio of the specimen thickness (t) to the colony size (dc) is smaller than one, while elongation to fracture decreases with decreasing t/dc shown in Fig. 2(c).
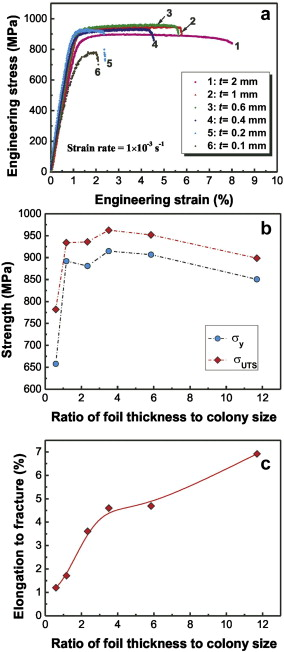 | Fig. 2 (a) Tensile engineering stress-strain curves of the Ti alloy specimens with different thicknesses, (b) variation of tensile yield strength (σ y) and ultimate tensile strength (σ UTS) with specimen thickness, and (c) relationship between elongation to fracture and the specimen thickness |
A relation between the applied stress amplitude (σ a) and the number of cycles to failure (Nf) of the specimens is presented in Fig. 3(a), from which several interesting results can be obtained.
(1)Fatigue endurance of the alloys increases with decreasing the specimen thickness, revealing the thickness-dependent fatigue endurance.
(2)For the t ≥ 0.4 mm-thick specimens, σ a-Nf data located in the region A of Fig. 3(a) are quite close. In the high-σ a regime (σ a is more than about 240 MPa), Nf decreases rapidly with increasing σ a, while in the low-σ a regime (σ a < ∼240 MPa), Nf becomes fairly sensitive to σ a. In comparison, for the 0.1 and 0.2 mm-thick alloys, fatigue properties deviate from that of the t ≥ 0.4 mm-thick specimens, and are located in the region B. In the high-σ a regime (Nf ≤ 105 cycles), the fatigue strength is evidently lower than that of the t ≥ 0.4 mm-thick specimens, but it becomes inversed in the low-σ a regime.
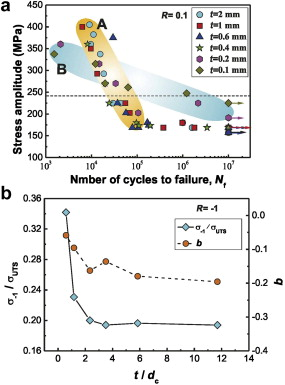 | Fig. 3 (a) Relation between the applied stress amplitude and number of cycles to failure of the Ti alloy specimens with different thicknesses, the dotted line indicates a critical stress amplitude (∼240 MPa) level as a boundary between the high- and low-stress amplitude regimes, (b) variation of fatigue limit (σ -1) normalized by σ UTS and fatigue strength exponent (b) with ratio of the specimen thickness to the colony size (t/dc). |
Considering the mean stress effect due to non-fully reversed loading here (R = 0.1), the applied stress amplitude at R = -1 is evaluated by the Goodman correction method [32] and using the corresponding yield stresses of the specimens with different thickness obtained from tensile testing results. Here, the relationship between σ a at R = -1 and Nf is fitted based on the Basquin equation, 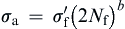

Fracture morphologies of the Ti alloy specimens with thickness of 0.1 mm and 2 mm are presented in Fig. 4(a) and (b), respectively. One can see that the 0.1 mm-thick specimen has a relatively rough fracture surface: there are several α /β lamella with different orientations on the fracture surface. In the 2 mm-thick specimen, the crack initiated at the lower left corner of the specimen, as indicated by an arrow in Fig. 4(b) and then propagated toward the upper right corner, generating a quite smooth fracture surface, as indicated by the dash line.
 | Fig. 4 SEM images of fracture morphologies of the specimens of (a) 0.1 mm and (b) 2 mm thick |
The present results clearly reveal that tensile and fatigue properties of the TC11 alloy specimens with different thickness is strongly dependent on the number of the α /β colonies in the TD of the sheet. The fatigue strength in the high-σ a regime for the 0.1 and 0.2 mm-thick TC11 alloy specimens containing only one colony in the TD is lower than that of the alloys containing more than two colonies in the TD, while it becomes inversely in the low-σ a regime.
For a conventional bulk metal the minimum geometrical scale of which is far larger than the microstructure scale (grain size), the fatigue strength of the metal in the high-cycle regime depends on tensile strength and in the low-cycle regime, is related to the tensile plasticity of the material[32]. For the pure polycrystalline copper foil with thickness ranging of 40-170 μ m, which is corresponding to the scale of about 1-4 grains, Dai et al. demonstrated that the fatigue strength of the thinner Cu foils was evidently lower than that of the thicker ones in the high-σ a regime due to their low tensile plasticity [26]. Thus, it is reasonable to believe that the fatigue strength of the 0.1 mm-thick TC11 specimens, which is lower than that of the 2 mm-thick ones in the high-σ a regime may be attributed to the lower tensile plasticity of the thinner specimens, as evidenced in Fig. 2(c).
On the other hand, in the low-σ a regime, the fatigue life may mainly depend on fatigue cracking resistance. As seen in Fig. 4(a) and (b), fatigue crack growth in the thinner specimen with only one colony (t = 0.1 and 0.2 mm) in the TD becomes anisotropic, and strongly depends on the local orientation of the α /β lamellae. The rough fracture surface induced by alternative fatigue cracking may lead to the high fatigue cracking resistance. Relatively, fatigue crack growth in the thicker specimens may become isotropic due to the existence of multiple colonies in the TD (about 11 colonies in the TD). The cracking plane may become flat macroscopically, as evidenced in Fig. 4(b). Thus, the fatigue cracking resistance becomes degraded. Such cracking behavior may be further understood by schematic illustrations shown in Fig. 5. A plastic zone size (rp) at the crack tip in the plane stress condition can be expressed as
equation(1)


where KI is the mode I stress intensity factor at the crack tip and σ y is yield stress. Taking KI = 8.75 MP m1/2 for a relatively short crack in the TC11 alloy [5], σ y = 658.00 MPa for 0.1 mm-thick and 850.72 MPa for 2 mm-thick specimens obtained experimentally, and the magnitude of rp can be obtained as 56.3 μ m for 0.1 mm-thick specimens and 33.7 μ m for 2 mm-thick specimens. In the crack growth direction, such plastic zone size for a relatively short crack is comparable to the colony size (dc = 171.06 μ m), while in the TD of the 0.1 mm-thick specimen there is only one colony ( Fig. 5(a)), leading to the fact that the crack would only meet individual colony during the crack advancing. With the crack propagation, the resistance to the crack growth becomes anisotropic due to the variation of the local colony orientation. In contrast, in the TD of the 2 mm-thick specimens ( Fig. 5(b)), several colonies simultaneously exist in the plastic zone at the crack tip. Thus, the resistance to the crack growth caused by the colony orientation is relatively constant. In light of the present findings, it is necessary for one to consider the geometrical scale-sensitive fatigue properties of the Ti alloy sheets for the reliability design of the key small-scale components.
 | Fig. 5 Schematic illustrations of plastic zone at the crack tip in the (a) thinner and (b) thicker specimens |
The fatigue properties of the Ti-6.5Al-3.5Mo-1.5Zr-0.3Si alloy specimens containing different numbers of α /β Widmanstä tten colonies in the TD of the specimens were investigated by tension-tension fatigue testing. The following conclusions can be drawn.
(1)The fatigue properties of the α /β lamellar-structured Ti alloy sheets become more sensitive to the sheet thickness of the alloy than those of bulk counterparts as the geometrical scale of the alloy is comparable to the microstructure scale.
(2)The fatigue endurance and fatigue strength exponent of the alloys increase with decreasing specimen thickness, revealing the scale-dependent fatigue endurance.
(3)The fatigue strength in the high-σ a regime for the TC11 alloy sheets containing only one colony in the TD (t = 0.1 and 0.2 mm sheets) is lower than that of the alloy sheets containing more than two colonies in the TD, while this trend becomes reversed in the low-σ a regime.
The authors have declared that no competing interests exist.
| [1] |
|
| [2] |
|
| [3] |
|
| [4] |
|
| [5] |
|
| [6] |
|
| [7] |
|
| [8] |
|
| [9] |
|
| [10] |
|
| [11] |
|
| [12] |
|
| [13] |
|
| [14] |
|
| [15] |
|
| [16] |
|
| [17] |
|
| [18] |
|
| [19] |
|
| [20] |
|
| [21] |
|
| [22] |
|
| [23] |
|
| [24] |
|
| [25] |
|
| [26] |
|
| [27] |
|
| [28] |
|
| [29] |
|
| [30] |
|
| [31] |
|
| [32] |
|