

Role of Heavy Metal Ions in the Formation of Oxyfluoride Glasses and Glass Ceramics
[Min Liu1 , Lijuan Zhao1, 2  , Yan Liu
1 , Zijian Lan1 , Lifen Chang1 , Yiming Li1 , Hua Yu1 ]
, Yan Liu]
|
|


In order to investigate the influence of different heavy metal ions on the formation of the oxyfluoride glasses and glass ceramics, samples with different PbF2/CdF2 ratios have been prepared by the melting quenching and thermal treatment method. The different effects of Pb2+ and Cd2+ on the glass network structure are investigated by FTIR and Raman spectra. During the formation of glass network structure, Pb2+ prefers to break the Si-O-Si bond and subsequently bond to F- for charge compensation, and Cd2+ prefers to break the Si-O-Al bond and is surrounded by O2-. Pb2+ and F- gather together and form the fluoride nanocrystals, while Cd2+ remains in oxide matrix after thermal treatment. Introduction of proper CdF2 is important to adjust and control the glass network structure and crystallization process in the fabrication of the transparent glass ceramics.
The transparent oxyfluoride glass ceramics doped with rare-earth ions (OFGC:RE) exhibit high fluorescence efficiency and good mechanical stability. These materials present perspective technological application in devices such as amplifiers, solid-sate lasers, fiber lasers, three-dimensional displays, photon sources, telecommunications, and so on[1], [2], [3], [4], [5] and [6]. In OFGC:RE, REs are selectively incorporated into the fluoride nanocrystals embedded in the oxide glassy matrix. The fluoride nanocrystals doped with REs are formed due to the cluster of heavy metal ions during the thermal treatment of oxyfluoride glass (OFG) precursor. The structure of fluoride nanocrystals doped with RE is a significant factor for applications of OFGC:RE in luminescent and optical fields.
After the pioneer work by Wang and Ohwaki in 1993[1], different possible fluoride nanocrystals structures from simple β -PbF2 to PbxCd1-x F2 up to a mixture of ErOF and PbF2 have been reported[2], [7], [8] and [9]. These serious disagreements arise mainly from the role of Cd2+. Haas et al.[10] thought that Cd2+ was not resided in fluoride nanocrystals by using anomalous small-angle X-ray scattering. Our previous results[11] showed that the chemical composition of the fluoride nanocrystal was REPbF5 by chemical wet etching technique. More and more researchers are convinced of the fact that there is no element of Cd in fluoride nanocrystals despite it exists in precursor composition. However, it has been reported that addition of CdF2 in the OFGC matrix affects intensely the upconversion luminescent properties[12]. Moreover, different contents of CdF2 influence the thermal stability of glasses[13]. These results indicate that Cd could influence the formation of nanocrystals despite of its absence in the composition of nanocrystals. However, a few researchers have focused on it. What's more, they ignored to consider the classical role of Cd2+ as network modifiers. In addition, the different effects of Pb2+ and Cd2+ as network modifiers have not been investigated up to now.
In the present work, the role of heavy metal ions (Pb2+ and Cd2+) in the formation of oxyfluoride glasses and glass ceramics is investigated by differential thermal analysis (DTA), Fourier transform infrared (FTIR) spectra and Raman spectra. The result will be of great significance for designing glass network structure and for studying the luminescent properties of the fluoride nanocrystals in fabricating transparent OFGCs. The result could be expanded to other similar systems.
The OFGs with the composition (mol%) of 44.5SiO2-5Al2O3-(50-x)PbF2-xCdF2-0.5Er2O3 (x = 0, 5, 10, 12, 15, 16, 19, 25, 40 and 50, labeled as Gx) were fabricated with a traditional melting-quenching route. Starting materials were fully mixed and melted in a covered platinum crucible in air-atmosphere at 1000 ° C for 2 h, and then cast into a steel plate to get OFG. The OFGs were subsequently heat treated for 8 h to fabricate OFGCs at the glass transition temperature.
The DTA curve is performed to investigate the thermal stability of OFG by a DTA HCT-2 instrument. The scan rates were 10 ° C/min. XRD powder diffraction patterns were performed to identify the crystallization phases in a D/Max-2500 diffractometer with CuKα radiation. The 2θ scan range was 5° -85° with a step size of 0.02° (2θ ). FTIR transmission spectra were carried out on the MAGNA-560 spectrometer in the range of 400-4000 cm-1 with 4 cm-1 resolution using KBr tablets. Raman spectra were measured by using a RENISHAW InVia Raman microscope at wavelength of 785 nm.
Typical DTA curves at a heating rate of 10 ° C/min are shown in Fig. 1. Tg, Tx and Tp are glass transition temperature, crystallization onset temperature and crystallization peak temperature, respectively. DTA curves for samples G0, G5, G10 and G12 present a unique exothermal peak. However, G40 and G50 exhibit wide exothermal envelop. There is no thermal effect for samples G15, G19 and G25. It means that the glass samples G0, G5, G10 and G12 could transfer to the glass ceramics by thermal treating at a certain temperature and the others could not. The glass samples G0, G5, G10 and G12 were treated thermally for 8 h. XRD analysis of the treated samples are carried out and the results are similar. The inset in Fig. 1 is the XRD pattern of G10. The diffraction peaks are corresponding to β -PbF2 crystalline phase. The treated samples are the glass ceramics because β -PbF2 nanocrystals are induced into the glass. XRD results reveal that the unique exothermal peak in the DTA is attributed to the crystallization of β -PbF2. For treated samples G40 and G50, there are complex unknown phase without PbF2 phase in XRD. In a word, DTA results imply that the glasses with excess CdF2 content (> 16 mol%) cannot transfer to OFGC.
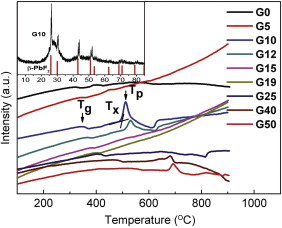 | Fig. 1 DTA curves of typical samples at a heating rate of 10 ° C/min. Inset is XRD spectrum of sample G10. |
The characteristic temperatures of chosen samples obtained from DTA curves with 10 ° C/min have been listed in Table 1. It is observed that Tg increases with increasing CdF2 content. The increase in Tg may be due to the increase in the number of bridging oxygen (BO), which indicates that the structure becomes more closely packed [14] and [15]. At the same time, the increase in Tg indicates that the viscosity of glasses and nanocrystal formation temperature increase with CdF2 content. It implies that the transition temperature rises from OFGs to OFGCs during the heat treatment process.
| Table 1 Characteristic temperatures of oxyfluoride glasses with a heating rate of 10 ° C/min |
The thermal stability range Δ T (Tx-Tg), which is defined as thermal stability factor, has been frequently used as a rough estimate of glass stability. Δ T increases and falls again with increasing CdF2 content in Table 1. And the most stable glass, with Δ T = 133 ° C, was obtained when CdF2 content is 10 mol%. Obviously, the addition of CdF2 can improve the stability of glass, which is important for future applications of this glass ceramic system ( Table 1).
Generally, Al3+ is either in four-fold coordination or in hexa-coordinate in aluminosilicate glass. However, all of Al3+ in the OFGs is four coordinated due to the high content of metal cations (Me2+: Pb2+ or Cd2+)[16] and [17]. Thus, the aluminosilicate glass framework is based on [SiO4] and [AlO4] tetrahedrons. Silicon and aluminum are performed as network formers (labeled as T). Pb2+ and Cd2+ have an important function as classical network modifiers. Network modifiers polarize BO, which leads to the broken linkages of [SiO4] and/or [AlO4] tetrahedrons and the formation of non-bridging oxygen (NBO). From the conventional view points, the heavy metal cations Pb2+ and Cd2+ have the same effect either in glass preparation process or in fluoride nanocrystal formation process. In fact, Pb2+ and Cd2+ have different influences on above-mentioned processes, which will be discussed by FTIR and Raman spectra.
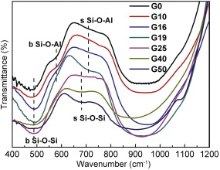
The FTIR spectra of OFGs with different CdF2 contents in the 400-1200 cm-1 region are shown in Fig. 2. The band in the 400-600 cm-1 region is assigned to Si-O-Si and Si-O-Al bending vibration[18]. The band in the 600-800 cm-1 region is associated with Si-O-Si and Si-O-Al symmetric stretching vibration between the tetrahedrons. Particularly, the band in 710 cm-1 in FTIR spectra of aluminosilicate has been assumed to be the evidence for the formation of Si-O-Al bond between [SiO4] and [AlO4] tetrahedron[19] and [20]. From Fig. 2, it can be seen that the band in 710 cm-1 shifts to lower wavenumbers (680 cm-1) as the CdF2 content increases in the glass composition. Such a shift indicates that the Si-O-Al bond is broken and replaced by Si-O-Si bond (680 cm-1). Moreover, the intensity of the bending vibration of Si-O-Al bond at 580 cm-1 also decreases with increasing CdF2 content, which further indicates that the Si-O-Al bond is broken. All the changes are attributed to the fact that Cd2+ breaks the linkage between [SiO4] and [AlO4] tetrahedrons (Fig. 2).
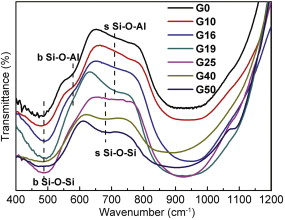 | Fig. 2 FTIR spectra of OFGs with different CdF2 content. b— bending; s— symmetry stretching. |
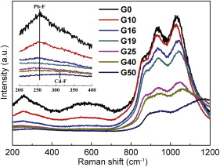
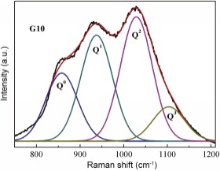
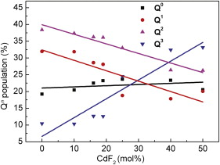
The most intense bands in 800-1200 cm-1 region in FTIR spectra are assigned to antisymmetric stretching vibrations of the bridging Si-O-Si bond within [SiO4] tetrahedron[21]. They overlap heavily and do not change obviously with various CdF2 content in all samples. However, several peaks present at 800-1200 cm-1 region in Raman spectra (Fig. 3). It is due to the characteristic vibration of different structural units Qn in the silicate glass. Qn refers to silica tetrahedron with n bridging oxygen (BO). In silicate glasses, Qn units induce absorption bands in 840-890, 900-950, 960-1040 and 1050-1100 cm-1 region for Q0, Q1, Q2 and Q3 units, respectively [22] and [23]. The bands in 800-1200 cm-1 region in Raman spectra are subsequently fitted to Gaussian lines shape to define the positions and the populations of the Qn units. Fig. 4 shows the Gaussian fitting Raman spectra of the G10 sample. The Gaussian fitting to the other samples is also analyzed. Based on the results of the bands in 800-1200 cm-1 region in Raman spectra, the populations of Qn units are calculated and presented in Fig. 5 as a function of CdF2 content. The values of Q0 unit population almost do not change, but the Q1, Q2 and Q3 unit populations vary obviously as the CdF2 content are increasing in the glass composition. While the values of Q1 and Q2 unit populations are decreasing, the values of Q3 unit population present a relatively sharp increase with increasing CdF2 content. The changes in Qn distribution indicate that the numbers of the BO are increasing. It is due to the fact that the interactions between the [SiO4] tetrahedrons and the network modifiers are becoming weak with the substitution of PbF2 by CdF2 in the glass composition. This suggests that Pb2+ prefers to break the BOs bonding to two [SiO4] tetrahedrons ( Fig. 3, Fig. 4 and Fig. 5).
 | Fig. 3 Raman spectra of OFGs with different CdF2 contents. Inset is Raman spectra in the 200-400 cm-1 region. |
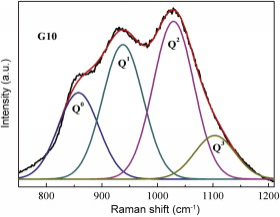 | Fig. 4 Gaussian fitting result of G10 sample in the 800-1200 cm-1 region. |
 | Fig. 5 Population of Qn in OFGs with different CdF2 contents. |
Based on the above analysis, the effect of Pb2+ and Cd2+ on the formation of OFGs and OFGCs is described in Fig. 6. Cd2+ prefers to break Si-O-Al bond but Pb2+ prefers to break Si-O-Si bond as shown in Fig. 6(a). This leads to the formation of T-O— Cd and T-O— Pb in the glass network. Then, T-O— Cd and T-O— Pb attract some anions for further charge compensation, for example, O2- and F-. From the Raman spectra in Fig. 3, the vibration of Pb-F and Cd-F bond was observed at low frequency region 255-310 cm-1. The intensity of Pb-F bond vibration at 255 cm-1 decreases as a result of the decrease of the quantity of Pb-F bond with increasing content of CdF2. A particularly noteworthy fact is that the vibration of Cd-F at 312 cm-1 was observed only in G50 sample. It suggests that Cd2+ has extremely weak combining power to F-. Meanwhile, it has been reported that the bond energy of the Pb-F is larger than that of Cd-F[24]. Consequently, Pb2+ is surrounded by NBO and F-, and Cd2+ is surrounded by O2- and thus four-fold coordinated [CdO4] appears. Previous researchers[25] and [26] have pointed out that Cd2+ appears four-fold coordinated. The conclusion is shown in Fig. 6(b). During the cooling of the glass melt or the thermal treatment, the heavy metal ions aggregate easily in certain region, which leads to local accumulation of certain chemical components in the glass network. The process is called phase separation which is shown in Fig. 6(c)[27]. The two phases are the oxide phase and the fluoride phase which evolve into oxide matrix and fluoride nanocrystals in OFGCs, respectively. Cd2+ still stays in the glass network and hardly enters into fluoride phase due to the bonding with O2-. Cd2+ enters the glass network and the numbers of the BO increase, which cause the connectivity of glass network enhancement. This result is in good agreement with the increase of Tg ( Fig. 6).
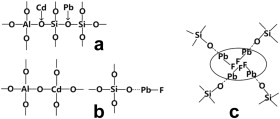 | Fig. 6 Schematic diagram of different function of Pb and Cd at the formation processes of OFGs structure and fluoride nanocrystals. |
For samples with high PbF2 content, phase separation occurs easily. In glass preparation process, if the cooling of the melt is not fast enough, the atoms in fluoride phase will be aligned in a regular array during the glass cooling process. The glass is unstable and quickly converts partly to the crystalline state, which causes glass devitrication. When CdF2 content is 10 mol%, the thermal stability is the highest. Introduction of proper CdF2 can enhance the glass stability, which is significantly important to control the crystallization in the process of heat treatment in order to fabricate transparent OFGCs.
The phase separation is weakened with substitution of PbF2 by CdF2. Meanwhile, Table 1 shows that the transition temperature rises from OFGs to OFGCs during the heat treatment process with increasing CdF2 content. It means that CdF2 inhibits the formation of fluoride nanocrystals. The glasses with excess CdF2 content (> 16 mol%) cannot transfer to OFGC.
DTA results reveal that the glass ceramics based on β -PbF2 crystalline can be obtained when CdF2 content is less than 16 mol%. The influence of Pb2+ and Cd2+ on the glass network structure is analyzed by FTIR and Raman spectra. As classical network modifiers, Pb2+ breaks the Si-O-Si bond, while Cd2+ mainly breaks the Si-O-Al bond. Moreover, Pb2+ has intense attraction to F-, which leads to Pb2+ bonding with F-. After the phase separation, Cd2+ remains in oxide matrix because it is surrounded by O2-. Proper amount of CdF2 has the advantage in improving the stability of the glasses and its crystallization, which is significantly important to control the crystallization in fabricating transparent OFGCs. Based on the research results, we can control and modify the formation process of fluoride nanocrystals through the introduction of other metal cations. It is significant for designing glass network structure and studying luminescent properties of fluoride nanocrystals in fabricating transparent OFGCs.
The authors have declared that no competing interests exist.
| [1] |
|
| [2] |
|
| [3] |
|
| [4] |
|
| [5] |
|
| [6] |
|
| [7] |
|
| [8] |
|
| [9] |
|
| [10] |
|
| [11] |
|
| [12] |
|
| [13] |
|
| [14] |
|
| [15] |
|
| [16] |
|
| [17] |
|
| [18] |
|
| [19] |
|
| [20] |
|
| [21] |
|
| [22] |
|
| [23] |
|
| [24] |
|
| [25] |
|
| [26] |
|
| [27] |
|