Synthesis, Characterization and Biocompatibility of Potassium Ferrite Nanoparticles
Khanna Lavanya*  , Verma N.K.
, Verma N.K. 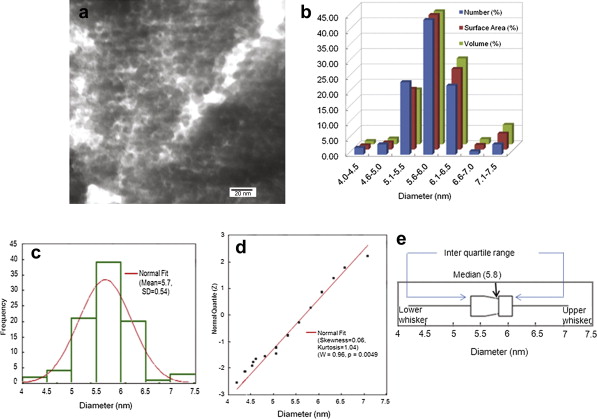
Synthesis, Characterization and Biocompatibility of Potassium Ferrite Nanoparticles |
|
Khanna Lavanya
, Verma N.K. |
| Fig. 4. a TEM micrograph, b number %, surface area %, volume % distribution, c histogram for the size distribution, d normality plot and e notched outlier box plot and mean diamond plot, of synthesized KFeO 2 NPs. |
| |