
[Zhen Zhen1 , Xi Tingfei*  , Zheng Yufeng
1, ** , Li Li4 , Li Lugee1, 2, 3, 4, 5 ]
, Zheng Yufeng, Li Li|
|


The mechanical properties, chemical properties and biocompatibility of Mg–3Sn–0.5Mn alloy were tested. A series of
Magnesium and its alloys, have shown great potential to serve as biocompatible, osteoconductive, cardiovascular and biodegradable implants for load-bearing applications [1]. Magnesium is a light weight metal with mechanical properties similar to that of natural bone, a natural ionic presence with significant functional roles in biological systems, and can be degraded in vivo via corrosion in the electrolytic environment of the body. Even though it seems that magnesium alloys are safe and effective in clinical trials and animal experiments, their high corrosion rate is unsatisfactory and has been a great concern in clinical application [2], [3], [4], [5], [6], [7], [8] and [9]. Recently, several approaches have been adopted to improve the corrosion resistance of magnesium, such as elements alloying [10], [11] and [12], surface treatment [13], [14], [15] and [16], etc. Pure Mg, Mg–Ca based [11], Mg–Zn based [17], Mg–Si based [18], Mg–Sr based [19] and Mg–RE based alloys [20] are mainly series magnesium alloys developed for bioapplications [21].
In this work, Mg–Sn–Mn alloys are comprehensively studied as a biodegradable biomaterial for the first time. Sn is an efficient aging strengthening element of magnesium alloys due to the precipitates of Mg2Sn and is much more economical for clinical applications compared to rare earth elements. When used as a major alloying element in magnesium, Sn can improve the corrosion resistance, for its high hydrogen overvoltage [22]. In physiology, Sn is a trace element in human nutrition and health and its toxicity also modifies the activities of several enzymes. It is believed that Sn can interfere with the metabolism of Zn, Cu and Ca and alter the tissue concentrations of these elements [23]. As for Mn, it has been chosen as a ternary alloying element because of its influence on the improvement of mechanical and corrosion properties of magnesium alloys due to the formation of intermetallics [24]. Though Mn have no much effect on tensile strength, it increases yield strength slightly and improves the saltwater resistance of magnesium alloy by removing iron and other heavy-metal elements [25]. In addition, Mn has no toxic effect only after extreme occupational exposure and plays a primary role in the activation of multiple enzyme system, i.e., hydrolases, kinases, transferases, decarboxylases and mitochondrial respiration [25].
The feasibility of as-extruded Mg–3Sn–0.5Mn alloy for biomedical applications was investigated through mechanical property, biocompatibility and corrosion property analysis with as-extruded WE43 as control.
As-extruded Mg–3Sn–0.5Mn alloy (extrusion ratio = 11.1:1) was studied in this work, with as-extruded WE43 as control. The working surface was ground with SiC emery papers up to 2000 grit. All the samples were then ultrasonically cleaned in absolute ethanol for 15 min. After being dried at room temperature, they were weighed by a precision balance (AL204, Mettle Toledo). Hank's solution [26](NaCl 8.0 g, CaCl20.14 g, KCl 0.4 g, NaHCO30.35 g, glucose 1.0 g, MgCl2·6H2O 0.1 g, Na2HPO4·12H2O 0.06 g, KH2PO40.06 g, MgSO4·7H2O 0.06 g dissolved in 1 L deionized water) was prepared and adjusted to pH 7.4 for immersion test and electrochemical analysis.
The microstructure was observed by optical microscopy (OM, Olympus BX51 M) and environmental scanning electron microscopy (SEM, Quanta-200FEG) in backscattered electron mode (BSE), equipped with an energy dispersive spectrometer attachment used for chemical composition analysis. The tensile samples of Mg–3Sn–0.5Mn alloy were machined according to ASTM-E8-04 [27]. Tensile tests were carried out at a displacement rate of 1 mm/min with an Instron 3365 universal test machine.
Electrochemical tests were carried out at room temperature in a beaker containing 150 mL Hank's solution on an electrochemical workstation (CHI604D, Chenhua) using a standard three-electrode configuration, with saturated calomel as a reference and a platinum electrode as a counter and the sample as a working electrode. Each sample was firstly used to monitor open circuit potential (OCP) up to 3600 s and then potentiodynamic polarization curve was measured on the sample with a scanning rate of 0.5 mV/s [28].
Each specimen was put into a tightly closed tube and the ratio of solution volume to specimen surface is 20 mL/cm2 according to ASTM-G31-72 [29] and ISO 10993-15 [30]. The static immersion test was carried out in water bath, while the dynamic immersion test was in the air bath shaker at a rotation speed of 60 r/min [31]. After static and dynamic immersion at 37 °C for 5 days, 10 days and 30 days separately, the samples were removed from the solution, gently washed by deionized water and dried at room temperature. The pH value of the immersion solution was measured by pH meter (PHS-3C, Lei-ci), and the specimens were weighed by a precision balance (AL204, Mettle Toledo). Changes on the surface morphology and microstructure of the samples after immersion were characterized by SEM (S-4800, Hitachi), and surface phase was identified on X-ray diffraction (XRD, Rigaku SmartLab) using Cu K α radiation. After that, the specimens were washed in a boiling 200 g/L chromic acid solution to remove the surface corrosion products, and then weighed and characterized by SEM again. Inductively coupled plasma atomic emission spectrometry (ICP, Profile ICP-AES, Leeman) was employed to measure the ion concentration of magnesium and alloying element released from the alloy specimens. An average of three measurements was taken for each group.
CCK-8 assay of human vascular smooth muscle cell (VSMC) line and murine fibroblast cell line (L929) were used to test the cell toxicity following ISO 10993-5 standard [32]. The cells were first cultured in Dulbecco's modified Eagle's medium (DMEM, Gibco) supplemented with 10% fetal bovine serum (FBS, Gibco), 50 μg/mLl-glutamine, 100 IU/L penicillin and 100 μg/L streptomycin. An extract of the alloys was prepared according to ISO 10993-12 [33], in which magnesium samples were immersed in the culture medium with serum at 37 ± 1 °C for 24 h in humidified 5% CO2 atmosphere in an incubator. The ratio of the surface area of the magnesium sample to the volume of the medium was 1.25 cm2/mL. The cells were seeded in 96-well culture plates at a density of 5000 cells/well, and incubated at 37 °C in humidified 5% CO2atmosphere for 24 h. Then the medium was discarded. 100 μL of the extract, 100 μL of a negative control (medium alone), and 100 μL of a positive control (10% DMSO (dimethylsulfoxide)) were added in the wells, respectively. Plates were incubated for 24, 48, and 72 h at 37 °C in an incubator. At the end of each incubation time, 10 μL WST-8 solution was added to each well and incubated for 2 h. Then the absorbance or the optical density (OD) was measured at a wavelength of 450 nm with a refereed wavelength of 630 nm using an enzyme-linked immunoassay (ELISA) microplate reader. The cell viabilities were expressed as relative growth rate (RGR) determined by RGR (%) = (OD (sample)/OD (negative control)) × 100%. The data were expressed in mean ± S.D.
Hemolysis rate and platelet adhesion were tested in this section. Healthy human blood from a volunteer containing sodium citrate (3.8 wt%) in the ratio of 9:1 was taken and diluted with PBS (4:5 ratio by volume). Samples were dipped in a standard tube containing 10 mL of PBS which has been previously incubated at 37 °C for 30 min. Then 0.2 mL of diluted blood was added to this standard tube and the mixtures were incubated for 60 min at 37 °C. Similarly, PBS solution was used as a blank control and deionized water as a positive control. After that, all the tubes were centrifuged for 5 min at 3000 r/min and the supernatant was carefully removed and transferred to the 96-well plates for spectroscopic analysis at 545 nm. In addition, the hemolysis was calculated using an ultraviolet spectrophotometer (UNIC-7200, China) following Eq. (1). The hemolysis was calculated based on the average of three replicates.
OD stands for Optical Density. OD (test) stands for the optical density of test group, OD (negative control) stands for that of PBS control group, and OD (positive control) stands for that of deionized water group.
For platelet adhesion, platelet-rich plasma (PRP) was harvested by centrifugation of whole human blood at 180 g for 20 min at room temperature. The PRP was overlaid the surface of the experimental samples and incubated at 37 °C for 1 h. After that the specimens were gently rinsed with PBS to remove non-adherent platelets. The specimens were then fixed in 2.5% glutaraldehyde solutions for 1 h at room temperature, followed by dehydration in a gradient ethanol/distilled water mixture from 50% to 100% in 10% increment for 10 min each and finally dried at room temperature. The surfaces of platelet attached samples were observed by SEM.
Statistical analysis was performed by GraphPa Prism 5 and differences were analyzed using the two-way analysis of variance (ANOVA) technique, where statistical significance was defined as P <0.05.
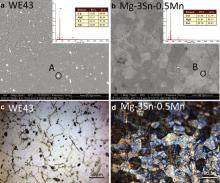
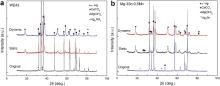
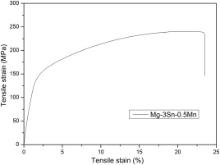
The microstructures of Mg–3Sn–0.5Mn alloy and WE43 alloy in BSE and OM mode are shown in Fig. 1. Highlighted interphases are precipitated in both alloys, which contain high concentration of Sn and Nd, respectively, as revealed by the energy dispersive spectroscopy (EDS) results shown in the insets. XRD results in Fig. 2 indicate that the phases in the original samples are composed of α-Mg with Mg2Sn precipitates in Mg–3Sn–0.5Mn alloy and Mg41Nd5 in WE43 alloy. Combined with the results of BSE, EDS and XRD, it could be concluded that the highlighted interphases are Mg2Sn and Mg41Nd5 in Mg–Sn–Mn alloy and WE43, respectively. Fig. 3 illustrates the tensile curve of Mg–3Sn–0.5Mn alloy. Strain work-hardening is observed when the tensile strength reaches about 240 MPa, while the elongation of Mg–3Sn–0.5Mn alloy is greatly improved to 11% compared to that of the commercial magnesium alloys AZ31, which is 2%, as shown in Table 1.
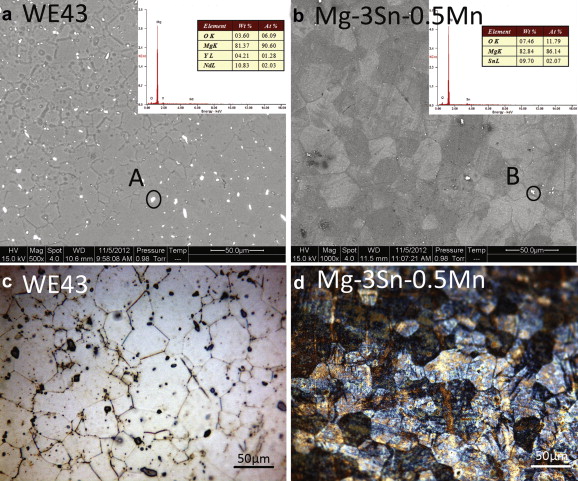 | Fig. 1. SEM micrographs in BSE mode and optical micrographs of WE43 and Mg–3Sn–0.5Mn alloys: (a) and (b) BSE micrographs and EDS of the circled highlighted particles A and B in WE43 and Mg–3Sn–0.5Mn alloys, respectively; (c) and (d) metallographic structures of the experimental alloys observed by optical microscopy. |
'>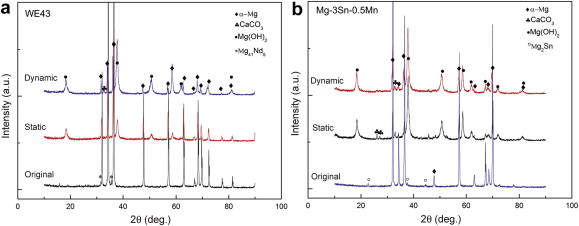 | Fig. 2. X-ray diffraction patterns of WE43 (a) and Mg–3Sn–0.5Mn (b) alloys before and after 30 days immersion in Hank's solution. |
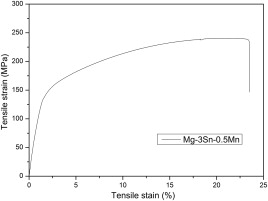 | Fig. 3. Tensile curve of Mg–3Sn–0.5Mn alloy. |
| Table 1. Comparison on the mechanical properties of Mg–3Sn–0.5Mn alloy and several commercial magnesium alloys |
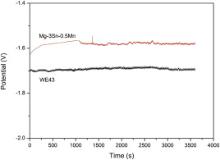
Fig. 4 displays the open circuit potential–time curves of the Mg–3Sn–0.5Mn alloy and WE43 alloy samples in Hank's solution. A nobler balance potential is observed for Mg–3Sn–0.5Mn alloy as compared to WE43 alloy, which indicates that Mg–3Sn–0.5Mn alloy is more thermodynamically stable than WE43 alloy in Hank's solution.
'>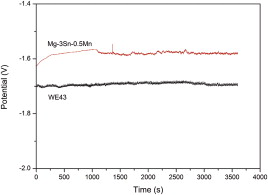 | Fig. 4. Open circuit potential–time curves of the experimental magnesium samples in Hank's solution. |
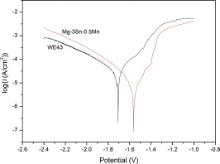
Fig. 5 presents the potentiodynamic polarization results of the specimens and the average electrochemical parameters calculated for the alloys according to ASTM G102 [34] are listed in Table 2. It is clear that the corrosion potential ( Ecorr) of Mg–3Sn–0.5Mn alloy (-1.563 V) is superior to that of WE43 alloy (-1.707 V), and the result of corrosion current ( Icorr) indicates that Mg–3Sn–0.5Mn alloy (1.705 μA/cm2) is more resistant to corrosion than WE43 alloy (12.29 μA/cm2).
'>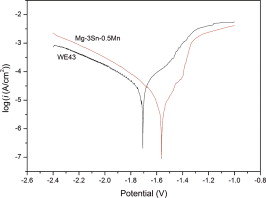 | Fig. 5. Polarization curves of the experimental magnesium samples in Hank's solution. |
| Table 2. Corrosion parameters of some newly developed magnesium alloys reported in literature |
3.3.1. PH value changes
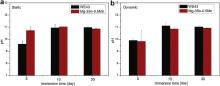
Fig. 6(a) and (b) demonstrates the pH values of the Hank's solution after Mg–3Sn–0.5Mn alloy and WE43 alloy are immersed in static and dynamic condition for different durations, respectively. Since OH- is produced during the corrosion reaction of magnesium in Hank's solution, the pH values increase during the immersion test. After 5 days static immersion, the pH values of Mg–3Sn–0.5Mn alloy solution increase from 7.4 to nearly 11 as shown in Fig. 6(a), and maintain at approximately 11 from 10 days to 30 days during the long time immersion. As for the dynamic condition ( Fig. 6(b)), the change of pH values of the two kinds of solutions shows a similar trend: the pH ascends to 10 in the first 5 days and keeps constant at about 11 in the following 20 days. There is no significant difference between pH value of Hank's solutions with WE43 alloy and Mg–3Sn–0.5Mn alloy in long time immersion, and so does that between static immersion and dynamic immersion.
P < 0.05 in the comparison between Mg–3Sn–0.5Mn alloy and WE43 alloy.'> | Fig. 6. pH value of the Hank's solution after different immersion durations: (a) static immersion test; (b) dynamic immersion test. Where * indicates P < 0.05 in the comparison between Mg–3Sn–0.5Mn alloy and WE43 alloy. |
3.3.2. Change of surface composition and morphology
The phase compositions of WE43 alloy and Mg–3Sn–0.5Mn alloy are characterized by XRD before and after immersion test in Hank's solution for 30 days, respectively ( Fig. 1), which indicates that the corrosion products of the two magnesium alloys are mainly Mg(OH)2, with a little CaCO3 attached on the surface in both static and dynamic conditions.
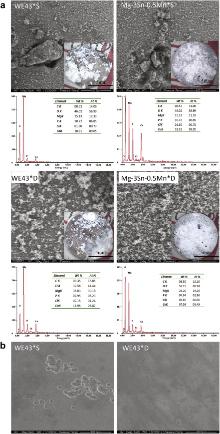
Fig. 7(a) displays the surface morphologies of the experimental specimens after being immersed in Hank's solution for 10 days. Localized corrosion can be observed on all the specimens after immersion in different environments, and samples in dynamic condition suffer less corrosion attacks than that in static condition. Besides, relatively dense corrosion products layer can be observed in dynamic condition. Meanwhile, Ca/P compounds precipitate within the corrosion layer, as indicated by the EDS results of the corrosion layer. After the corrosion products are removed by chromic acid, the matrix becomes visible ( Fig. 7(b)) and the dynamically immersed samples experience less corrosion attack than statically immersed ones as well.
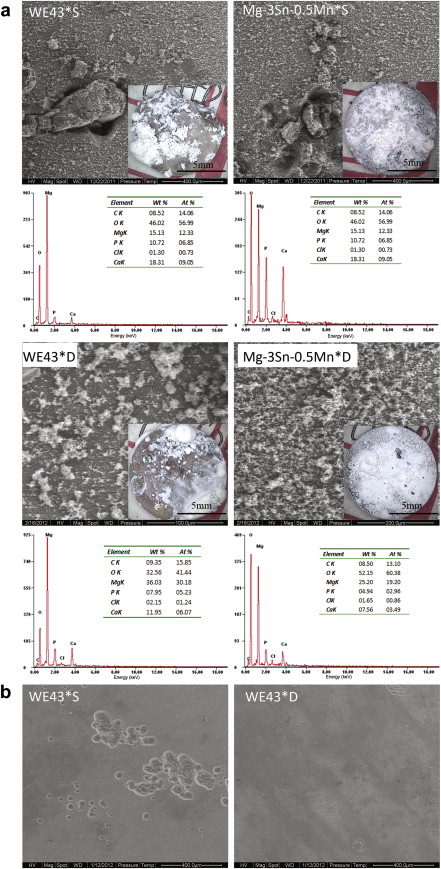 | Fig. 7. OM and SEM images from: (a) surface morphology of the experimental alloys after 10 days immersion; (b) matrix of the WE43 specimen after removing the corrosion products. |
3.3.3. Weight gain and loss
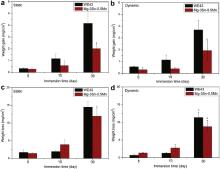
Due to the increased pH values and the super saturation of Hank's solution, more corrosion products are precipitated and accumulated on the surface, with the extension of immersion time. The weight changes before and after the corrosion products washed off by chromic acid in immersion tests are shown in Fig. 8. Fig. 8(a) and (b) presents the increased weight of magnesium alloys after static and dynamic immersion for different durations. It seems that there is no much difference between weight gains of the two alloys after short time immersion. However, after 30 days immersion, the weights of WE43 alloy samples increase much more (4.15 ± 1.72 mg/cm2) than that of Mg–3Sn–0.5Mn alloy samples (2.02 ± 0.34 mg/cm2) significantly. Meanwhile, it should be noted that samples gain less weight in dynamic condition samples than in static condition, for example, WE43 samples gain 4.15 ± 1.72 mg/cm2 in static immersion and only 3.69 ± 0.81 mg/cm2in dynamic condition, though the P-value>0.05. The results of weight loss is similar to those of weight gain, but the P -values are less than 0.05 in long time immersion, which indicates that in dynamic condition the alloys degrade milder. It can be concluded that Mg–3Sn–0.5Mn alloy has higher corrosion resistance than WE43 alloy in long term immersion, which is in good agreement with the electrochemical results.
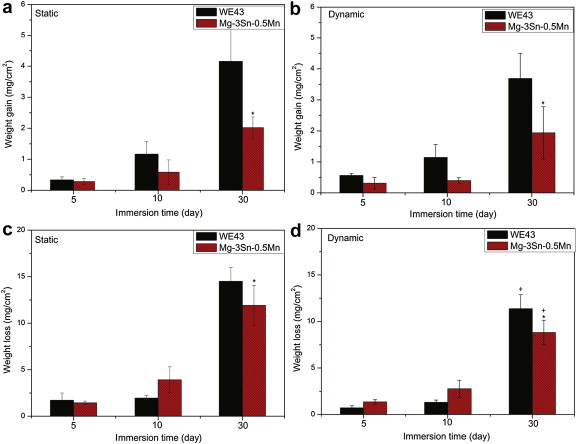 | Fig. 8. Weight gain of the experimental alloys after immersed for different time in static (a) and dynamic (b) conditions before corrosion products were removed; weight loss of experimental alloys after immersed for different time in static (c) and dynamic (d) conditions after corrosion products were removed. *S stands for static condition, and *D for dynamic condition. Above the bars * indicates P < 0.05 in the comparison between Mg–3Sn–0.5Mn alloy and WE43 alloy and + indicates P < 0.05 in the comparison between dynamic condition and static condition. |
3.3.4. Released ion concentration
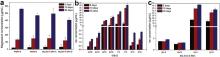
Fig. 9 demonstrates the released ion concentrations of magnesium and alloying elements in Hank's solution for the tested alloys in different immersion modes and durations. It can be found that (i) the dissolution of samples continues with the immersion time going by, as indicated by the gradually increased ion concentration of both Mg and alloying elements; (ii) the concentrations of the released Mg ion from Mg–3Sn–0.5Mn alloy samples in Hank's solution are significantly less ( P <0.05) than that of WE43 alloy samples during 30 days immersion. In addition, the concentrations of the released magnesium ion for the two experimental alloys are higher in static immersion condition than that in dynamic condition ( P <0.05). Thus, it can be concluded that the corrosion rate of Mg–3Sn–0.5Mn alloy is lower than that of WE43 alloy in both static and dynamic conditions.
P < 0.05 in the comparison between Mg–3Sn–0.5Mn alloy and WE43 alloy and + indicates P < 0.05 in the comparison between dynamic condition and static condition.'>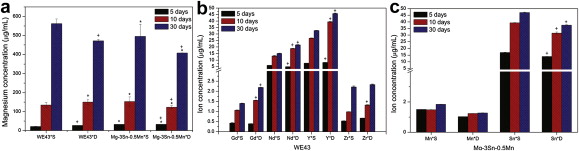 | Fig. 9. Released ion concentrations of magnesium and alloying elements of experimental alloys after different immersion durations with different immersion conditions in Hank's solution: magnesium concentration (a), ion concentration of alloying elements in WE43 (b) and Mg–3Sn–0.5Mn (c) extractions, respectively. *S stands for static condition, and *D for dynamic condition. Above the bars * indicates P < 0.05 in the comparison between Mg–3Sn–0.5Mn alloy and WE43 alloy and + indicates P < 0.05 in the comparison between dynamic condition and static condition. |
3.4.1. Cytotoxicity
Fig. 10 illustrates the cell viability of L929 (a) and VSMC (b), expressed as a percentage of the viability of cells cultured in the negative control after 24, 48 and 72 h incubation in WE43 alloy and Mg–3Sn–0.5Mn alloy extraction media, with the optical micrographs of cell morphology at 72 h (c). It can be seen that the L929 cells show a higher viability cultured with Mg–3Sn–0.5Mn alloy extracts compared with negative control, and there is no significant difference of L929 cell viability after cultured in Mg–3Sn–0.5Mn and WE43 alloy extracts. For VSMC, the extracts of both Mg–3Sn–0.5Mn alloy and WE43 alloy lead to significantly reduced cell viabilities, which drop to 65% on the third day, in comparison with the negative control. And the shape of the VSMC cells changes into round in the extraction media, as shown in Fig. 10(c). Still no significant difference ( P <0.05) of VSMC cell viability after being cultured in Mg–3Sn–0.5Mn and WE43 alloy extracts is found.
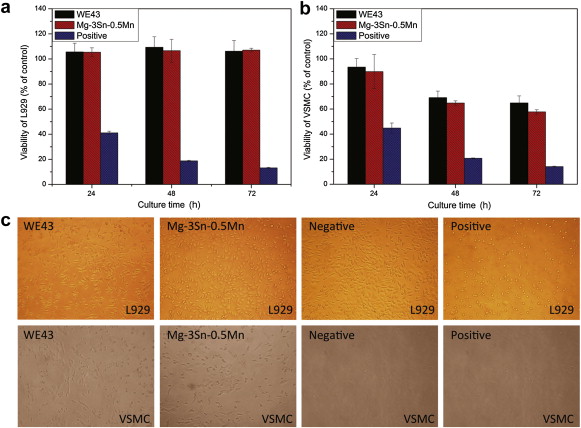 | Fig. 10. Cell viability of L929 (a) and VSMC (b) after 24, 48 and 72 h incubation in WE43 and Mg–3Sn–0.5Mn extraction media, and representative optical micrographs of the two cell lines after 72 h incubation in WE43 and Mg–3Sn–0.5Mn extraction media with negative and positive controls (c). |
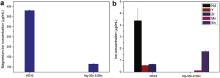
The magnesium ion concentration of WE43 alloy extraction is three times higher than that of Mg–3Sn–0.5Mn alloy extraction (125 μg/mL), as shown in Fig. 11, which is an another proof of the better corrosion resistance of Mg–3Sn–0.5Mn alloy. In addition, the ion concentrations of other alloying elements in the extracts are less than 5 μg/mL.
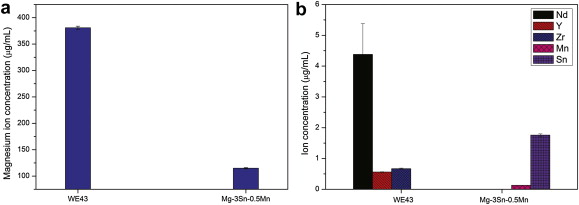 | Fig. 11. Released ion concentrations of magnesium (a) and alloying elements (b) in the extraction media. |
3.4.2. Hemocompatibility test
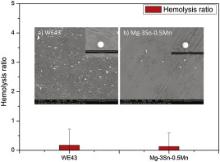
Fig. 12 displays the hemolysis of as-extruded Mg–3Sn–0.5Mn alloy and WE43 alloy samples. The hemolysis rate of Mg–3Sn–0.5Mn alloy (0.128 ± 0.461%) shows no significant difference from that of WE43 alloy (0.171 ± 0.552%), both of which are far below 5%, meaning that the alloys will not lead to severe hemolysis according to ISO 10993-4:2002 [35]. Therefore, it is suggested that the in vitro degradation of Mg–3Sn–0.5Mn has no destructive effect on erythrocyte.
 | Fig. 12. Hemolysis ratio and SEM images of platelets adhering to WE43 (a) and Mg–3Sn–0.5Mn (b) alloys. |
Typical SEM images of the Mg–3Sn–0.5Mn alloy and WE43 alloy samples with the adhesion of platelets after incubation in PRP for 1 h are shown in the inset of Fig. 12. It is easy to find that the number of platelets adhered on both the Mg–3Sn–0.5Mn alloy and WE43 alloy samples are at the same level. The platelets on the surface of experimental specimens are round, meaning that no signs of thrombogenicity of Mg–3Sn–0.5Mn alloy samples are found. Thus, it suggests that Mg–3Sn–0.5Mn alloy possesses the same good hemocompatiblity as WE43 alloy, the commonly investigated magnesium alloy as coronary stent material.
Table 1 lists the mechanical properties of several commercial magnesium alloys, which have been studied for biomedical applications. Compared with these commercial alloys [36]such as WE43 and AZ31, the most common magnesium alloys applied for stents, the tensile strength of Mg–3Sn–0.5Mn alloy stands at almost the same level (Mg–3Sn–0.5Mn 240 MPa, AZ31 240–290 MPa, WE43 260–277 MPa), while its elongation is greatly enhanced to 23% compared with AZ31, which is of great importance for stent materials as large plastic deformation happens when a stent is deployed in the blood vessel. Since WE43 alloy stent has shown its feasibility to bear the load in artery [2], [3], [4], [5] and [37], bright prospect could be seen for the implant application of Mg–3Sn–0.5Mn alloy. The excellent mechanical property of Mg–3Sn–0.5Mn alloy may be ascribed to the strengthening mechanism of the secondary phase particles Mg2Sn which is hard (∼119 HV) and brittle [22]. In addition, Sn has a reputation of enhancing castability and is beneficial to providing corrosion resistance as well [38].
Hydrogen evolution reaction is considered as one of the major corrosion mechanism for magnesium, which is shown as follows [39]:
Anodicreaction: Mg(s)→Mg2+(aq)+2e
View the MathML sourceCathodicreaction: 2H2O(l)+2e→H2(g)+2OH−(aq)
According to the EDS and XRD results in Fig. 1 and Fig. 7, the corrosion products are mainly Mg(OH)2 with calcium and phosphorus salts precipitated, which indicates that Ca2+, H2PO4- and HPO42- groups in the solution are also involved in the surface reaction on the magnesium samples. As reported by Gu et al. [40], the formation of this phosphate coating protects the magnesium alloy from fast dissolution. Both immersion tests and polarization measurement clearly prove that Mg–3Sn–0.5Mn alloy exhibits quite higher corrosion resistance than WE43 alloy in Hank's solution. Park et al. [24] reported that the presence of the Sn stabilized the Mg(OH)2 layers and elevated the resistance to hydrogen evolution in the salt solution, which resulted in decreased anodic current density. As for alloying element Mn, it improves the saltwater resistance of magnesium alloy by removing iron and other heavy-metal elements into relatively harmless intermetallic compounds, some of which will be separated out during melting [17], thus Mn also plays a beneficial role in improving the corrosion resistance of Mg alloys. Another reason for the high corrosion resistance may be ascribed to the presence of less secondary phase particles Mg2Sn in Mg–3Sn–0.5Mn alloy than Mg41Nd5 in WE43 alloy, as revealed by SEM, which leads to micro galvanic corrosion between secondary phases and Mg matrix.
Comparing the corrosion parameters of some newly developed magnesium alloys recommended by other researchers in Table 2, it could be concluded that the corrosion resistance of magnesium alloy is greatly dependent on the corrosion environment, alloying elements, and the immersion time. According to the electrochemical results listed in the table, Mg–3Sn–0.5Mn alloy exhibits excellent anticorrosion properties, with the lowest level of corrosion current ( Icorr= 1.705 μA/cm2) and the highest level of corrosion potential ( Ecorr= -1.563 V) over these magnesium alloys developed for biomedical applications.
From the perspective of immersion condition, the magnesium alloys show more uniform corrosion mode and slower degradation rate in dynamic condition than in static condition in the present study. More similar to the in vivo implant condition, dynamic immersion test is preferred than static immersion test nowadays to simulate in vivo corrosion environment. Slower degradation rate in dynamic immersion test may be due to the following two reasons: (i) the flowing solution brings the loose corrosion products off the surface but leaves the uniform dense products, which prevents the corrosion from going deep into the matrix and avoids the galvanic corrosion between corrosion products and matrix; (ii) the dynamic condition balances the pH value and Cl- of flowing solution in the pitting and the surface, which blocks the corrosion. In static immersion the solution would be stored in the hole once a pitting is formed, and the metal in the pitting will be activated, while the surface metal is still at passivation state. In the pitting, O2 concentration is reduced by reaction with Mg. Therefore, the difference in O2 concentration between outside and inside the hole forms an oxygen concentration cell, which induces the corrosion of Mg and increases Mg2+ concentration in the hole. To keep electric neutrality, the Cl-ion moves into the hole from outside. Due to the chloride concentration and hydrolysis of Mg(OH)2, the pH value in the pitting declines, resulting in autocatalytic pitting corrosion. On the contrary, in dynamic immersion condition, the flowing solution keeps the pH value and concentration of Cl-consistent between inside and outside the pitting hole, preventing the enlargement of the pitting corrosion.
Cells culture is a very useful in vitro method to examine the cell/biomaterial interactions. The cytotoxicity test indicates that Mg–3Sn–0.5Mn alloy possesses similar cytocompatibility to WE43 alloy. The extract of Mg–3Sn–0.5Mn alloy shows different influence on L929 and VSMC cell lines. In general, the sensitivity of cells to inorganic stimuli is different for different cell species, and the maximal stimulation occurs at different ionic concentrations [41]. Though Mg–3Sn–0.5Mn alloy extract leads to an undiminished viability of L929 cells, it may cause significant cytotoxicity to VSMC, which may be favorable for stent applications, since previous work [42] has reported that the reduction of the VSMC proliferation rate might play a beneficial role in antagonizing restenosis in vivo. High cell viability of L929 is observed for solutions with 1000 μg/mL Mg2+ ion concentration after 72 h incubation, and the IC50 (mol/L) for L929 of Sn4+, Sn2+, Y3+, Zr2+, Mn2+are 6.65 × 10⁻², 1.41 × 10⁻⁴, 2.54 × 10⁻⁴, 4.59 × 10⁻⁵ [43], respectively, which are much higher than the ion concentrations in the extracts. For human vascular smooth cell, Mg2+is well tolerated and does not significantly reduce cell survival after a 24 h exposure at concentrations of up to 10 mmol/L [44] and the rare earth metal ions Y3+, Nd3+ exhibit no change in metabolic activity over a wide concentration range up to 20 μg/mL [45]. Therefore, it is supposed that the decline of the cell viability might be caused by the change of pH value rather than the released ions in the corrosion procedure.
According to ISO 10993-4, hemolysis rate is used to assess the destructive effect of medical materials to the erythrocyte, which should be less than 5% for materials used in blood environment. In current study, PBS was used as negative control in order to maintain the pH following ASTM F 756-00 standard [46]. Other studies [10], [25] and [39] show that the hemolysis rates of different magnesium alloys are much higher than 5%, which may be ascribed to the fact that normal saline is chosen as the extract. Because the high concentration of Cl- in normal saline causes serious corrosive reaction with magnesium [47] and there is no buffering in the solution, the pH value reaches a much higher level, which could be the main reason for the high hemolysis ratio of magnesium alloys. In the real-life situation in vivo , the body fluid is a kind of strong buffer solution; therefore the increase in pH is limited. The addition of magnesium ions during hypotonic hemolysis prevents the disruption of adult cattle erythrocyte membranes which is accompanied by slightly increased hemoglobin retention [48]. Therefore, the hemolysis results in this article are more representative of in vivo situation, and it is suggested that in vitro degradation of Mg–3Sn–0.5Mn alloy has no destructive effect on erythrocyte.
The change of platelet shape can be used to evaluate the thrombogenicity of materials, for the initial adherence and activation of platelets on a foreign surface are believed to be major determinant of the thrombogenicity [49]. The round shaped platelets adhered on the surface of Mg–3Sn–0.5Mn and WE43 alloys demonstrate that the two alloys have excellent anti-thrombogenicity. The results of the hemolysis test and blood platelets adhesion test suggest that Mg–3Sn–0.5Mn alloy has superior blood compatibility and its hemolytic properties and hemolysis property are comparable to the commercial WE43 alloy.
The feasibility of as-extruded Mg–3Sn–0.5Mn alloy for biomedical applications has been investigated through mechanical property, biocompatibility and corrosion property analysis with as-extruded WE43 as control. Tensile test shows that Mg–3Sn–0.5Mn alloy has excellent ductility (23%) and high tensile strength (240 MPa) compared with commercial magnesium alloys. Results of polarization test indicate superior corrosion potential of Mg–3Sn–0.5Mn alloy (-1.563 V) to that of WE43 alloy (-1.707 V), and lower corrosion current of Mg–3Sn–0.5Mn alloy (1.705 μA/cm2) than that of WE43 alloy (12.29 μA/cm2). In the immersion test, the changes of sample weight, surface morphology, pH value of the immersion solution and the released ion concentrations suggest higher corrosion resistance for Mg–3Sn–0.5Mn alloy than WE43 alloy against Hank's solution. In addition, slower degradation rate was found in dynamic immersion test than in static condition due to the balance of the pH value and Cl-in the solution. For the biocompatibility, this novel magnesium alloy displays similar biocompatibility to WE43 alloy, which has no cell toxicity to L929, but mild toxicity to VSMC. Mg–3Sn–0.5Mn alloy presents superb compatibility to blood system in hemocompatibility test, of which the hemolysis rate is only 0.128% and no thrombogenicity was found in the thrombotest. Meanwhile it is much lower cost than WE43 alloys, and avoids the application of rare earth element. Our study suggests that Mg–3Sn–0.5Mn alloy could be a promising candidate for biodegradable implants, and the in vivo degradation behavior will be investigated further.
We are grateful for the financial support of the National Basic Research Program of China (Grant No. 2012CB619102), National High Technology Research and Development Program of China (Grant No. 2011AA030103), National Science and Technology Support Program (Grant No. 2012BAI18B01), and Guangdong Innovation R&D Team Project (Grant No. 201001C0104669453). The authors thank Jianxia Xu and Shuqin Wang (National Institutes for Food and Drug Control, China) for their assistance in the cytotoxicity and hemocompatibility tests. We also thank Xiaoli Liu (University of Science and Technology Beijing) and Jian Cheng (Peking University) for useful advices.
| 1. |
|
| 2. |
|
| 3. |
|
| 4. |
|
| 5. |
|
| 6. |
|
| 7. |
|
| 8. |
|
| 9. |
|
| 10. |
|
| 11. |
|
| 12. |
|
| 13. |
|
| 14. |
|
| 15. |
|
| 16. |
|
| 17. |
|
| 18. |
|
| 19. |
|
| 20. |
|
| 21. |
|
| 22. |
|
| 23. |
|
| 24. |
|
| 25. |
|
| 26. |
|
| 27. |
|
| 28. |
|
| 29. |
|
| 30. |
|
| 31. |
|
| 32. |
|
| 33. |
|
| 34. |
|
| 35. |
|
| 36. |
|
| 37. |
|
| 38. |
|
| 39. |
|
| 40. |
|
| 41. |
|
| 42. |
|
| 43. |
|
| 44. |
|
| 45. |
|
| 46. |
|
| 47. |
|
| 48. |
|
| 49. |
|
| 50. |
|
| 51. |
|
| 52. |
|
| 53. |
|
| 54. |
|
| 55. |
|