Search for articles:
Fang Miao , Qiaoshi Zeng
Corresponding authors:
Received: 2019-05-17
Revised: 2019-07-23
Accepted: 2019-07-25
Online: 2020-02-01
Copyright: 2020 Editorial board of Journal of Materials Science & Technology Copyright reserved, Editorial board of Journal of Materials Science & Technology
More
Abstract
The high-efficient degrading ability of FeBC amorphous ribbons toward acid orange 7 (AO7) via redox reactions is reported and compared with that of FePC amorphous ribbons. The time required for degrading 50% of AO7 using FeBC amorphous ribbons is only 1/3 of that using FePC amorphous ribbons. In the FeBC amorphous matrix, galvanic cell structures are formed between the Fe-B and Fe-C bonds because of the large difference in their bonding strengths, which contributes to the low reaction activation energy and the high degrading efficiency of FeBC amorphous ribbons. The extremely long service life of FeBC amorphous ribbons comes from the progressive formation of 3D porous nanosheet networks that allow more efficient mass transport and a larger specific surface area. The FeBC amorphous ribbons show a satisfying degrading ability in not only acidic but also neutral and weak alkaline AO7 solutions. This work provides an effective and environmental- friendly material for degrading azo dyes.
Keywords:
Azo dyes are widely used in the textile and painting industries, and 20% of them are directly discharged into the environment. As azo dyes are chemically stable, they are difficult to be degraded in nature, which becomes a major environmental problem [[1], [2], [3]]. It has been reported that azo dyes can be removed physically from aqueous systems by adsorption and flocculation, or degraded through biodegradation and chemical methods, such as ozonation and hypochlorite treatments [[4], [5], [6], [7], [8], [9], [10]], but all of these methods have disadvantages. Flocculation and adsorption are ineffective because they only transport contaminants to another place instead of decomposing them [8]. Biological methods have a low degrading efficiency, but the cost is high [9]. Traditional chemical methods such as oxidation using ozone (O3) and hypochlorite can effectively decolorize dyes, but have higher equipment and material costs [11,12]. Therefore, the development of low-cost, environmental-friendly and effective materials for azo dye degradation is still a challenge.
Recently, amorphous alloys, such as Fe- [[13], [14], [15], [16], [17], [18], [19], [20], [21], [22], [23], [24], [25], [26], [27], [28], [29], [30], [31], [32], [33], [34], [35], [36], [37]], Mg- [38,39], Cu- [40], Al- [41], and Co [7]-based amorphous alloys, have been reported to show a higher efficiency compared with conventional crystalline alloys in degrading azo dyes due to their short-range ordered and long-range disordered atomic structures. Specifically, Fe-based amorphous alloys have been extensively studied because of their low cost and high decomposing efficiency. Most Fe-based amorphous alloys used for decolorization are FeSiB alloy system or FeSiB alloys with minor addition of other elements. For instance, Fe78Si9B13 amorphous ribbons can effectively activate peroxymonosulfate for naphthol green B degradation [20]. Wang et al. reported that ball-milled Fe73Si7B17Nb3 amorphous powders could degrade direct blue 200 times faster than the crystalline iron powder [26]. Xie et al. revealed that the excellent dye degradation ability of Fe76Si12B9Y3 amorphous alloys toward methyl orange was mainly attributed to the heterogeneous structure consisting of Fe-rich and Fe-poor regions, which can form galvanic cells to promote fast electron transportation [25]. Fe83Si2B11P3C1 amorphous ribbons showed a fascinating catalytic efficiency while maintaining a remarkable stability for rhodamine B, methylene blue, and methyl orange degradation [42]. The degradation efficiency of the Fe-based nanocrystalline ribbons after annealing was also found to be outstanding. Wang et al. reported that the annealed Fe82.65Si4B12Cu1.35 alloys with multiple crystalline phases exhibited a higher efficiency in decolorizing direct blue 2B compared with its amorphous counterpart [28]. Meanwhile, Chen et al. found that (Fe73.5Si13.5B9Nb3Cu1)91.5Ni8.5 nanocrystalline ribbons exhibited an extremely higher degradation efficiency caused by the formation of nanoscale galvanic cells between the multiple nanocrystalline phases and the amorphous matrix [36]. The Fe78Si9B13 amorphous ribbons after annealing have self-motived galvanic cells formed between the intermetallics, presenting an excellent catalytic behavior for methylene blue degradation [43].
Our previous work showed that Fe80P13C7 amorphous ribbons had a higher degradation efficiency than the Fe78Si9B13 amorphous ribbons due to the galvanic cells formed between the strong Fe-C and weak Fe-P bonds [37]. However, the field applications of the FePC amorphous ribbons are limited by the drawbacks of the phosphorus (P) element, which is harmful to the environment. In addition, the volatile P makes the production process of the amorphous alloys more complicated. Compared with the FePC amorphous alloys, the FeBC amorphous alloys contain no volatile element and have a high saturation induction over 1.75 T [44]. Nevertheless, the degradation performance of FeBC amorphous alloys has never been reported.
In this work, we found that the Fe80B13C7 amorphous ribbons exhibited a higher reaction activity toward AO7 degradation via redox reactions compared with the Fe80P13C7 amorphous ribbons. The extremely long service life of the FeBC amorphous ribbons was revealed by the cyclic tests. Synchrotron X-ray diffraction (XRD), X-ray photoelectron spectroscopy (XPS), scanning electron microscopy (SEM), and transmission electron microscopy (TEM) analyses were performed to understand the origin of the high degrading ability and the excellent reusability of the FeBC amorphous ribbons. The effects of the temperature, initial pH, ribbon dosage, and dye concentration on the AO7 degradation efficiency using the FeBC amorphous ribbons during redox reactions were also investigated. This work provides a new opportunity for the functional applications of FeBC amorphous alloys.
FeBC alloy ingots with a nominal composition of Fe80B13C7 (in atomic percentage) were prepared by arc melting high-purity Fe (99.99 wt.%), B (99.99 wt.%), pre-alloyed Fe-C ingots (95 wt.% Fe and 5 wt.% C) in a purified argon atmosphere using an arc melting system. The FePC alloy ingots with a nominal composition of Fe80P13C7 (in atomic percentage) were prepared by induction melting high-purity Fe (99.99 wt.%), pre-alloyed Fe-P ingots (73.5 wt.% Fe and 26.5 wt.% P) and Fe-C ingots (95 wt.% Fe and 5 wt.% C) in a purified argon atmosphere using an induction melting furnace. The ribbons with a width of 1.6 mm and a thickness of 30 μm were fabricated using the single roller melt-spinning method under the protection of high-purity argon. The linear velocity of spinning roller was 40 m/s. The amorphous ribbons were cut into 1 cm long for degradation experiments. The azo dye AO7 (C16H11N2NaO4S, AR grade) used in this work was purchased from Xiya Reagent. Sodium hydroxide (NaOH, AR grade) was purchased from Greagent. Sulphuric acid (H2SO4, AR grade) was supplied by Chron Chemicals.
The amorphous nature of the ribbons was verified by the X-ray diffraction (XRD, Bruker D8 Advance) with CuKα radiation, and the transmission electronic microscope (TEM, FEI, G2 20). The atomic-level structure of samples was measured by synchrotron XRD using the beam line 13-IDD in the Advanced Photon Source of USA. Subsequently, the diffraction data was normalized by software PDFgetX2 to get structure factors S(Q). The surface morphologies and compositions of the ribbons were studied by a scanning electron microscope (SEM, FEI Sirion 200) coupled with energy dispersive X-ray spectroscope (EDS). The binding states of elements on the ribbon surfaces were studied by the X-ray photoelectron spectroscope (XPS, Thermo ESCALAB 250XI) with monochromic AlKα X-ray radiation. The total organic carbon (TOC) of the dye aqueous solution was determined by a TOC-5000CE analyzer (Shimadzu, Japan). The total Fe leaching amount in the solution was determined by inductively coupled plasma atomic emission spectroscopy (Spectroblue ICP-OES).
For all the degradation experiments, 20 mg/L AO7 solution was prepared using the deionized (DI) water in a 500 ml beaker, and the pH of solution was adjusted using 5% H2SO4 and 1 mol/L NaOH. The temperature of solution was maintained using a water bath. A specific amount of ribbons were added into the solution, which were mechanically stirred at a fixed speed. At the selected time intervals, 3 mL solution was extracted using a syringe and filtered with a 0.22 μm membrane, and then measured using an UV-vis spectrophotometer (Shimadzu UV-1280). For cyclic tests, the ribbons after each degradation experiment were first extracted from the solution and then washed with distilled water (stirred using a glass rod manually) for 30 s before the next cycle.
The electrochemical tests were carried out in the AO7 (20 mg/L) solution at pH = 3 using an electrochemical station (Gamry Interface 1000) with a three-electrode cell (a platinum counter electrode and a Ag/AgCl reference electrode). The potential-dynamic polarization curves were recorded at a sweep rate of 4 mV/s after the open circuit potentials were stabilized. Electrochemical Impedance Spectroscopy (EIS) was attained under stabilized condition with the scanning frequencies from 100 kHz to 0.01 Hz and the amplitude being 5 mV.
Both XRD patterns of the as-cast Fe80B13C7 and Fe80P13C7 amorphous ribbons exhibit a broad diffuse diffraction peak at 2 θ = 40°-50°, indicating that the samples are in amorphous states (Fig. S1, Supporting Information). The TEM images of the as-cast FeBC and FePC amorphous ribbons confirm that they are completely amorphous because no crystalline phase is observed (Fig. S2, Supporting Information).
Fig. 1(a) and (b) show the color change of the AO7 solution with the increase of reaction time using the FeBC and FePC amorphous ribbons, respectively. The reaction conditions are set as follows: T =298 K, pH = 3, ribbon dosage =2 g/L, and initial AO7 concentration (CAO7) = 20 mg/L. The AO7 solution is completely decolorized by the FeBC amorphous ribbons within 27 min, and 50 min by the FePC amorphous ribbons.
Fig. 1. Visible colour change of AO7 solution during redox reaction using (a) FeBC and (b) FePC amorphous ribbons.
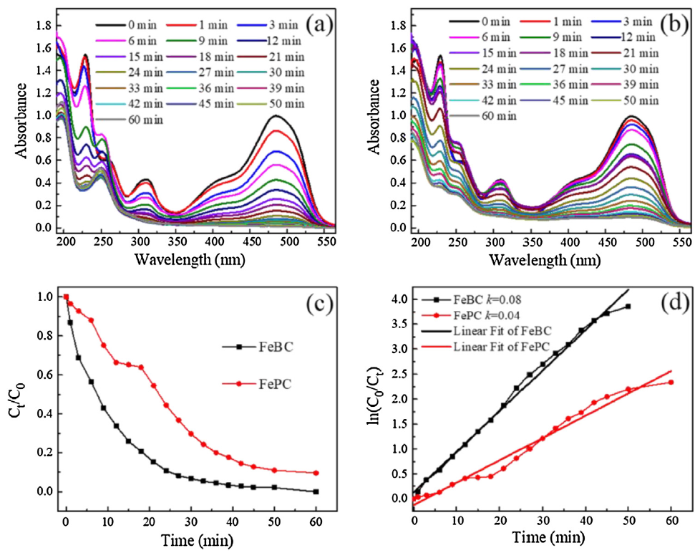
The UV-vis absorbance spectra of the filtered AO7 solutions are recorded after adding the FeBC and FePC amorphous ribbons at different reaction time, as shown in Fig. 2(a) and (b), respectively. The maximum adsorption peak at 485 nm arising from the azo chromophore of AO7 is proportional to the dye concentration in the solution. This peak becomes weak as the reaction time increases, indicating the decolorization of AO7. The concentration of the solution using the FeBC amorphous ribbons decreases significantly within the first 6 min, while the change using the FePC amorphous ribbons is slow.
Fig. 2. UV-vis absorbance spectra of AO7 solutions during the redox reactions using (a) FeBC and (b)FePC amorphous ribbons; (c) normalized concentration change of AO7 solutions during the degradation process; (d) the ln (Ct/C0) vs. time curves for FeBC and FePC amorphous ribbons. (T =298 K, pH = 3, ribbon dosage =2 g/L, and CAO7 = 20 mg/L).
Fig. 2(c) shows the normalized concentration changes of the AO7 solutions during the degradation process using both ribbons. The time required to reduce the normalized concentration to less than 50% using the FeBC amorphous ribbons is 7 min, which is 1/3 of that using the FePC amorphous ribbons (i.e., 22 min). These results demonstrate that the FeBC amorphous ribbons exhibit a better degradation capability than the FePC amorphous ribbons. The curves of the normalized concentration change fit well with the pseudo-first-order kinetic model. The corresponding reaction rate constant (k) is then calculated according to Eq. (1):
$ln(\frac{C_0}{C_t})=kt$ (1)
where k is the reaction rate constant (min-1), C0 and Ct are the initial concentration and the concentration at time t of the AO7 solution, respectively.
According to the ln (Ct/C0) vs. time curves for the FeBC and FePC amorphous ribbons in Fig. 2(d), the k of the reaction using FeBC amorphous ribbons is 0.08 min-1, which is greater than 0.04 min-1 for that using FePC amorphous ribbons. Based on the above results, the FeBC amorphous ribbons exhibits excellent ability in AO7 degradation. The reaction activation energies using both ribbons are calculated to further understand their difference in the reaction performance. As shown in Fig. S3 (Supporting Information), the reaction activation energy of the FeBC amorphous ribbons is 6.24 kJ/mol, and that of the FePC amorphous ribbons is 16.59 kJ/mol. The lower reaction activation energy of the FeBC amorphous ribbons contributes to its better performance in the redox reaction.
The TOC measurements are performed to investigate the dye mineralization during the redox reaction using the FeBC amorphous ribbons (T =298 K, pH = 3, ribbon dosage =2 g/L, and CAO7 = 20 mg/L), with the results shown in Fig. S4 (Supporting Information). The results reveal that the AO7 mineralization process requires a longer time than breaking the chromophore bonds because it takes time for the by-products to be decomposed to the final products [33]. The precipitates obtained from the reacted solution are collected and analyzed through synchrotron XRD measurements. As shown in Fig. 3, the precipitates in the AO7 solution after degradation using the FeBC amorphous ribbons are the same as those obtained when using the FePC amorphous ribbons. The main product is lepidocrocite [FeO(OH)], and a small amount of smythite (Fe9S11) and magnetite (Fe3O4) are also present. These substances contain a high content of iron and can be conveniently separated from the aqueous solution using a magnet (Fig. S5, Supporting Information).
Fig. 3. Synchrotron XRD intensity vs Q plots of the precipitates produced by AO7 solution degradation using as-cast FeBC and FePC amorphous ribbons.
3.2.1. Surface morphology
Azo dye degradation occurs on the surface of the ribbons; hence, the morphologies and elemental information on the ribbon surfaces before and after degradation are examined to uncover the origin of the high degradation efficiency of the FeBC amorphous ribbons. As shown in Fig. 4(a) and (c), the SEM images of the as-cast FeBC and FePC amorphous ribbons show practically smooth surfaces without any apparent defects, which are typical for amorphous ribbons.
Fig. 4. Surface morphologies of (a) as-cast FeBC ribbon, (b) reacted FeBC ribbon, (c) as-cast FePC ribbon and (d) reacted FePC ribbon.
Fig. 4(b) and (d) show the surface morphologies of the FeBC and FePC ribbons after the degradation, respectively. The surface of the reacted FeBC amorphous ribbons is seriously corroded, while a relatively smooth film is spread over the surface of the reacted FePC amorphous ribbons. The film on the reacted FePC ribbons may come from the formation of the low-soluble iron phosphate compounds [37]. The seriously corroded surface of the FeBC ribbons benefits the mass transport during the degradation.
The contents of the elements on the surfaces of the FeBC and FePC amorphous ribbon before and after the reactions are analyzed by EDS, and summarized in Table 1. The atomic ratios of Fe on the as-cast FeBC and FePC amorphous ribbons are 73 at.% and 75 at.%, respectively, which are close to their nominal compositions. After the degradation, the amount of Fe in both the ribbons decreases, dropping to 45 at.% for FeBC amorphous ribbons and 55 at.% for FePC amorphous ribbons. The amount of oxygen on the as-cast ribbon surfaces is too small to be detected, but sharply increases to 48 at.% and 28 at.% on the reacted FeBC and FePC amorphous ribbons, respectively. The EDS data confirms the participation of Fe from the FeBC and FePC amorphous ribbons in AO7 degradation.
Table 1 EDS analysis of the as-cast and reacted FeBC and FePC ribbons. (at.%).
| Alloys | Fe | B | P | C | O |
|---|---|---|---|---|---|
| As-cast FeBC ribbon | 73 | 17 | - | 10 | - |
| FeBC ribbon after reaction | 45 | 3 | - | 4 | 48 |
| As-cast FePC ribbon | 75 | - | 16 | 9 | - |
| FePC ribbon after reaction | 55 | - | 11 | 6 | 28 |
3.2.2. Corrosion property
Corrosion resistance is critical for the ribbons in case of decolorization applications. Therefore, the corrosion properties of the FeBC and FePC amorphous ribbons are compared in this study. Fig. 5(a) and (b) show the electrochemical polarization dynamic curves and the electrochemical impedance spectroscopy (EIS) of the FeBC and FePC amorphous ribbons in the AO7 solutions (T =298 K, pH = 3, and CAO7 = 20 mg/L), respectively. The corrosion potential of the FeBC amorphous ribbons is -0.60 V, which is lower than -0.47 V for the FePC amorphous ribbons. The corrosion current density of the FeBC amorphous ribbons is 1.8 × 10⁻⁶ A/cm2, which is higher than 1.3 × 10⁻⁷ A/cm2 for the FePC amorphous ribbons. The FeBC amorphous ribbons with a lower corrosion potential and a higher corrosion current density are more susceptible to corrosion than the FePC amorphous ribbons.
Fig. 5. Electrochemical behaviour of FeBC and FePC amorphous ribbons in AO7 solutions (T =298 K, pH = 3, and CAO7 = 20 mg/L) (a) polarization curves; (b) Nyquist plots derived from EIS measurements.
As shown in the Nyquist plots in Fig. 5(b), the FeBC amorphous ribbons present a smaller capacitance loop compared with the FePC amorphous ribbons, indicating that the electron transfer ability on the surface of the FeBC amorphous ribbons is higher than that on the surface of the FePC amorphous ribbons [45]. The result from EIS analysis also reveals that the FeBC amorphous ribbons have a lower corrosion resistance than the FePC amorphous ribbons in the AO7 solution.
The better corrosion resistance of FePC amorphous ribbons in the AO7 solutions are attributed to the following reasons. Firstly, the corrosion potential of B is -0.87 V, which is lower than -0.50 V for P in the acid solution [46]. With the lower corrosion potential, B is more susceptible to corrosion than P; thus, the corrosion resistance of the FeBC amorphous ribbon may be lower than that of the FePC amorphous ribbon. Secondly, the formed passive iron phosphate film on the surface of FePC amorphous ribbons during degradation also protects the ribbons from further corrosion. As reported by F. Scaglione, the larger corrosion resistivity leads to less reactivity [47]. Thus, the FeBC amorphous ribbons exhibit a greater activity than the FePC amorphous ribbons in terms of reacting with AO7.
3.2.3. Electronic structure
The electron transfer ability of the elements on the surfaces plays an important role in the dye degradation process using amorphous ribbons. The atomic valence and elemental contents of FeBC and FePC ribbons before and after reactions are compared using XPS, as shown in Fig. 6, Fig. 7, as well as Table S1 (Supporting Information).
Fig. 6. XPS spectra of (a) Fe 2p 3/2, (b) O 1s, (c) C 1s and (d) B 1s in binding energy regions for the FeBC amorphous ribbons before and after degradation.
Fig. 7. XPS spectra of (a) Fe 2p 3/2, (b) O 1s, (c) C 1s and (d) P 2p in binding energy regions for the FePC amorphous ribbons before and after degradation.
Fig. 6(a)-(d) show the binding energies of Fe 2p 3/2, O 1s, C 1s, and B 1s of the FeBC amorphous ribbons before and after degradation, respectively. Three components are identified in the Fe 2p 3/2 spectra and assigned to Fe0 (706.01 eV), Fe2+ (709.99 eV), and Fe3+ (713.02 eV) [13,21,48]. The surface of the original ribbons contains Fe0 and Fe2+, whereas that of the reacted ribbons contains Fe2+ and Fe3+. Fe0 drastically disappears, and Fe3+ gradually appears during the degradation, indicating that Fe0 and Fe2+ lose electrons during the reaction. The peaks of the O 1s spectrum of the original ribbons presented in Fig. 6(b) can be attributed to B-O (531.05 eV), C-O (529.65 eV), and Fe-O (529.11 eV) bonds [37,[49], [50], [51]]. The surface of the reacted ribbons contains more Fe-O bonds compared with the original ribbons, which is in accordance with the participation of Fe0 and Fe2+ in the redox reaction.
Fig. 6(c) shows two peaks at C0 (284.35 eV) and C2+ (288.1 eV) for the C 1s spectra for the original and reacted ribbons, respectively [37,52,53]. The C0/Ctotal values in the original and after-degradation ribbons barely change (i.e., 89% and 87%, respectively). Interestingly, the total amount of carbon on the reacted ribbon surface sharply decreases compared with that on the original ribbon surface, indicating a large amount of carbon is involved in the reaction. Two peaks at B0 (187.2 eV) and B3+ (191.09 eV) are deconvoluted for the B 1 s spectra in Fig. 6(d) [13,[54], [55], [56]]. The value of B0/Btotal decreases from 45% for the original ribbons to 0 for the ribbons after degradation, implying that the B0 is also involved in the redox reaction.
Fig. 7(a)-(d) show the binding energies of Fe 2p 3/2, O 1s, C 1s, and P 2p for the FePC amorphous ribbons before and after degradation. As shown in Fig. 7(a), the surface of the original ribbons contains Fe0 and Fe2+, whereas that of the reacted ribbons contains Fe2+ and Fe3+, indicating that the iron in FePC amorphous ribbons also participates in the reaction. Two peaks at P—O/C-O (530.79 eV) and Fe-O (529.07 eV) are detected for the O 1s spectrum of the original ribbons in Fig. 7(b). Compared with the original ribbons, the surface of the reacted ribbons contains more P—O and C—O bonds. As shown in Fig. 7(c), no evident difference of C0/Ctotal is found between the original and after degradation for FePC amorphous ribbons, and the amount of total carbon doesn’t change much either. For the P 2p spectra in Fig. 7(d), the peaks at 128.81 and 129.35 eV are assigned to P0, and 132.38 eV is from P5+ [37,57]. P0/Ptotal decreases from 52% in the original ribbons to 31% in the reacted ribbons, indicating that only 21% of P0 is involved in the redox reaction.
As illustrated previously, the weak bonding strength of Fe-P and the strong bonding strength of Fe-C promoted the formation of galvanic cells in the FePC amorphous ribbons, resulting in the excellent degradation properties [37,58]. Compared with Fe-P atomic pair, Fe-B (-26.0 kJ/mol) atomic pair has a much smaller negative mixing enthalpy [59], indicating that the bond strength of Fe-B should be smaller than that of Fe-P, which was also confirmed by the ab initio molecular dynamics simulations [60]. As a result, in the FeBC amorphous ribbons, the strong Fe-C bonds and weak Fe-B bonds also lead to the formation of galvanic cells, and the potential difference of the galvanic cells between Fe-B and Fe-C is larger than that between Fe-P and Fe-C, resulting in the faster dissociation of the Fe-B bonds. This explains the more loss of B0 (45%) than that of P0 (21%) during degradation. Thus, the FeBC amorphous ribbons have better degradation performance compared to the FePC amorphous ribbons.
3.3.1. Long service life
Reusability of materials is an important factor in wastewater remediation. The reaction parameters of all the recycling experiments in this study are as follows: T =298 K, pH = 3, ribbon dosage =2 g/L, and CAO7 = 20 mg/L. Fig. 8(a) shows the normalized AO7 concentration change using the FeBC amorphous ribbons from the 1 st to 22nd runs. The k value is relatively stable for the FeBC amorphous ribbons during each reaction [Fig. 8(c)], suggesting that the FeBC amorphous ribbons can be used for at least 22 times with an acceptable dye degrading efficiency. The value of k for the 7th cycle is lower than those for the 6th and 8th cycles. This unusual phenomenon may be closely related to the surface morphologies of the ribbons.
Fig. 8. Normalized concentration change of AO7 solutions at different degradation cycles during the redox reactions (a) using FeBC ribbons, (b) using FePC ribbons; derived k at different degradation cycles (c) using FeBC ribbons, (d) using FePC ribbons.
Fig. 8(b) shows the result of reusability tests for the AO7 degradation using the FePC amorphous ribbons. The redox reactions using the FePC amorphous ribbons can decompose the AO7 solution within 70 min for 5 cycles. As shown in Fig. 8(d), the k of the FePC amorphous ribbons continuously decreases from 0.043 min-1 for the 1 st cycle to 0.004 min-1 for the 10th cycle. The above results reveal that the FeBC amorphous ribbons have a longer service life than the FePC amorphous ribbons.
The weight loss and ion leaching amount as a function of reaction cycles are shown in Figs. S6 and S7 (Supporting Information), to further understand the cyclic degradation process using the FeBC and FePC amorphous ribbons (T =298 K, pH = 3, ribbon dosage =2 g/L, and CAO7 = 20 mg/L). The weight loss of each cycle has been calculated according to Eq. (2):
$WL_{cycle}=\frac{W_{before}-W_{after}}{W_0}×100%$ (2)
where WLcycle is the weight loss of ribbons during each cycle, W0 is the initial ribbon dosage (0.50 g), and Wbefore and Wafter are the weight of the ribbons before and after degradation for the corresponding reaction cycle, respectively.
The weight loss [Fig. S6(a), Supporting Information] and the ion leaching amount (Fig. S7, Supporting Information) of the FeBC amorphous ribbons are relatively stable for each reaction, suggesting that the degradability of the FeBC amorphous ribbons remains stable within 22 cycles. However, the weight loss [Fig. S6(b), Supporting Information] and ion leaching amount (Fig. S7, Supporting Information) of the FePC amorphous ribbons drastically decrease after 5 cycles, indicating that the degradability of the FePC amorphous ribbons is significantly reduced after 5 cycles.
3.3.2. Atomic structure
Synchrotron XRD measurements are conducted on the amorphous ribbons before and after the recycling degradation tests to shed light onto the origin of the long service life of the FeBC amorphous ribbons from the atomic structure aspect. Both the FeBC and FePC amorphous ribbons show an amorphous structure state before the degradation [Fig. 9(a) and (b)]. The FeBC amorphous ribbons remain amorphous after the degradation, and no crystallization product is found to adhere on the ribbon. However, the synchrotron XRD spectrum of the reacted FePC amorphous ribbons has two obvious crystallization peaks [insets, Fig. 9(b)], revealing that the crystallization products (confirmed as iron phosphates) appear on the reacted FePC ribbon surface.
Fig. 9. Synchrotron XRD intensity vs Q plots of (a) the FeBC amorphous ribbons before and after degradation and (b) the FePC amorphous ribbons before and after degradation; (c) the difference curves for △Int = Intbefore-Intafter of FeBC and FePC amorphous ribbons; (d) the synchrotron XRD total structure factors S(q) of as-cast FeBC and FePC amorphous ribbons.
Furthermore, △Int (△Int = Intbefore - Intafter) is calculated and plotted in Fig. 9(c), where Int denotes the intensity of the synchrotron XRD peaks. The results clearly show that the △Int of the FeBC amorphous ribbons is much larger than that of the FePC amorphous ribbons, demonstrating that the reacted FeBC amorphous ribbons may have a more porous structure than that of the reacted FePC amorphous ribbons, which may explain why the FeBC amorphous ribbons possess a longer service life.
In addition, the synchrotron XRD analysis also provides clues for the better dye degradation ability of FeBC amorphous ribbons compared with FePC amorphous ribbons. The total structure factor of the as-cast FeBC and FePC ribbons is observed in Fig. 9(d). The Q1 value for the FeBC amorphous ribbons is 3.102 Å-1, which is larger than that of the FePC amorphous ribbons (3.065 Å-1). Q1 is inversely proportional to the mean atomic distance [61]; hence, a larger Q1 in the FeBC amorphous ribbons corresponds to a smaller mean atomic distance compared with that of the FePC amorphous ribbons. Thus, the FeBC amorphous ribbons may have more active sites per unit volume [62]. In addition, the peaks of the structure factor for the FeBC amorphous ribbons are broader than those for the FePC amorphous ribbons, proving that the structure of the FeBC amorphous ribbons is more disordered to promote the degradation reaction. Both of these factors contribute to a better degradation performance of FeBC amorphous ribbons.
3.3.3. Formation of the through-pore structure
The surface morphologies are crucial not only for the degradation efficiency but also for the reusability of amorphous ribbons. The morphologies of the FeBC and FePC ribbons after the cyclic reactions are compared to explain the extremely long service life of the FeBC amorphous ribbons in the redox reactions. As shown in Fig. 10, the top views of both the FeBC and FePC ribbons after the cyclic reactions show 3D nanosheet arrays with a porous structure, except that the pores in the nanosheet array structure of the FeBC amorphous ribbons are much larger than those of the FePC amorphous ribbons. The larger pores on the FeBC amorphous ribbons allow the AO7 solution to infiltrate easily and form deep pores.
Fig. 10. SEM micrographs show the top views of (a) the FeBC amorphous ribbons after 22 reaction cycles, and (b) the FePC amorphous ribbons after 10 reaction cycles.
The cross-sectional morphologies of the FeBC and FePC ribbons after the cyclic reactions are also analyzed. As shown in Fig. 11, the cross-section of the FeBC amorphous ribbons exhibits overall uniform nanosheet arrays with a porous structure (Fig. 11(b and d)) and a straight line in the middle of the thickness direction after the 22nd cyclic reaction. The line in the middle of the ribbon is also made of porous structures, as shown in Fig. 11(c). The reaction processes from both sides to the center of the ribbons, and the through-pore structure is formed after the 22nd reaction cycle. In the contrary, the cross-section of the FePC amorphous ribbons after the 10th cyclic reaction presented in Fig. S8 (Supporting Information) only has a thin layer of the reacted region on the surface and a large unreacted region inside. The reacted region of the FePC amorphous ribbons is a thin passive iron phosphate film, which prevents further degrading reaction [58].
Fig. 11. SEM micrographs of the FeBC amorphous ribbons, (a) side view after 22 reaction cycles, with an overall 3D porous nanosheet arrays; (b), (c), (d) the magnified views of the reacted regions.
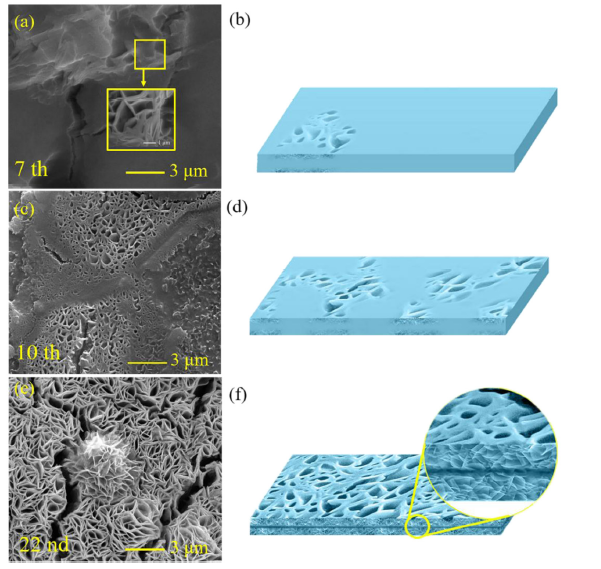
The surface morphology changes of the ribbons during the cyclic tests are analyzed to understand the formation process of the through-pore structures in the FeBC amorphous ribbons after 22 reaction cycles (Fig. 12). As the degradation efficiency is lower at the 7th run using FeBC ribbons, surface morphology of the FeBC ribbons after the 7th run is investigated as shown in Fig. 12(a). The ribbon surface after the 7th reaction cycle is rough, showing the initial formation of the 3D nanosheet array structure, as well as the cracks caused by corrosion. The continuous consumption of iron during the initial 6 cycles causes a decrease in the degradation efficiency in the 7th cycle. The SEM analysis of the ribbon surface after the 10th run reveals that more than half of the ribbon surface are covered with 3D nanosheet array structures and cracks present on the rest of the surface [Fig. 12(c)]. After the 22nd reaction cycle, the nanosheet array structures are observed to spread all over the ribbon surface [Fig. 12(e)], and the size of the 3D pores is about 200-500 nm (measured at their narrower necks).
Fig. 12. Surface morphologies of FeBC amorphous ribbons, (a) after 7 reaction cycles, enlarged image of the section marked in the inset; (c) after 10 reaction cycles; (e) after 22 reaction cycles. Schematic diagram showing the formation process of the nanosheet array structures in FeBC amorphous ribbons, (b) after 7 reaction cycles; (d) after 10 reaction cycles; (f) after 22 reaction cycles, enlarged diagram of the section marked in the inset.
The schematic diagram of the formation process of the 3D nanosheet array structures in the FeBC amorphous ribbon can be drawn based on the abovementioned SEM analyses [Figs. 12(b), (d), and (f)]. The schematic diagram demonstrates that the 3D nanosheet array structures are gradually formed on the surface, which allows the AO7 solution to penetrate into the inner layers of the ribbons and form deep pores. Therefore, the cross-section of the FeBC amorphous ribbons possesses an overall 3D nanosheet arrays with through-pore structures after the 22nd cyclic reaction.
The different surface morphologies of the FeBC and FePC ribbons after the cyclic reactions are attributed to two reasons. Firstly, in the redox reactions, the weak Fe—B bonds in the FeBC amorphous matrix are more easily broken compared with the Fe-P bonds in the FePC ribbons. Thus, corrosion is accelerated because of the strong galvanic cell effect between the Fe-B and Fe-C bonds. Secondly, the formed iron borate compounds on the FeBC ribbons are soluble in the acidic solutions, while the iron phosphates on the FePC ribbon surface are passive even in the acidic solutions and can prevent further corrosion [16,37,63]. The iron borate products are continuously dissolved with increasing reaction time, causing the matrix to reorganize into interconnected ligaments separated by open through-pores. Similarly, the results from the synchrotron XRD measurement also prove that the reacted FeBC amorphous ribbons have a more porous structure, and that the passive iron phosphate film appears on the reacted FePC ribbon surface.
The through-pore in the 3D nanosheet array structure is a key factor for improving the degradation performance [64]. The through-pore provides efficient mass transport pathways to allow the continual exposure of the unsaturated surface reaction sites on the underline “fresh” ribbon surface to the solution [65]. The porous structures can enlarge the surface area and increase the reaction sites to achieve a high reaction activity [66,67]. Therefore, the FeBC amorphous ribbons with through-pore structures show an extremely long service life.
3.4.1. Effect of the pH
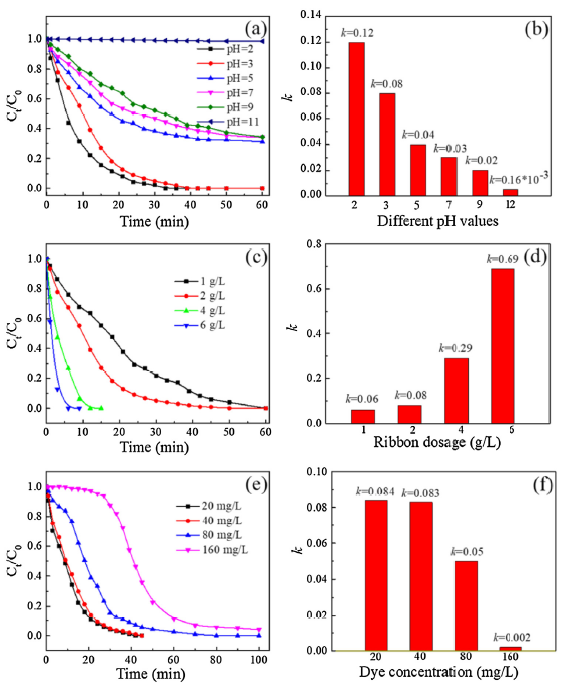
The effect of pH on the degradation efficiency of the FeBC amorphous ribbons is studied while keeping the other reaction conditions constant at T =298 K, ribbon dosage =2 g/L, and CAO7 = 20 mg/L, as shown in Fig. 13(a). The dye can be completely degraded after 24 min at pH = 2, and 27 min at pH = 3. The degradation efficiency of the solution decreases with an increasing pH value. Only 57% and 50% AO7 are degraded after 24 min when the pH increases to 5 and 7, respectively. In the weak alkaline solution (pH = 9), 37% AO7 is decomposed within the same time; however, the AO7 decolorization is rarely observed in the strong alkaline solution (pH = 11). Fig. 13(b) shows the k of the reactions at different pH values. The k decreases monotonically with increasing pH. The highest k = 0.12 min-1 is observed at pH = 2, whereas the lowest k = 0.16 × 10⁻³ min-1 occurs at pH = 11. Note that the dye degradation efficiency in the acidic condition is always faster than that in the neutral and alkaline conditions, indicating the better electron transfer ability in an acidic solution than in an alkaline solution [47].
Fig. 13. Effects of (a) pH, (c) ribbon dosage, and (e) dye concentration on the normalized concentration change of AO7 solutions during the redox reactions using FeBC amorphous ribbons. Derived k at different (b) pH, (d) ribbon dosage, and (f) dye concentration using FeBC amorphous ribbons.
3.4.2. Effect of the ribbon dosage
Fig. 13(c) shows the effect of the FeBC amorphous ribbon dosage in the range of 1-6 g/L on the AO7 degradation performance while keeping the other reaction conditions constant at T =298 K, pH = 3, and CAO7 = 20 mg/L. The degradation efficiency increases with increasing ribbon dosage. Fig. 13(d) shows the value of k under each ribbon dosage condition, which increases with the increasing ribbon dosage. The 6 g/L ribbon dosage for degrading 20 mg/L AO7 shows the highest k = 0.69 min-1, whereas the lowest k = 0.06 min-1 occurs at the 1 g/L ribbon dosage. A larger dosage of the amorphous ribbons apparently leads to a better degradation efficiency because of the larger amount of available reaction sites.
3.4.3. Effect of the dye concentration
Fig. 13(e) shows the degradation efficiency at the varied AO7 concentration while keeping the other reaction conditions constant at T =298 K, pH = 3, and ribbon dosage =2 g/L. A continuous decrease of the degradation efficiency with the increasing AO7 concentration is observed. Fig. 13(f) presents the k under each dye concentration condition. The highest k = 0.084 min-1 is observed at CAO7 = 20 mg/L and sharply decreases to k = 0.002 min-1 by increasing the dye concentration to 160 mg/L. This result indicates that it takes the FeBC amorphous ribbons more time to degrade AO7 with a higher concentration.
In summary, this work compares the dye degradation efficiency in the redox reaction using FeBC and FePC amorphous ribbons. In the FeBC amorphous matrix, galvanic cell structures are formed between the weak Fe-B and strong Fe-C bonds because of the large difference of their bonding strength, which contributes to the low reaction activation energy and the high degrading efficiency of the FeBC amorphous ribbons. The reusability tests reveal that the extremely long service life of the FeBC ribbons comes from their gradual formation of 3D nanosheet array structures with through-pores. The adaptability of the FeBC amorphous ribbons in the redox reaction is evaluated using varied pH, ribbon dosage, and dye concentration. This work reveals the mechanism of the highly efficient degradation of the AO7 solution using FeBC amorphous ribbons and proposes this alloy as a novel potential material used in wastewater treatment.
This work was financially supported by the National Natural Science Foundation of China (Nos. 51631003 and 51871054) and the Natural Science Foundation of Jiangsu Province of China (Grant No. BK20191269). This research used beam line 13-IDD in the Advanced Photon Source (APS) of USA. APS is supported by the Department of Energy (DOE) office of Science (DE-AC02-06CH11357).
Supplementary material related to this article can be found, in the online version, at doi:https://doi.org/10.1016/j.jmst.2019.07.050.

 WeChat
/
| 〈 |
|
〉 |


