Search for articles:
Youliang Cheng, Mengsha Bai, Jian Su, Changqing Fang , Hang Li, Jing Chen, Jieming Jiao
Corresponding authors:
Received: 2018-10-12
Revised: 2018-11-13
Accepted: 2019-01-7
Online: 2019-08-05
Copyright: 2019 Editorial board of Journal of Materials Science & Technology Copyright reserved, Editorial board of Journal of Materials Science & Technology
More
Abstract
A synthesis strategy of fluorescent carbon quantum dots (CQDs) with high quantum yield (QY) using aqua mesophase pitch (AMP) as the carbon source has been developed via the hydrothermal method in this study. The hydrothermal temperature and soaking time have important effects on the morphology and QY of CQDs. As-prepared CQDs at 120 °C holding for 24 h (CQDs-120-24) have the uniform size of about 2.8 nm, and the QY can reach 27.6%. The obtained CQDs are successfully modified with ammonia and thionyl chloride, respectively, and they exhibit an excellent photocatalytic performance on degrading rhodamine B (Rh B), methyl blue (MB) and indigo carmine (IC). Importantly, the degradation percentage of N-CQDs on Rh B under natural light for 4 h reaches 97% with the degradation rate constant of 0.02463 min-1 and it can maintain 93% after repetitively used 5 times. The results indicate that these as-prepared CQDs have the potential application in degrading organic dyes.
Keywords:
Carbon quantum dots (CQDs) were first synthesized from carbon nanotubes (CNTs) during the process of electrophoresis [1], having internal sp2 and external sp3 carbon atoms. The CQDs are rich in hydrophilic functional groups, such as carboxyl, hydroxyl, amino and so on [[2], [3], [4], [5]], which can be uniformly dispersed in polar solvents. Moreover, they exhibit luminescent property, chemical inertness, low toxicity [6], excellent water solubility and conductivity [[7], [8], [9], [10]]. Due to these advantages [11], CQDs have been applied in biological imaging and labeling [12], fluorescent probes [13,14] and chemical sensors [15]. The strategy for synthesizing CQDs includes arc discharge [16], laser etching [17], electrochemistry [18], microwave [19], organic carbonation [20], ultrasonication [21] and hydrothermal methods [22]. Importantly, the hydrothermal method is mostly used due to the simple process, easy controllability, high purity and environment-friendly products. Huang et al. [23] synthesized the high stability and low toxicity CQDs with a quantum yield (QY) of 13.5% by the hydrothermal method. Yang et al. [24] prepared the heteroatom (N, S and Se) doped CQDs with a large scale (more than 100 g) via one-step hydrothermal reduction. However, the QY of CQDs synthesized by the above-mentioned methods is low. It is worth noting that the QY can be improved by passivating the surface of CQDs with the chemical modification method [25].
Organic dyes, as a kind of persistent pollutants, are spontaneously biodegraded difficultly, generating serious environment and health problems [26,27]. In recent years, the photocatalysis degradation of organic dyes using CQDs as the catalysts has attracted the attentions of researchers [28,29]. Li et al. [30] have used CQDs to degrade benzyl alcohol with a high conversion up to 92%. Muthulingam et al. [31] prepared CQD/N-ZnO composites with an excellent photocatalytic performance (the degradation rate of malachite green is 100%). However, the low utilization efficiency of visible light reduces the photocatalytic efficiency. In order to improve the photocatalytic activity of CQDs, they are usually modified with semiconductor and precious metal materials. The CQDs with semiconductor materials would promote the migration rate of carriers (the electron and hole), increasing the photocatalytic redox rate and improving the photocatalytic activity [32]. In addition, the light absorption of CQDs with precious metals in the visible region can be enhanced and then the utilization efficiency of visible light increases [33]. Due to the variety of functional groups on the surface of CQDs, they will exhibit different photocatalytic performances [34]. Therefore, the photocatalytic activity of CQDs can be effectively modulated by doping or tailoring their surface functional groups like those containing -Cl or -N [35].
The aqua mesophase pitch (AMP), a kind of amphiphilic carbonaceous materials, is rich in carboxyl and hydroxyl groups, which may be used as a suitable precursor to synthesize CQDs with water solubility. Herein, in order to efficiently degrade the organic dyes in water, we report a facile approach to synthesize CQDs via the hydrothermal treatment of AMP without any assistant agents. Then, the as-prepared CQDs were modified with ammonia and thionyl chloride to obtain N-CQDs and Cl-CQDs, which were used to degrade rhodamine B (Rh B), methyl blue (MB) and indigo carmine (IC). The whole process of the preparation and degradation is shown in Fig. 1.
Fig. 1. Synthesis of CQDs and the degradation process of the of organic dyes.
Coal tar pitch was obtained from Wuhan Iron & Steel Co., Ltd. Ammonia was purchased from Huaxia Reagent Co., Ltd. Rh B, MB, IC and hydrogen peroxide were purchased from Beijing Chemical Co., Ltd. Deionized water was used throughout the experiment.
The AMP was prepared by oxidizing coal tar pitch, alkali re-dissolving and acid precipitating according to the previous report [36]. The synthesis of CQDs was as follows: 0.03 g of AMP was added into 90 mL of deionized water with stirring for 20 min, then poured into a 100 mL autoclave with polytetrafluoroethylene lining, subsequently kept for 12 h, 24 h and 48 h at 120 °C, 150 °C and 180 °C, respectively. Finally, the solution was centrifuged at 8000 rpm for 10 min, and the supernatant fluid containing CQDs was preserved in dark. The as-prepared CQDs were denoted as CQDs-x-y, where “x” is the hydrothermal temperature and “y” is the soaking time.
N-CQDs: 500 μL of 25% ammonia was added into 10 mL of the solution containing CQDs-120-24. The mixture was kept for 12 h at 120 °C in the autoclave, and then kept for another 0.5 h at 80 °C in an open system to remove impurities.
Cl-CQDs: 500 μL of thionyl chloride was added into 10 mL of the solution containing CQDs-120-24. The mixture was kept for 12 h at 120 °C in the autoclave, and then kept for another 0.5 h at 80 °C in an open system to remove impurities.
Degradation of Rh B: 5 mL of as-prepared N-CQDs, Cl-CQDs and CQDs-120-24 solutions were mixed with 5 mL of 40 mg/L Rh B solution, respectively, and 175 μL of hydrogen peroxide were subsequently added. Then, these solutions were preserved in the dark environment for 1 h to ensure the reactants reaching the adsorption and desorption equilibrium on the catalyst surface. Finally, the catalytic degradation was carried out under natural light for 4 h. As a contrast, 175 μL of hydrogen peroxide was added to 5 mL of 40 mg/L Rh B solution, and then 5 mL of deionized water instead of CQDs was added into the mixed solution for investigating the effect of hydrogen peroxide on the photocatalytic degradation of Rh B solution under the same conditions.
The degradation of MB and IC was carried out in the same procedure respectively, except that 15 mg/L MB and 30 mg/L IC was added instead of 40 mg/L Rh B and 175 μL of deionized water was instead of hydrogen peroxide.
The reusage of N-CQDs: N-CQDs were collected by centrifuging the solution obtained after the photocatalytic degradation of Rh B at 22000 rpm for 20 min, and then re-added into the mixture of new reactants to initiate the next degradation of Rh B solution under the same conditions. The same procedure was repetitively carried out for 5 times.
Transmission electron microscopy (TEM) images were obtained on a Hitachi H600 microscope operating at 100 kV. Prior to TEM analysis, the sample was dropped on a Cu grid coated with an ultrathin amorphous carbon film, and then dried under an ambient condition. All the UV-vis spectra were carried out using a Shimadzu UV-2550 spectrophotometer. Photoluminescence (PL) spectra were obtained on a Hitachi-4600 fluorescence spectrophotometer, and the concentration of the samples were controlled to be 0.01 mg/mL. The X-ray photoelectron spectroscopy (XPS) were performed using a Kratos Axis Ultra spectrometer with a monochromated Al-Kα radiation (λ = 0.15406 nm). Fourier transformed infrared spectroscopy (FTIR) investigation was accomplished by a FTIR-7600 spectrometer using KBr pellets as the matrix in the frequency range of 500-4000 cm-1.
The QY of CQDs was calculated according to an established procedure. Quinine sulfate in 0.1 M H2SO4 (QY of 54%) was chosen as a standard [37]. The emission spectrum at the excitation wavelength of 360 nm was recorded by a fluorescence spectrophotometer, and its absorbance at 360 nm was measured by an UV-vis spectrophotometer. To minimize the re-absorption effects, the absorbencies in the 10 mm fluorescence cuvette were kept under 1.3 at the excitation wavelength of 360 nm. Subsequently, we measured the absorbance and fluorescence emission spectra of the synthesized CQDs at an excitation wavelength of 340 nm. In addition, the absorbance values were acquired with the intensities below 0.1. All of the above measured integrated areas for the fluorescence emission peaks were obtained by the origin software. The QY of CQDs was determined at the excitation wavelength of 340 nm by the following equation:
$Q_X=Q_{st} \frac{I_X}{I_{st}} \frac{A_{st}}{A_X}( \frac{\eta_X}{\eta _{st}})^2$ (1)
where Q is the QY, I is the measured integrated emission intensity, η is the refractive index of the solvent, and A is the optical density. The subscript “st” refers to standard with known QY and “X” for the sample.
The morphology and the size distribution of CQDs-120-24 are shown in Fig. 2(a). It can be found that as-prepared CQDs show an uniform size and nearly sphere-like. Many defects in the products are formed in a closed reactor at a high temperature due to the interaction of functional groups on the AMP, which are conducive to the formation of CQDs [38]. The fitting curve reveals that the average size of CQDs is about 2.8 nm. This is smaller than that of prepared CQDs in previous reports as listed in Table 1 [[39], [40], [41], [42]]. As shown in Fig. 2(f) (high-resolution TEM image of CQDs-120-24), it can be observed that the interlayer spacing is about 0.33 nm, which agrees well with the (002) spacing of graphitic carbon [43]. As shown in Fig. 2(b) and (c), it can be seen that the size of CQDs-150-48 and CQDs-180-48 is slightly larger than that of CQDs-120-24. Moreover, the size distribution is wider compared with that of CODs-120-24. This result indicates that the hydrothermal temperature of 120 °C and holding time of 24 h is more suitable to synthesize CQDs with small and homogeneous size. As shown in Fig. 2(d) and (e), the morphologies of N-CQDs and Cl-CQDs are similar to that of CQDs-120-24, but the particle size changes slightly. The average diameter of N-CQDs and Cl-CQDs is 4.5 nm and 4.2 nm, respectively.
Fig. 2. TEM images and the size distribution graphics of (a) CQDs-120-24, (b) CQDs-150-48, (c) CQDs-180-48, (d) N-CQDs, (e) Cl-CQDs and (f) HRTEM image of CQDs-120-24.
Table 1 Representative synthesis, particle size and yield of CQDs in the previous reports.
| Precursor | Synthetic method | Size in diameter (nm) | Yield | Refs |
|---|---|---|---|---|
| Dopamine | Hydrothermal at 180 °C | 3.8 | 12% | [39] |
| Grass Saccharide and PEG | Hydrothermal at 180 °C Microwave (500 W) | 2-22 2.75 ± 0.45 | 2.5%-6.2% 6.3% | [40] [41] |
| Glucose | Alkali or acid assisted ultrasonic | <5 | 7% | [42] |
The functional groups on the CQDs and modified CQDs are investigated by FTIR. As shown in Fig. 3, CQDs-120-24, N-CQDs and Cl-CQDs show an obvious R-O-R stretching peak at 1081 cm-1 [44], C=O stretching peak at 1610 cm-1 and broad C-OH stretching peaks at 3445 cm-1 [45,46]. Compared with CQDs-120-24 and N-CQDs, the adsorption peaks at 1340 and 2070 cm-1 in the FTIR spectrum of N-CQDs are attributed to the stretching vibrations of C-N and C=N groups. Besides, the R-COOR and C-Cl stretching vibration is evidenced at 1403 cm-1 and 719 cm-1 in the FTIR spectrum of Cl-CQDs, which indicates that Cl is successfully attached to the surface of CQDs.
Fig. 3. FTIR spectra of CQDs-120-24, N-CQDs and Cl-CQDs.
The XPS was used to investigate the composition and chemical bonding of the CQDs-120-24, N-CQDs and Cl-CQDs. Two dominant peaks at 284.8 and 531.5 eV in the XPS spectrum (as shown in Fig. 4(a)) are attributed to C1s and O1s, suggesting the existence of C and O in CQDs-120-24. As shown in Fig. 4(d), the high resolution of the C1s spectrum exhibits the peaks at 284.5, 285.5, 286.6 and 287.2 eV, demonstrating that the CQDs-120-24 contains C=C, C-C/C-H, C-OH and C=O groups [[47], [48], [49]]. It is notice that the three peaks at 284.8, 399.1 and 531.5 eV in Fig. 4(b) are attributed to C1s, N1s and O1s in N-CQDs. The high resolution of the C1s spectrum in Fig. 4(e) exhibits the peaks at 284.5, 285.2, 285.5, 286.6 and 287.2 eV, demonstrating that the N-CQDs contains C=C, C-N, C-C/C-H, C-OH and C=O groups [49,50]. In addition, the three peaks at 284.8, 198.7 and 531.5 eV in Fig. 4(c) are attributed to C1s, Cl2p and O1s in Cl-CQDs. The high resolution of the C1s spectrum in Fig. 4(f) exhibits the peaks at 284.5, 285.5, 286.6 and 287.2 eV, demonstrating that Cl-CQDs contains C=C, C-C/C-H, C-Cl/C-OH and C=O groups [49]. This result is accordance with the analysis of FTIR spectra.
Fig. 4. (a), (b), and (c) the full binding energy spectra of CQDs-120-24, N-CQDs and Cl-CQDs, respectively; (d), (e) and (f) the high resolution of the C1s spectrum for CQDs-120-24, N-CQDs and Cl-CQDs, respectively.
The UV-vis and fluorescence spectra were used to study optical performances of synthesized CQDs under different conditions. The adsorption peaks of CQDs in UV-vis spectra are ascribed to the electronic transitions between bonding and antibonding orbitals. As shown in Fig. 5(a), there is a broad peak in the range of 250-290 nm, attributed to the typical absorption of aromatic π system or the n-π* transition of the carbonyl [51,52]. As shown in Fig. 5(b), it can be seen that UV-vis spectra of CQDs-120-24, N-CQDs and Cl-CQDs exhibit significant differences. There are no obvious absorption peaks in the UV-vis spectrum of N-CQDs, which is different from the previous report [53]. Nevertheless, the Cl-CQDs show a significant broad absorption band around 330 nm due to the increasing of π-π* transition [54]. According to the UV-vis and XPS spectra, we infer that the amino groups on the CQDs can increase the surface traps. All samples exhibit the fluorescence emission peaks at 380 nm and 420 nm at an excitation wavelength of 340 nm (as shown in Fig. 5(c)). In addition, the fluorescence intensity of CQDs-120-24 is strongest under the same conditions, confirming the optimum conditions for synthesizing CQDs. This result is consistent with the TEM analysis. The calculated QY of CQDs-120-24 according to Eq. (1) is 27.6%, which is higher than that of CQDs derived from dopamine (12%), grass (2.5%-6.2%), saccharide and PEG (6.3%) and glucose (7%) [[39], [40], [41], [42]] (as shown in Table 1). Moreover, the fluorescence intensity of as-prepared CQDs is reduced due to the particle agglomeration when increasing the hydrothermal temperature and prolonging the holding time. As shown in Fig. 5(d), it can be seen that the fluorescence intensity of N-CQDs and Cl-CQDs is lower than that of CQDs-120-24. This result is different from the previous report [29], which may be ascribed to the different internal structures of carbon sources. Furthermore, the emission peaks of N-CQDs and Cl-CQDs exhibit a slight red-shift due to the functional groups change of modified CQDs.
Fig. 5. (a) UV-vis and (c) PL spectra of CQDs derived from AMP under different conditions, (b) UV-vis and (d) PL spectra of CQDs-120-24, N-CQDs and Cl-CQDs.
As shown in Fig. 6(a), UV-vis spectra of Rh B solution in the range of 330-370 nm and 480-600 nm change significantly before and after adding N-CQDs. The intensity of the two adsorption peaks decreases obviously after adding N-CQDs, indicating that the structure of Rh B molecule has experienced great change in the presence of N-CQDs and it undergoes an effective degradation. The photocatalytic degradation rate is calculated according to the following equation:
D=(Co-C)/Co×100% (2)
where Co is the concentration of the original substance, and C is the concentration of the substance after degradation.
Fig. 6. (a), (b) and (c) the UV-vis spectra of Rh B, MB, and IC when CQDs-120-24, N-CQDs and Cl-CQDs are added, respectively under natural light for 4 h. (a) contains the UV-vis spectra of Rh B when only hydrogen peroxide was added.
According to Eq. (2), the calculated degradation rate of N-CQDs on Rh B is about 97%. The absorption peak of Rh B solution in the range of 480-600 nm after adding Cl-CQDs is slightly weakened, indicating that its catalytic effect (the degradation rate 25%) is weaker than that of N-CQDs. As shown in Fig. 6(b), MB can be degraded in the presence of N-CQDs and Cl-CQDs according to the change of the absorption peak in the range of 480-600 nm. The calculated degradation rate of Cl-CQDs on MB is 54% and it is higher than that of N-CQDs (23%). As shown in Fig. 6(c) (UV-vis spectra of IC before and after the degradation), the number of auxochrome groups of IC in the range of 500-640 nm is decreased via the degradation, resulting in a change in its internal structure and displaying a lighter color for the solution. Similarly, the degradation rate of Cl-CQDs on IC (60%) is higher than that of N-CQDs (56%). As a contrast, the degradation of hydrogen peroxide on Rh B was performed (as shown in Fig. 6(a)). It can be found that the degradation rate is only 4% in the presence of hydrogen peroxide without N-CQDs, indicating that N-CQDs play a major role in the catalytic degradation of Rh B.
The UV-vis spectra of Rh B after adding N-CQDs under natural light for different times were used to further assess the photocatalytic activity of N-CQDs on the degradation of Rh B. The reduction kinetics of degrading Rh B was investigated according to Langmuir-Hinshelwood dynamic model [55].
dc/dt=kKc/(1+Kc )(3)
where c is the concentration at any time, k and K are the limiting rate constants of reaction at the maximum coverage under the given experimental conditions and equilibrium constant.
When concentration of substrate was much less than 1, Eq. (3) can be simplified to pseudo-first-order kinetic equation (as shown in Eq. (4)).
-ln$(\frac{C_o}{C})$=kt (4)
where C0 and C are the equilibrium concentration of adsorption and the concentration of Rh B at the radiation time of t, respectively, and k is the apparent rate constant.
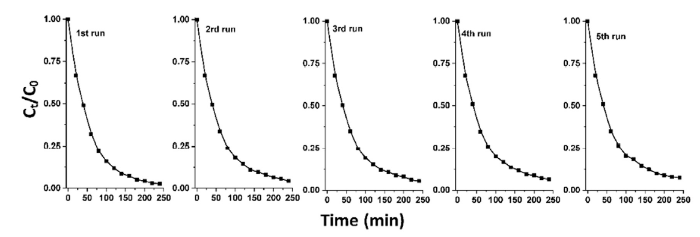
Time dependent UV-vis spectra and the corresponding plot of ln(Ct/C0) vs. time for Rh B under the photocatalysis of N-CQDs are shown in Fig. 7(a) and (b). The absorption peak of Rh B at 554 nm immediately decreases with the prolonging of time after adding N-CQDs, indicating the gradual degradation of Rh B by N-CQDs. The maximum absorption peak of Rh B solution in the visible region is weakened rapidly, while the maximum absorption peak in the UV region does not change obviously. Although the phenylamino groups and carbonyl groups of Rh B can be gradually destroyed, the backbone structure is not completely decomposed. The maximum absorption peak position shifts to the blue during the photocatalytic degradation of Rh B, which confirms that Rh has been generated due to the deethylation of Rh B [56]. In addition, the catalytic reduction of Rh B within 4 h also can be confirmed by the solution color change from pink to transparent. Moreover, the result indicates that the photocatalytic degradation of Rh B is well fitted with pseudo first-order kinetics and the degradation rate constant is 0.02463 min-1.The catalytic performance of N-CQDs for repetitively using 5 times is shown in Fig. 8. It can be observed that the degradation rate of Rh B only decreases slightly after each recycling, indicating the excellent photostability of N-CQDs. This is ascribed to the loss of a few N-CQDs during the reused process of the centrifugation and re-addition. However, the degradation rate of N-CQDs on Rh B still maintains 93% after repetitively used 5 times.
Fig. 7. (a) Time dependent UV-vis spectra of Rh B in the presence of N-CQDs, (b) the corresponding plot of ln(Ct/C0) vs. time of Rh B in the presence of N-CQDs.
Fig. 8. Photodegradation profiles of Rh B for repetitvely using 5 times as a function of reaction time using N-CQDs as the catalysts under natural light for 4 h.
Photocatalysis is induced by the generated carriers, such as excess electrons (e-) and holes (h+). When the photons with the energy of hv irradiate CQDs, they are excited by the photon, whose energy is higher than the energy band of CQDs, and then the electrons transit to excited state from ground state (as shown in Eq. (5)). These electrons and holes are separated and migrated to the surface of CQDs, and this process will promote the formation of ·OH and ·O2-1. It is notice that ·OH can degrade organic dyes according to the previous report [34]. The catalytic degradation mechanism of CQDs on organic dyes is shown in Fig. 9.
CQDs+hv→e-+h+ (5)
Fig. 9. Schematic illustration for the catalytic degradation mechanism of CQDs on organic dyes.
Up-conversion performance of luminescent (UCPL) could take advantage of the visible light to trigger in-depth researches in the field of photocatalysis [49]. The as-prepared CQDs samples in this paper show the down-conversion characteristics opposite to the UCPL. However, due to the intense induction of CQDs to generate protons by visible light, some CQDs doped with impurity elements (such as N, S, Cl) still exhibited an excellent photocatalytic performance [57,58]. Because unpaired electrons of dangling bonds on the CQDs can react with the doping elements to form new electronic states, the separation and recombination of electron-hole pairs by photo-exciting are changed and further improve the catalytic performances. When the surface of CQDs was doped with Cl atom, the surface energy of the CQDs could migrate upwardly and downwardly, respectively. Therefore, the formed electric field inside the Cl-CQDs accelerates the separation of electron-hole pairs and the transition of carriers, generating a higher photocatalytic activity. Unpaired electrons in N atom can integrate with CQDs, changing the electronic state and electron transition characteristics on the surface of CQDs. According to the catalytic mechanism of CQDs [34], UV-vis spectra of modified CQDs show a wider absorption band (as shown in Fig. 4(b)), inferring that they can absorb more energy and then generate more electrons and holes. Thus, photocatalytic effects of modified CQDs on organic dyes are improved [59].
The degradation efficiency of different photocatalysts on organic dyes is listed in Table 2 [[60], [61], [62], [63]]. Compared with other works, the obtained N-CQDs in our work exhibit a relatively higher degradation efficiency in the mild condition with the same time. It indicates that N-CQDs are good candidate for the promising photocatalyst.
Table 2 Degradation efficiency of different photocatalysts on organic dyes.
| Composite | Organic dyes | Light region | Degradation efficiency | Reference |
|---|---|---|---|---|
| N-CQDs | Rh B | Visible Light | 97%/240 min | This work |
| TiO2/C | Rh B | Visible light | 84%/360 min | [60] |
| CdS- G | Alcohol | Visible light | 80%/300 min | [61] |
| G-ZnO | MB | UV light | 80%/240 min | [62] |
| G-TiO2 | MB | UV light | 75%/180 min | [63] |
This work describes an facile approach to synthesize the fluorescent CQDs using AMP as the carbon source via a hydrothermal method. When the hydrothermal temperature is 120 °C and the soaking time is 24 h, the as-prepared CQDs have the uniform size of about 2.8 nm. In addition, the maximum QY is 27.6% at an excitation wavelength of 340 nm. When the CQDs are modified with ammonia or thionyl chloride, the particle size increases and the fluorescence intensity reduces. As-prepared CQDs in this study exhibit the down-conversion characteristic. N-CQDs show a high photocatalytic efficiency in degrading Rh B under nature light, and the degradation percentage is about 97% for 4 h irradiation. The photocatalytic degradation of Rh B by N-CQDs is well fitted with pseudo first-order kinetics and the degradation rate constant is 0.02463 min-1. The degradation percentages of on MB and IC with Cl-CQDs are 56% and 60% for the 4 h irradiation, respectively, which is higher than that with N-CQDs. Due to the electric field formed in the N-CQDs and Cl-CQDs, the photocatalytic activity of the modified CQDs is improved significantly. Therefore, theses synthesized CQDs can be active in the photocatalytic degradation of organic dyes.
This work is supported by the fund of the Beijing Laboratory for Food Quality and Safety, Beijing Technology and Business University (Grant No. FQS-201709), China Postdoctoral Science Foundation Funded Project (Grant No. 2016M592824), the Science and Technology Plan of Yulin City (Grant No. 2016-16-7) and the Science and Technology Plan of Beilin District (Grant No. GX1710).
The authors have declared that no competing interests exist.

 WeChat
/
| 〈 |
|
〉 |


