


Notch Effect of Materials: Strengthening or Weakening?
[Qu Ruitao, Zhang Peng, Zhang Zhefeng*  ]
]
]
|
|


Notch is a very important geometry with widespread applications in engineering structural components. Finding a universal equation to predict the effect of notch on strength of materials is of much significance for structural design and materials selection. In the present work, we tried to find this universal equation from experimental results of metallic glasses (MGs) and other materials as well as theoretical derivations based on a universal fracture criterion (Qu and Zhang, Sci. Rep. 3 (2013) 1117). Experimental results showed that the notch effect of the studied MG was affected by the notch geometry characterized by the stress concentration factor
Notch, which is one source of stress concentrations in engineering components, plays very important roles during safety designing. The study on notch effect of materials is of much significance for assessing the sensitivity of materials to notches, holes, grooves or other geometrical discontinuities [1], [2], [3] and [4]. For this reason, diverse efforts were expended in past several decades, and a large number of great advances have been made. For examples, the notch effects in different kinds of materials such as crystalline metals and alloys, ceramics, and some composites have been well summarized by Zheng et al. [2]; and several methods, such as slip line field theory, finite element analysis (FEA) and Neuber's stress analysis, etc., have also been applied to reveal the effects of notch [4], [5], [6] and [7]. However, a universal understanding on the notch effect from a new perspective by overlooking all kinds of materials is still lacking, especially for the question: how does notch affect the strength of materials, strengthening or weakening?
The lack of a universal understanding on notch effect may originate from the lack of a universal fracture criterion applicable for all kinds of materials ranging from ductile crystalline metals to brittle ceramics. In 2005, Zhang and Eckert [8] proposed a criterion named the ellipse criterion, which is proved to be a unified fracture criterion unifying the classical four criteria [1] and [9], i.e., the maximum normal stress (M–N) criterion, the Tresca criterion, the von-Mises criterion and the Mohr–Coulomb (M–C) criterion. The subsequent experiments on some advanced high strength materials such as metallic glasses, nanocrystalline and ultra-fine grained metallic materials have shown that the ellipse criterion can be used to effectively predict the tensile fracture behaviors of these materials [10], [11] and [12]. Very recently, the ellipse criterion was further extended into a universal fracture criterion by Qu and Zhang [13]. Experimental data of abundant materials have been used to examine the extended ellipse criterion. It is concluded that this criterion has the ability to quantitatively interpret the critical fracture strength of various materials from ductile crystalline metals to brittle ceramic materials in various stress states including tension, compression, shear and others. This newly developed universal fracture criterion may provide us such an opportunity to theoretically analyze the effects of notch for a wide range of materials.
In a previous work [14], we investigated the notch tensile behaviors of pure Cu, Ti3SiC2 ceramic and two Zr-based metallic glasses. Metallic glasses (MGs), which have many promising properties (especially the very high strength), are considered as one kind of newly emerging advanced materials with great potentials for structural applications [15]. We found that the studied MGs showed very unique notch behaviors: not only “notch strengthening” but also “notch toughening”, which means that both the nominal strength and plasticity of notched MG sample are larger than those of the smooth one. This is completely different from the conventional materials. For typical ductile crystalline metal Cu, it shows notch strengthening effect but a lower tensile plasticity for notched sample [14]. Typical brittle ceramic Ti3SiC2 displays only notch weakening, which means that the notch substantially reduces the original strength of Ti3SiC2. Besides the notch effect, the uniqueness of MGs can also be found in other aspects. For example, the tensile plasticity for most monolithic MGs is nearly zero [16], which endows MGs being called as brittle materials, while the fracture toughness can be very high (e.g., KIC >100 MPa m1/2 for some MGs [17] and [18]). These interesting behaviors of MGs may break down the traditional perceptions in textbook of materials science [1] and [3]. For example, the tensile static toughness ΓT, which is the area of tensile stress–strain curve and represents the work done by external stress to break a tensile sample, is traditionally considered to be positively related to the fracture toughness KIC, which characterize the crack propagation resistance and is consistent with the fracture energy. However, for MGs, this may not be true. To clearly elucidate this, we tried to compare ΓT and KIC for several kinds of materials. Since the data for ΓT are very rare while the yield strength σy, ultimate tensile stress (UTS) σT and plastic elongation ɛp are easily obtained from stress–strain curve, as illustrated in Fig. 1(a), we approximately calculated the tensile static toughness ΓT with the following expression by simply assuming that all materials behave in a linear-hardening mode during plastic deformation range and fracture at necking point:
where Eis Young's modulus. Although there must be some errors between the calculated ΓTfrom Eq(1).and the real one due to the deviation of the above simple assumption from the real situation of each material, the calculated results should be possible to reflect the trend of static toughness and can be used for qualitative comparison. We chose some engineering materials and several kinds of Zr-based MGs and summarized their calculated static toughness ΓTand fracture toughness KICin Fig. 1(b). As expected, there is an increasing trend for traditional materials including ceramics and crystalline metals as increasing KIC, while for all studied Zr-based MGs, ΓT= 20 kJ/m3, is nearly a constant, although the fracture toughness varied in a wide range of 20–110 MPa m1/2. Since the yield strength and the elastic yield strain for Zr-based MGs are similar, the constant static toughness is actually consistent with the zero tensile plasticity. Then why are MGs so unique to show high fracture toughness but poor tensile plasticity? Owing to the similar stress field between crack tip and notch tip and the consistency between notch toughness and fracture toughness, the uniqueness associated with fracture toughness may be consistent with the uniqueness on notch effect of MGs.
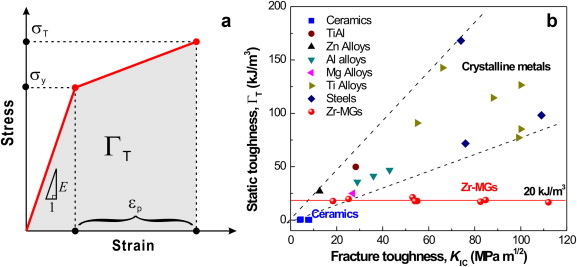 | Fig. 1. (a) Illustrations of a simple stress–strain curve with linear-hardening behavior and the corresponding mechanical property parameters. (b) Comparison of tensile static toughness and fracture toughness of various different materials. The relevant data were collected from Refs. [17], [19], [20], [21], [22], [23], [24], [25], [26], [27] and [28] and the tensile static toughness were approximately calculated according to Eq.(1). |
In this work, we firstly conducted notch tensile tests of a Zr-based MG to study the effect of stress concentration factor Kt of notch geometry on the strength and plasticity. Then based on the previous and the present experimental results we will analyze the reasons for the unique notch effect and the high toughness of MGs. Finally, we will try to explain the mechanism of notch strengthening or weakening by deriving a universal equation to predict the different notch effect of various materials under various notch conditions based on the newly developed universal fracture criterion.
Zr52.5Cu17.9Ni14.6Al10Ti5 (Vit-105 MG) plates were prepared by copper mold casting in a high-purity argon atmosphere. The amorphous structure of the casted plates was confirmed by standard X-ray diffraction [29]. Dog-bone shaped tensile samples with gauge dimensions of 3 mm (length, l) × 1 mm (thickness, t) were cut from the casted plates by an electric spark cutting machine. Notches, which had a U-shape with dimensions of ∼0.2 mm in width and ∼0.1 mm in notch radius, were introduced also by the electric spark cutting machine. In the previous work, we mainly studied the differences in the notch effect between MGs and other conventional materials. In this study, we focus our attention on the effect of the stress concentration factor Kt, which was treated as a variable by varying the notch depth and sample width. The stress concentration factor Kt was calculated according to reference [30]. Detailed information such as the dimensions of samples and notches and the calculated Kt is listed in . A notched sample is sketched in Fig. 2 to show the definitions of the dimension parameters. Before the tensile tests, the external surfaces of all specimens were grinded and finally polished by 1.5 μm diamond paste. All tensile tests were carried out using an Instron 5982 testing machine at a nominal strain rate of 10-4 s-1 at room temperature. We used an Instron extensometer to measure the sample strain. The deformation and fracture features were observed with a Leo Supra 35 scanning electron microscope (SEM).
| Table 1. Sample and notch dimensions, stress concentration factor Kt and measured UTS values in the present experiments using tensile samples with and without notches. The sample with label “UNTS” is the unnotched tensile sample, while the others are notched ones. The material of the samples is Vit-105 MG |
 | Fig. 2. Sketched geometry of the notched tensile samples and dimension parameters. |
Figure 3 presents the typical nominal stress–nominal strain curves of two notched samples and the unnotched tensile sample (UNTS) of Vit-105 MG. The nominal stress is defined as the load divided by net section area ( weff × t) [14]. The differences among the slopes of three curves should be resulted from different sample stiffness. Among these three cases, NTS-1 has the largest slope, which is consistent with the smallest effective width (net width between two notch roots, see ) and thus the requirements of the lowest force and the smallest overall displacement to get a similar stress. Besides the stiffness, we can see that the sample geometry also affects tensile plasticity and nominal strength. Nearly no obvious evidences for plastic deformation can be observed for the unnotched sample UNTS and the notched sample with Kt = 2.7, while obvious serrated flows can be found in the nominal stress–nominal strain curve of the NTS-1 sample (see the inset of Fig. 3). The serrations in the curve imply that plastic deformation through shear banding mechanism occurs [31]. The tensile plasticity observed in notched samples has been also reported elsewhere [14] and [31]. From the present results ( Fig. 3 and the results of other samples), we found the plasticity in notch tension becomes larger when decreasing the stress concentration factor Kt of notches. For the strength, we can also see that as decreasing Kt, the nominal strength σN increases, which leads to an increased notch strength ratio (NSR). NSR is the ratio of the ratio of nominal UTS of the notched sample σN to UTS of the unnotched sample σT, i.e., NSR = σN/ σT. Usually, NSR is used to assess the notch effect on strength of materials [2], [3] and [4]. For example, NSR >> 1 means notch strengthening, while NSR << 1 means notch weakening, and NSR ~ 1 indicated that the strength of material is insensitive to notch. Obviously, the nominal strength of NTS-1 with small Kt = 2.23 is higher than that of the unnotched sample UNTS, showing a notch strengthening behavior with NSR a little larger than 1. For NTS-3 with Kt = 2.7, the nominal strength is close to that of UNTS, showing a notch insensitive behavior with NSR ~ 1. From these results it can be concluded that whether notch makes strengthening or weakening is determined not only by the material itself, but also by the stress concentration of notches with different geometry.
 | Fig. 3. Nominal tensile stress–nominal strain curves of the notched samples (NTS-1 and NTS-3) and the unnotched sample (UNTS) of Vit-105 MG. Inset shows an enlarged curve at the plastic deformation stage of NTS-1 sample. For notched samples, the nominal tensile stress is defined as the ratio of load ( F) divided by the reduced cross sectional area ( weff × t), while for unnotched sample it is the engineering stress. |
To further clarify the dependence of NSR on Kt, we summarized the data of some Zr-based MGs (including the present Vit-105 MG, and the Vit-1 MG with composition of Zr41.25Ti13.75Ni10Cu12.5Be22.5, Zr54.5-MG with composition of Zr54.5Cu20Al10Ni8Ti7.5 in literature [5] and [14]) and some engineering materials (including Al2O3 ceramic and AZ80A Mg alloy [2]), which have been presented in Fig. 4. Apparently, all materials in Fig. 4 show a similar trend: with increasing Kt, NSR decreases, although the ductile 45 steel decreasing slowly in the Kt range shown in the figure. However, the data of Zr-based MGs locate overall above those of AZ80A Mg alloy and Al2O3 ceramics, which means that the notch sensitivity for Zr-based MGs is much weaker than Al2O3 ceramics, even weaker than AZ80A Mg alloy. Although NSRs for the Zr-based MGs are close to 1 or larger than 1 for small Kt, showing a notch strengthening or insensitive behavior, the sharp notches with large Kt can still be detrimental to the nominal strength. This is consistent with the observations by Lowhaphandu and Lewandowski [20] and Fujita et al. [28] that the notch toughness of MGs decreases with decreasing the notch tip radius. In the previous work [14], we compared NSRs of a lot of materials at Kt = 3, which is also the stress concentration factor for a small round hole in a plate subjected to far-field tensile stress. We found that at Kt = 3, for MGs NSRs were around 1, showing a notch insensitive nature; while for ductile crystalline metals NSR >> 1, showing a notch strengthening behavior; and for brittle materials like ceramics NSR << 1, exhibiting a notch weakening behavior [14]. How does notch affect the nominal strength for different materials? We will try to answer this question in Section .
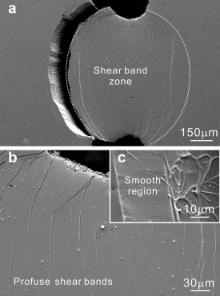
The tensile plasticity observed in the nominal stress–strain curves of notched samples with small Kt can also be evidenced by SEM observations on deformation and fracture features, as shown in Fig. 5. Profuse shear bands initiated from notch roots and grew approaching to the sample center, and finally forming a shear band zone between two notches, as shown in Fig. 5(a)–(b). Fracture happens along a penetrated shear band which locates nearly at the boundary of the shear band zone. Evidences for the shear fracture mode can also be found from the fracture surface. As shown in Fig. 5(c), smooth region and vein pattern were vividly observed. These observations are similar to the previous results [14], confirming again that the shear banding mechanism dominates the notch plasticity of MGs.
 | Fig. 5. SEM observations on the deformation and fracture features of a notched sample (NTS-2) of Vit-105 MG with Kt = 2.37. (a) A shear band zone; (b) profuse shear bands observed around the notch root; (c) smooth region and vein patterns observed on the shear fracture surface. |
The above results and our previous results on notch effect of materials indicate that the notch affects both the nominal strength and tensile plasticity, and this notch effect depends on not only the material itself but also the stress concentration factor of notch geometry. In the following, we will firstly present an explanation on that why MGs showed notch plasticity and high toughness, and then we will propose a semi-quantitative mechanics model based on the newly developed universal fracture criterion to predict how notch affects the strength of various materials: strengthening or weakening?
To understand why MGs have an enhanced plasticity by notches, while ductile crystalline metals and ceramics do not have, let us consider the basic deformation or fracture mechanisms of these materials. Slip bands and shear bands are the carriers of plastic deformation at room temperature for ductile crystalline metals and MGs, respectively [32]. Comparing the two kinds of bands, we found: (1) the driven forces for both bands are shear stress, although the normal stress influences the shear banding more than the dislocation slipping [10], [16] and [33]; (2) both of them form shear steps at the sample surface, despite shear steps by shear banding are often much larger. Despite these common features, the differences between shear band and slip band are more notable, as listed below. (1) It was found that the amount of the shear offset during one shear event (a serration in stress–strain curve) is on the order of 1 μm [34] and [35], while the amount of the slip offset in the process of one dislocation slipping event (e.g., one edge dislocation initiates and propagates to penetrate the sample) is on the order of 1 Å (~a Burgers vector) [32]; (2) since the greater shear plastic deformation localizes in shear bands, the structural damage happens and shear resistance decreases during shear banding (i.e., “work-softening”) [36], while nearly no structural change occurs in slip bands of crystalline metals due to the very small plastic strain in one single slip band; (3) considering the critical energy density for initiating a shear band or a dislocation slip, namely the energy density at yielding
According to the experimental results and above analysis, we simply illustrated the nominal stress–strain responses and deformation or fracture features of samples with or without notches of three kinds of materials in Fig. 6. It should be noted that only the relative magnitudes of sample stiffness, strength and plasticity are meaningful in the sketches of nominal stress–strain responses. For monolithic MGs, shear bands are the only carrier of plastic deformation at room temperature. Hence the more shear banding deformation, the more plasticity. This means that a larger plasticity may be obtained only when (1) there are a larger number of shear bands, or (2) the deformation in one shear band is more stable and has a larger resistance to crack. Under uniaxial tensile loading, the homogenous stress state facilitates the formation and penetration of single shear band, leading to a final fracture with limited number of shear bands, thus showing nearly zero tensile plasticity, as illustrated in Fig. 6(a1). However, under notch tension, the stress is not uniform anymore. There are stress concentrations around notch roots and also a negative stress gradient as increasing distance away from notch roots [37]. The stress concentration makes it easy across the threshold for shear band initiation (i.e., the critical stress or critical strain energy density), and the stress gradient stabilizes the shear band propagation. Thus a shear band zone in notch tension is formed and contributes to the entire tensile plasticity, as shown in Fig. 6(a2). For ductile crystalline metals, if we only concern the deformation mechanism of dislocation slipping and neglect necking, we can illustrate the deformation features in Fig. 6(b1)–(b2). The uniform tensile stress state in the unnotched sample and the work-hardening ability of materials make plastic deformation of dislocation slipping homogenously distributed over the whole gauge length of the sample, and finally a large tensile plasticity will be gained. However, the stress concentrations in notched samples constrain the plastic deformation mainly in a small zone (plastic zone) between two notch roots (see Fig. 6(b2)). The insufficient plastic deformation of the notch tensile sample surely leads to a decreasing ductility. Another reason for notch induced brittleness in crystalline metals is the negative pressure induced by the tri-axial tensile stress around notch roots, which may facilitate the formation of voids and the initiation of cracks [4]. For conventional brittle materials like ceramics, cracking is the dominated mechanism in response to the external loading [32]. The M–N fracture criterion is often applicable to predict the critical fracture condition. Then once the local maximum normal stress in the sample approaches to the critical normal stress, cracking and the subsequent fracture of sample occur. In notched sample, the stress concentration around notch root greatly increases the local stress level, which leads to a final fracture at a lower nominal stress, namely “notch weakening”, as shown in Fig. 6(c2).
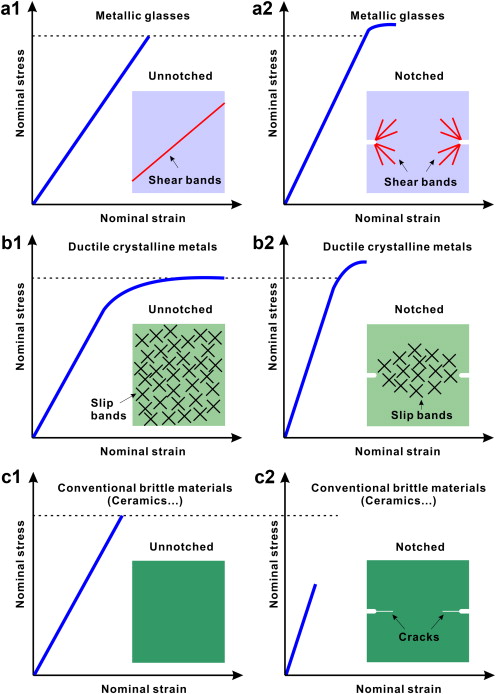 | Fig. 6. Illustrations of the nominal stress–strain responses and deformation and fracture behaviors of unnotched and notched tensile samples of MGs, ductile crystalline metals and conventional brittle materials like ceramics. |
To explain the mechanism of notch strengthening or weakening for different materials and different notch geometry, it is required firstly to examine what the real stress states around notch root are. Here for simplicity we apply the analytical solution for stresses near a central hole in a plate with far-field tensile stress to semi-quantitatively describe the stress field around the root of a U-shaped notch with Kt = 3. Since the two geometries have the same stress concentration factor and the similar shape (between the U-shape notch root and a half-hole), the solutions we used here should be reasonable for a semi-quantitative analysis. The three principal stresses at the notch plane thus can be approximately written as [37] and [38],

where σnssis the net stress or the nominal stress; ris the notch radius; xis the distance away from the center of the U-notch tip circle (see the inset sketch in Fig. 7(a)); νis the Poisson's ratio.
 | Fig. 7. Elastic stress distribution in front of notch tip. (a) Normalized elastic stress distribution for a point on the notch plane according to Eq. (2a), (2b) and (2c) with Poisson′s ratio ν = 0.35; (b)–(d) illustrations of Mohr′s diagrams of the stress states in different location with different x. |
According to Eqs. (2a), (2b) and (2c), the variations of the three principal stresses with the distance x can be plotted in Fig. 7(a). The strongest stress concentration locates at the notch tip ( x = r), where σy and σz have the maximum values, while the stress in the direction of notch plane σx at notch tip is surface stress and equals zero. With increasing the distance x, both σy and σz decrease dramatically. When x = 3 r, σy approaches to the lowest value and is close to the nominal stress σnss. As increasing x, σx firstly increases and then decreases, and the maximum σx appears at the position with x = x0 ≈ 1.4 r. The maximum shear stress at notch plane is the half of ( σy - σx). We plotted the distribution of ( σy - σx) as the dashed line in Fig. 7(a). Away from the notch tip, the maximum shear stress firstly rapidly drops and then keeps at a constant stress level of about σnss/2 at x ≈ 1.7 r. If the 3D Mohr's stress circles [1] are used to graphically represent the change of stress states, the changes of the maximum normal stress and the maximum shear stress should be clearly seen. As shown in Fig. 7(b), the largest Mohr's stress circle can be found in the notch tip, which is much larger than the Mohr's circle corresponding to the nominal tensile stress σnss (the red dotted circle). With increasing x, the 3D Mohr's stress circles become smaller, indicating both the maximum normal stress σy and the maximum shear stress ( σy - σx)/2 decrease, while the Mohr's circle of nominal stress keeps no change, as shown in Fig. 7(c). When x > 1.7 r, the maximum 3D Mohr's stress circle becomes smaller than the Mohr's circle of nominal stress. At the center of the sample, the maximum stress σy is nearly the same as the nominal stress σnss, while σx approaches to zero, as shown in Fig. 7(d).
Above stress analysis indicates that the stress concentration locates in a limited size of zone ahead of notch root. The tri-axial tensile stress makes the Mohr's circle smaller, even smaller than the one corresponding to the nominal stress. To assess the notch effect on critical stress for fracture, we need a proper fracture criterion, which gives a critical fracture line in the space of shear stress ( τ)–normal stress ( σ). Since there are different types of materials, we choose a universal fracture criterion recently proposed by Qu and Zhang [13], which can be written as,
where α= τ0/ σ0is the intrinsic fracture mode factor; τ0is the critical shear fracture strength; σ0is the critical normal fracture strength; βis an extrinsic parameter describing the effect of external conditions. At room temperature and quasi-static strain rate, β= 1 for tensile stress states (i.e., σmax+ σmin≥ 0, with σmaxthe largest principal stress and σminthe smallest principal stress), which results in the same form with the original ellipse criterion [8], i.e.,
On the other hand, we consider the largest Mohr's stress circle in the 3D Mohr's circles, and assume that the critical fracture condition is when the largest stress circle of some critical position is tangent to the critical fracture line by the fracture criterion (here the ellipse criterion) [10], as shown in Fig. 8. Thus it is required to write the equation of the largest Mohr's circle as follows,

The critical condition can be calculated when there is only one common solution for Eqs.and. If A= ( σmax- σmin)/2, and B= ( σmax+ σmin)/2, then,
Under uniaxial tension, according to the ellipse criterion, the critical stress condition for fracture [10]is,
Here σTis the tensile fracture stress (UTS) of the unnotched sample. If assuming σmin/ σmax= k, then A= (1 - k) σmax/2 and B= (1 + k) σmax/2. Substituting these two equations for Aand Binto Eq.(6), one gets,
 | Fig. 8. Prediction of the critical fracture stress conditions under tri-axial tensile stress state by the ellipse criterion. |
If there are some plastic deformations around notch root like that in ductile crystalline metals or MGs, the critical position for instable fracture may not be the notch tip. Assuming the maximum principal stress at the critical point is σmax = n· Kt· σnss, where n is a constant and n ≤ 1, the notch strength ratio (NSR) then can be written as,
Or,
Noted that in Eq.(10), the term
where
According to Eq.(11) , the notch effect on the strength of materials is determined by both the intrinsic material nature (represented by M) and the extrinsic factor of the geometry of notched sample (represented by Kt). For a given material ( M is approximately constant), the NSR decreases with increasing the stress concentration factor Kt, which is well consistent with the experimental results (see Fig. 4). When Kt is kept the same, the NSR will be different for different materials. Fig. 9 plots the NSRs of various materials at Kt ~ 3 based on plenty of experimental data. The values of M for various different materials were calculated according to Eq.(11) . It can be seen that materials like ceramics with small value of M often show notch weakening behavior, while ductile crystalline metals which exhibit notch strengthening behavior have the parameter M larger than Kt ~ 3. For MGs, their strengths seem to be insensitive to notch at Kt ~ 3 and M ~ Kt ~ 3 is thus obtained.
 | Fig. 9. NSRs of various different materials as a function of M. The parameter M is calculated according to Eq.(11). Data for ceramics includes results of Al2O3 and Ti3SiC2, for metallic glasses includes results of Vit-1 MG, Vit-105 MG, Zr54.5-MG and Pd78Cu6Si16 MG, and for ductile crystalline metals includes 45 steel, Ti–4Al–3Mo–1V sheet, Ni-superalloy 713LC, and Al alloy sheets 5086-H34. Data were taken from Refs. [2], [5], [14] and [39] and the present results. |
Concerning the physical meaning of the parameter M, the following discussions from a view angle of different kinds of materials can be given. Since
For high α materials like ceramics, the fracture often happens prior to yielding with a normal fracture mode [9]. Fig. 10(a) shows the critical condition for fracture of high α materials under uniaxial tension determined by the ellipse criterion. In this case, the critical normal fracture stress σ0 is equal to the UTS ( σT) and the fracture angle θT = 90°. Under notch tension, since there is no plastic deformation mechanism for this kind of materials, the most dangerous point should be at the notch tip with the maximum tensile stress. That is, n = 1, k = 0, and M = 1. According to Eq.(11), we have NSR for high α materials: NSR=1/ Kt. For Kt = 3, we then get NSR = 0.33, which is consistent with the experimental results for ceramics, as shown in Fig. 9. The critical condition under notch tension can be drawn in Fig. 10(b). As long as the maximum stress at the notch tip approaches the critical normal fracture stress σ0 or σT, fracture happens. This is why high α materials show a notch weakening behavior.
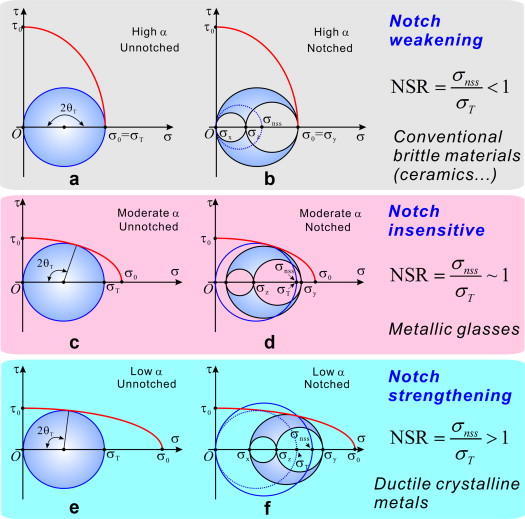 | Fig. 10. Explanation of notch effect on strength of various materials by the ellipse criterion. (a)–(b) High α materials; (c)–(d) moderate α materials; (e)–(f) low α materials. |
Materials with a decreased α often have enhanced ability to plastic deformation and also an increased resistance to normal cleavage fracture. If there is some plastic deformation around notch root, the most dangerous point should be at the boundary between the plastic zone and the central elastic zone [3]. In this case, n decreases while k increases. Hence for materials with a decreased α, M should be increased, and hence an increased NSR should be expected. These materials include some Mg alloy, cast irons etc. with limited ability to plastic deformation, as shown in Fig. 9. With further decreasing α to moderate values as those for MGs, the NSR increases to the value of ∼1 for Kt ~ 3. In this situation, the Mohr's circle for the nominal stress σnss on the net area is very close to that for fracture stress σT under uniaxial tension, as shown in Fig. 10(d). The similar strength values for nominal stress under notch tension and σT under uniaxial tension thus make MGs be called as notch insensitive materials.
For ductile crystalline metallic materials with very low α, the plastic yielding and deformation are easier to occur in the whole area between notch roots. The plastic deformation relaxes the local stresses and blunts the notch tip and lowers the Kt. The plastic deformation of ductile crystalline materials thus has been primarily constrained in the local area between notch roots. The stress state in this area is not a uniaxial one but a tri-axial stress state. The tri-axial stress state not only introduces a negative pressure which facilitates the formation of voids and makes the notched sample brittle (as discussed in Section ), but also makes the maximum Mohr's stress circle become small, which leads to a requirement of a larger nominal stress σnss than σT to touch the critical fracture line, as illustrated in Fig. 10(f). This is why some ductile crystalline metallic materials show a notch strengthening effect.
In summary, whether a material exhibits notch strengthening or weakening depends not only on the extrinsic notch geometry ( Kt), but also on the intrinsic material nature (here this is represented by the parameter M). The sharp notch with a large Kt may result in a lower NSR and notch weakening even in some ductile materials, while an MG notched sample with a small Kt can also show some notch strengthening effect. For a similar Kt, a brittle material often has a lower NSR than the ductile one, and vise versa. The value of NSR is also related to the plastic deformation around notch roots. A larger plastic zone often results in more stress relaxations and finally an enhancement of nominal fracture stress and a larger NSR. This is consistent with the present experimental observation that the MG notch sample with a larger Kt shows a limited dimension of plastic zone (not shown) and a limited overall plastic strain. Based on the universal fracture criterion (Eq.(3)), we derived a universal equation (Eq.(11)) to describe the notch effect of materials on strength. As discussed above, the dominating factors and the relationship for NSR described in the universal equation are consistent with the experimental results, indicating the rationality of the derived equation. To apply this equation quantitatively, a next-step work is required. In Eq.(11), although the physical meaning of material related constant M has been discussed for several kinds of materials, the quantitative value of M has not been well understood. Although this is complicated due to the variety and complexity of materials, the value of M can be explored in the future by detailed investigations on the fracture mechanisms of different materials. A simple example for exploring M was presented above for brittle ceramics, which have nearly no plastic deformation and thus the critical point dominating the final fracture should be at the notch tip. Knowing this we thus obtain M = 1 for brittle ceramics.
The authors thank Prof. Z.G. Wang for very helpful suggestions and careful revisions of the paper. This work was financially supported by the National Natural Science Foundation of China under Grant Nos. 51331007 and 51301174.
| 1. |
|
| 2. |
|
| 3. |
|
| 4. |
|
| 5. |
|
| 6. |
|
| 7. |
|
| 8. |
|
| 9. |
|
| 10. |
|
| 11. |
|
| 12. |
|
| 13. |
|
| 14. |
|
| 15. |
|
| 16. |
|
| 17. |
|
| 18. |
|
| 19. |
|
| 20. |
|
| 21. |
|
| 22. |
|
| 23. |
|
| 24. |
|
| 25. |
|
| 26. |
|
| 27. |
|
| 28. |
|
| 29. |
|
| 30. |
|
| 31. |
|
| 32. |
|
| 33. |
|
| 34. |
|
| 35. |
|
| 36. |
|
| 37. |
|
| 38. |
|
| 39. |
|